
 Login Sign Up


| |||||
 |  | ||||

| 12Stocks.com Market Intelligence |
Best MidCap Stocks
|
| In a hurry? Mid Cap Stocks Lists: Performance Trends Table, Stock Charts
Sort midcap stocks: Daily, Weekly, Year-to-Date, Market Cap & Trends. Filter midcap stocks list by sector: Show all, Tech, Finance, Energy, Staples, Retail, Industrial, Materials, Utilities and HealthCare Filter midcap stocks list by size:All MidCap Large Mid-Range Small |
| 12Stocks.com Mid Cap Stocks Performances & Trends Daily | |||||||||
|
|  The overall Smart Investing & Trading Score is 49 (0-bearish to 100-bullish) which puts Mid Cap index in short term neutral trend. The Smart Investing & Trading Score from previous trading session is 63 and hence a deterioration of trend.
| ||||||||
Here are the Smart Investing & Trading Scores of the most requested mid cap stocks at 12Stocks.com (click stock name for detailed review):
|


| 12Stocks.com: Top Performing Mid Cap Index Stocks | ||||||||||||||||||||||||||||||||||||||||||||||||
 The top performing Mid Cap Index stocks year to date are
Now, more recently, over last week, the top performing Mid Cap Index stocks on the move are


|
||||||||||||||||||||||||||||||||||||||||||||||||
| 12Stocks.com: Investing in Midcap Index with Stocks | |
|
The following table helps investors and traders sort through current performance and trends (as measured by Smart Investing & Trading Score) of various
stocks in the Midcap Index. Quick View: Move mouse or cursor over stock symbol (ticker) to view short-term technical chart and over stock name to view long term chart. Click on  to add stock symbol to your watchlist and to add stock symbol to your watchlist and  to view watchlist. Click on any ticker or stock name for detailed market intelligence report for that stock. to view watchlist. Click on any ticker or stock name for detailed market intelligence report for that stock. |
12Stocks.com Performance of Stocks in Midcap Index
| Ticker | Stock Name | Watchlist | Category | Recent Price | Smart Investing & Trading Score | Change % | Weekly Change% |
| FIVN | Five9 |   | Technology | 59.59 | 50 | -1.14% | 4.39% |
| TDG | TransDigm | | Industrials | 1239.50 | 78 | -0.17% | 4.36% |
| EXEL | Exelixis | | Health Care | 23.50 | 90 | -0.91% | 4.33% |
| TXRH | Texas Roadhouse | | Services & Goods | 157.22 | 83 | 0.29% | 4.31% |
| UHS | Universal Health | | Health Care | 164.24 | 65 | -1.00% | 4.30% |
| SKX | Skechers U.S.A | | Consumer Staples | 58.83 | 57 | -0.54% | 4.29% |
| AES | AES | | Utilities | 17.10 | 85 | -1.55% | 4.27% |
| ZBRA | Zebra Technologies | | Technology | 279.48 | 68 | 0.70% | 4.26% |
| BPOP | Popular | | Financials | 86.70 | 93 | -1.88% | 4.21% |
| ROL | Rollins | | Services & Goods | 44.30 | 39 | 3.34% | 4.21% |
| COLM | Columbia Sportswear | | Consumer Staples | 79.71 | 87 | -0.09% | 4.13% |
| DKS | DICK S | | Services & Goods | 203.02 | 61 | -1.20% | 4.07% |
| CNM | Core & Main | | Industrials | 56.37 | 61 | 0.64% | 4.06% |
| AVTR | Avantor | | Materials | 25.07 | 58 | -1.55% | 4.00% |
| UDR | UDR | | Financials | 37.85 | 100 | -0.11% | 3.98% |
| IPGP | IPG Photonics | | Technology | 87.63 | 64 | -0.48% | 3.98% |
| OGN | Organon | | Health Care | 18.53 | 90 | 0.98% | 3.98% |
| CIEN | Ciena | | Technology | 45.29 | 35 | 0.56% | 3.97% |
| PENN | Penn National | | Services & Goods | 17.20 | 74 | -3.62% | 3.96% |
| ENTG | Entegris | | Technology | 127.03 | 58 | -0.63% | 3.95% |
| SOFI | SoFi Technologies | | Financials | 7.39 | 17 | -1.00% | 3.94% |
| CC | Chemours | | Materials | 26.91 | 60 | -0.65% | 3.84% |
| DVA | DaVita | | Health Care | 132.68 | 61 | -0.05% | 3.80% |
| DPZ | Domino s | | Services & Goods | 491.52 | 68 | 0.78% | 3.80% |
| THC | Tenet | | Health Care | 96.72 | 56 | -1.56% | 3.79% |
| For chart view version of above stock list: Chart View ➞ 0 - 25 , 25 - 50 , 50 - 75 , 75 - 100 , 100 - 125 , 125 - 150 , 150 - 175 , 175 - 200 , 200 - 225 , 225 - 250 , 250 - 275 , 275 - 300 , 300 - 325 , 325 - 350 , 350 - 375 , 375 - 400 , 400 - 425 , 425 - 450 , 450 - 475 , 475 - 500 , 500 - 525 , 525 - 550 , 550 - 575 , 575 - 600 , 600 - 625 , 625 - 650 , 650 - 675 , 675 - 700 , 700 - 725 , 725 - 750 | ||
 | Click To Change The Sort Order: By Market Cap or Company Size Performance: Year-to-date, Week and Day |  |
|
Get the most comprehensive stock market coverage daily at 12Stocks.com ➞ Best Stocks Today ➞ Best Stocks Weekly ➞ Best Stocks Year-to-Date ➞ Best Stocks Trends ➞  Best Stocks Today 12Stocks.com Best Nasdaq Stocks ➞ Best S&P 500 Stocks ➞ Best Tech Stocks ➞ Best Biotech Stocks ➞ |
| Detailed Overview of Midcap Stocks |
| Midcap Technical Overview, Leaders & Laggards, Top Midcap ETF Funds & Detailed Midcap Stocks List, Charts, Trends & More |
| Midcap: Technical Analysis, Trends & YTD Performance | |
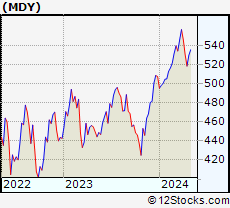
| MidCap segment as represented by
MDY, an exchange-traded fund [ETF], holds basket of about four hundred midcap stocks from across all major sectors of the US stock market. The midcap index (contains stocks like Green Mountain Coffee Roasters and Tractor Supply Company) is up by 3.34% and is currently underperforming the overall market by -0.91% year-to-date. Below is a quick view of technical charts and trends: | |
 MDY Weekly Chart |
|
| Long Term Trend: Good | |
| Medium Term Trend: Not Good | |
 MDY Daily Chart |
|
| Short Term Trend: Deteriorating | |
| Overall Trend Score: 49 | |
| YTD Performance: 3.34% | |
| **Trend Scores & Views Are Only For Educational Purposes And Not For Investing | |
| 12Stocks.com: Investing in Midcap Index using Exchange Traded Funds | |
|
The following table shows list of key exchange traded funds (ETF) that
help investors track Midcap index. The following list also includes leveraged ETF funds that track twice or thrice the daily returns of Midcap indices. Short or inverse ETF funds move in the opposite direction to the index they track and are useful during market pullbacks or during bear markets. Quick View: Move mouse or cursor over ETF symbol (ticker) to view short-term technical chart and over ETF name to view long term chart. Click on ticker or stock name for detailed view. Click on to add stock symbol to your watchlist and to view watchlist. |
12Stocks.com List of ETFs that track Midcap Index
| Ticker | ETF Name | Watchlist | Recent Price | Smart Investing & Trading Score | Change % | Week % | Year-to-date % |
| MDY | SPDR S&P MidCap 400 ETF | | 524.32 | 49 | -1.04 | 1.16 | 3.34% |
| UMDD | ProShares UltraPro MidCap400 | | 23.29 | 56 | -3.33 | 3.22 | 4.34% |
| SMDD | ProShares UltraPro Short MidCap400 | | 12.12 | 54 | 2.41 | -3.52 | -9.98% |
| MZZ | ProShares UltraShort MidCap400 | | 11.93 | 34 | 2.01 | -2.02 | -5.14% |
| MYY | ProShares Short MidCap400 | | 20.74 | 32 | 0.00 | -2.12 | -3.33% |
| 12Stocks.com: Charts, Trends, Fundamental Data and Performances of MidCap Stocks | |
|
We now take in-depth look at all MidCap stocks including charts, multi-period performances and overall trends (as measured by Smart Investing & Trading Score). One can sort MidCap stocks (click link to choose) by Daily, Weekly and by Year-to-Date performances. Also, one can sort by size of the company or by market capitalization. |
| Select Your Default Chart Type: | |||||
| |||||
| Click on stock symbol or name for detailed view. Click on to add stock symbol to your watchlist and to view watchlist. Quick View: Move mouse or cursor over "Daily" to quickly view daily technical stock chart and over "Weekly" to view weekly technical stock chart. | |||||

 | FIVN Five9, Inc. |
| Sector: Technology | |
| SubSector: Application Software | |
| MarketCap: 4253.62 Millions | |
| Recent Price: 59.59 Smart Investing & Trading Score: 50 | |
| Day Percent Change: -1.14% Day Change: -0.69 | |
| Week Change: 4.39% Year-to-date Change: -24.3% | |
| FIVN Links: Profile News Message Board | |
| Charts:- Daily , Weekly | |
| Add FIVN to Watchlist: View: Get Complete FIVN Trend Analysis ➞ | |
 | TDG TransDigm Group Incorporated |
| Sector: Industrials | |
| SubSector: Aerospace/Defense Products & Services | |
| MarketCap: 18441 Millions | |
| Recent Price: 1239.50 Smart Investing & Trading Score: 78 | |
| Day Percent Change: -0.17% Day Change: -2.12 | |
| Week Change: 4.36% Year-to-date Change: 22.5% | |
| TDG Links: Profile News Message Board | |
| Charts:- Daily , Weekly | |
| Add TDG to Watchlist: View: Get Complete TDG Trend Analysis ➞ | |
 | EXEL Exelixis, Inc. |
| Sector: Health Care | |
| SubSector: Biotechnology | |
| MarketCap: 5254.75 Millions | |
| Recent Price: 23.50 Smart Investing & Trading Score: 90 | |
| Day Percent Change: -0.91% Day Change: -0.21 | |
| Week Change: 4.33% Year-to-date Change: -2.1% | |
| EXEL Links: Profile News Message Board | |
| Charts:- Daily , Weekly | |
| Add EXEL to Watchlist: View: Get Complete EXEL Trend Analysis ➞ | |
 | TXRH Texas Roadhouse, Inc. |
| Sector: Services & Goods | |
| SubSector: Restaurants | |
| MarketCap: 2569.4 Millions | |
| Recent Price: 157.22 Smart Investing & Trading Score: 83 | |
| Day Percent Change: 0.29% Day Change: 0.46 | |
| Week Change: 4.31% Year-to-date Change: 28.6% | |
| TXRH Links: Profile News Message Board | |
| Charts:- Daily , Weekly | |
| Add TXRH to Watchlist: View: Get Complete TXRH Trend Analysis ➞ | |
 | UHS Universal Health Services, Inc. |
| Sector: Health Care | |
| SubSector: Hospitals | |
| MarketCap: 7217.66 Millions | |
| Recent Price: 164.24 Smart Investing & Trading Score: 65 | |
| Day Percent Change: -1.00% Day Change: -1.66 | |
| Week Change: 4.3% Year-to-date Change: 7.7% | |
| UHS Links: Profile News Message Board | |
| Charts:- Daily , Weekly | |
| Add UHS to Watchlist: View: Get Complete UHS Trend Analysis ➞ | |
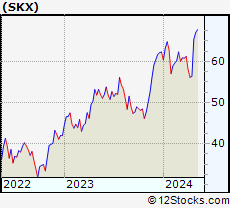 | SKX Skechers U.S.A., Inc. |
| Sector: Consumer Staples | |
| SubSector: Textile - Apparel Footwear & Accessories | |
| MarketCap: 3620.1 Millions | |
| Recent Price: 58.83 Smart Investing & Trading Score: 57 | |
| Day Percent Change: -0.54% Day Change: -0.32 | |
| Week Change: 4.29% Year-to-date Change: -5.6% | |
| SKX Links: Profile News Message Board | |
| Charts:- Daily , Weekly | |
| Add SKX to Watchlist: View: Get Complete SKX Trend Analysis ➞ | |
 | AES The AES Corporation |
| Sector: Utilities | |
| SubSector: Electric Utilities | |
| MarketCap: 9173.44 Millions | |
| Recent Price: 17.10 Smart Investing & Trading Score: 85 | |
| Day Percent Change: -1.55% Day Change: -0.27 | |
| Week Change: 4.27% Year-to-date Change: -11.2% | |
| AES Links: Profile News Message Board | |
| Charts:- Daily , Weekly | |
| Add AES to Watchlist: View: Get Complete AES Trend Analysis ➞ | |
 | ZBRA Zebra Technologies Corporation |
| Sector: Technology | |
| SubSector: Communication Equipment | |
| MarketCap: 11474.9 Millions | |
| Recent Price: 279.48 Smart Investing & Trading Score: 68 | |
| Day Percent Change: 0.70% Day Change: 1.95 | |
| Week Change: 4.26% Year-to-date Change: 2.3% | |
| ZBRA Links: Profile News Message Board | |
| Charts:- Daily , Weekly | |
| Add ZBRA to Watchlist: View: Get Complete ZBRA Trend Analysis ➞ | |
 | BPOP Popular, Inc. |
| Sector: Financials | |
| SubSector: Foreign Regional Banks | |
| MarketCap: 2671.99 Millions | |
| Recent Price: 86.70 Smart Investing & Trading Score: 93 | |
| Day Percent Change: -1.88% Day Change: -1.66 | |
| Week Change: 4.21% Year-to-date Change: 5.6% | |
| BPOP Links: Profile News Message Board | |
| Charts:- Daily , Weekly | |
| Add BPOP to Watchlist: View: Get Complete BPOP Trend Analysis ➞ | |
 | ROL Rollins, Inc. |
| Sector: Services & Goods | |
| SubSector: Business Services | |
| MarketCap: 12827.4 Millions | |
| Recent Price: 44.30 Smart Investing & Trading Score: 39 | |
| Day Percent Change: 3.34% Day Change: 1.43 | |
| Week Change: 4.21% Year-to-date Change: 1.4% | |
| ROL Links: Profile News Message Board | |
| Charts:- Daily , Weekly | |
| Add ROL to Watchlist: View: Get Complete ROL Trend Analysis ➞ | |
 | COLM Columbia Sportswear Company |
| Sector: Consumer Staples | |
| SubSector: Textile - Apparel Clothing | |
| MarketCap: 4371.75 Millions | |
| Recent Price: 79.71 Smart Investing & Trading Score: 87 | |
| Day Percent Change: -0.09% Day Change: -0.07 | |
| Week Change: 4.13% Year-to-date Change: 0.2% | |
| COLM Links: Profile News Message Board | |
| Charts:- Daily , Weekly | |
| Add COLM to Watchlist: View: Get Complete COLM Trend Analysis ➞ | |
 | DKS DICK S Sporting Goods, Inc. |
| Sector: Services & Goods | |
| SubSector: Sporting Goods Stores | |
| MarketCap: 1672.04 Millions | |
| Recent Price: 203.02 Smart Investing & Trading Score: 61 | |
| Day Percent Change: -1.20% Day Change: -2.46 | |
| Week Change: 4.07% Year-to-date Change: 38.2% | |
| DKS Links: Profile News Message Board | |
| Charts:- Daily , Weekly | |
| Add DKS to Watchlist: View: Get Complete DKS Trend Analysis ➞ | |
 | CNM Core & Main, Inc. |
| Sector: Industrials | |
| SubSector: Industrial Distribution | |
| MarketCap: 7150 Millions | |
| Recent Price: 56.37 Smart Investing & Trading Score: 61 | |
| Day Percent Change: 0.64% Day Change: 0.36 | |
| Week Change: 4.06% Year-to-date Change: 39.1% | |
| CNM Links: Profile News Message Board | |
| Charts:- Daily , Weekly | |
| Add CNM to Watchlist: View: Get Complete CNM Trend Analysis ➞ | |
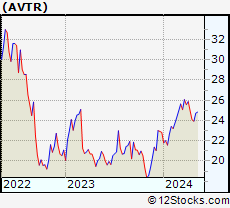 | AVTR Avantor, Inc. |
| Sector: Materials | |
| SubSector: Specialty Chemicals | |
| MarketCap: 6954 Millions | |
| Recent Price: 25.07 Smart Investing & Trading Score: 58 | |
| Day Percent Change: -1.55% Day Change: -0.39 | |
| Week Change: 4% Year-to-date Change: 9.8% | |
| AVTR Links: Profile News Message Board | |
| Charts:- Daily , Weekly | |
| Add AVTR to Watchlist: View: Get Complete AVTR Trend Analysis ➞ | |
 | UDR UDR, Inc. |
| Sector: Financials | |
| SubSector: REIT - Residential | |
| MarketCap: 10180.1 Millions | |
| Recent Price: 37.85 Smart Investing & Trading Score: 100 | |
| Day Percent Change: -0.11% Day Change: -0.04 | |
| Week Change: 3.98% Year-to-date Change: -1.2% | |
| UDR Links: Profile News Message Board | |
| Charts:- Daily , Weekly | |
| Add UDR to Watchlist: View: Get Complete UDR Trend Analysis ➞ | |
 | IPGP IPG Photonics Corporation |
| Sector: Technology | |
| SubSector: Semiconductor Equipment & Materials | |
| MarketCap: 6059.38 Millions | |
| Recent Price: 87.63 Smart Investing & Trading Score: 64 | |
| Day Percent Change: -0.48% Day Change: -0.42 | |
| Week Change: 3.98% Year-to-date Change: -19.3% | |
| IPGP Links: Profile News Message Board | |
| Charts:- Daily , Weekly | |
| Add IPGP to Watchlist: View: Get Complete IPGP Trend Analysis ➞ | |
 | OGN Organon & Co. |
| Sector: Health Care | |
| SubSector: Drug Manufacturers - General | |
| MarketCap: 5230 Millions | |
| Recent Price: 18.53 Smart Investing & Trading Score: 90 | |
| Day Percent Change: 0.98% Day Change: 0.18 | |
| Week Change: 3.98% Year-to-date Change: 29.2% | |
| OGN Links: Profile News Message Board | |
| Charts:- Daily , Weekly | |
| Add OGN to Watchlist: View: Get Complete OGN Trend Analysis ➞ | |
 | CIEN Ciena Corporation |
| Sector: Technology | |
| SubSector: Communication Equipment | |
| MarketCap: 6206.99 Millions | |
| Recent Price: 45.29 Smart Investing & Trading Score: 35 | |
| Day Percent Change: 0.56% Day Change: 0.25 | |
| Week Change: 3.97% Year-to-date Change: 0.6% | |
| CIEN Links: Profile News Message Board | |
| Charts:- Daily , Weekly | |
| Add CIEN to Watchlist: View: Get Complete CIEN Trend Analysis ➞ | |
 | PENN Penn National Gaming, Inc. |
| Sector: Services & Goods | |
| SubSector: Resorts & Casinos | |
| MarketCap: 1183.84 Millions | |
| Recent Price: 17.20 Smart Investing & Trading Score: 74 | |
| Day Percent Change: -3.62% Day Change: -0.64 | |
| Week Change: 3.96% Year-to-date Change: -33.9% | |
| PENN Links: Profile News Message Board | |
| Charts:- Daily , Weekly | |
| Add PENN to Watchlist: View: Get Complete PENN Trend Analysis ➞ | |
 | ENTG Entegris, Inc. |
| Sector: Technology | |
| SubSector: Semiconductor Equipment & Materials | |
| MarketCap: 5890.38 Millions | |
| Recent Price: 127.03 Smart Investing & Trading Score: 58 | |
| Day Percent Change: -0.63% Day Change: -0.81 | |
| Week Change: 3.95% Year-to-date Change: 6.0% | |
| ENTG Links: Profile News Message Board | |
| Charts:- Daily , Weekly | |
| Add ENTG to Watchlist: View: Get Complete ENTG Trend Analysis ➞ | |
 | SOFI SoFi Technologies, Inc. |
| Sector: Financials | |
| SubSector: Credit Services | |
| MarketCap: 7990 Millions | |
| Recent Price: 7.39 Smart Investing & Trading Score: 17 | |
| Day Percent Change: -1.00% Day Change: -0.08 | |
| Week Change: 3.94% Year-to-date Change: -25.0% | |
| SOFI Links: Profile News Message Board | |
| Charts:- Daily , Weekly | |
| Add SOFI to Watchlist: View: Get Complete SOFI Trend Analysis ➞ | |
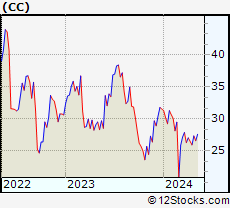 | CC The Chemours Company |
| Sector: Materials | |
| SubSector: Specialty Chemicals | |
| MarketCap: 1718.17 Millions | |
| Recent Price: 26.91 Smart Investing & Trading Score: 60 | |
| Day Percent Change: -0.65% Day Change: -0.17 | |
| Week Change: 3.84% Year-to-date Change: -14.7% | |
| CC Links: Profile News Message Board | |
| Charts:- Daily , Weekly | |
| Add CC to Watchlist: View: Get Complete CC Trend Analysis ➞ | |
 | DVA DaVita Inc. |
| Sector: Health Care | |
| SubSector: Specialized Health Services | |
| MarketCap: 8954.36 Millions | |
| Recent Price: 132.68 Smart Investing & Trading Score: 61 | |
| Day Percent Change: -0.05% Day Change: -0.06 | |
| Week Change: 3.8% Year-to-date Change: 26.7% | |
| DVA Links: Profile News Message Board | |
| Charts:- Daily , Weekly | |
| Add DVA to Watchlist: View: Get Complete DVA Trend Analysis ➞ | |
 | DPZ Domino s Pizza, Inc. |
| Sector: Services & Goods | |
| SubSector: Restaurants | |
| MarketCap: 12166 Millions | |
| Recent Price: 491.52 Smart Investing & Trading Score: 68 | |
| Day Percent Change: 0.78% Day Change: 3.81 | |
| Week Change: 3.8% Year-to-date Change: 19.2% | |
| DPZ Links: Profile News Message Board | |
| Charts:- Daily , Weekly | |
| Add DPZ to Watchlist: View: Get Complete DPZ Trend Analysis ➞ | |
 | THC Tenet Healthcare Corporation |
| Sector: Health Care | |
| SubSector: Hospitals | |
| MarketCap: 1544.46 Millions | |
| Recent Price: 96.72 Smart Investing & Trading Score: 56 | |
| Day Percent Change: -1.56% Day Change: -1.54 | |
| Week Change: 3.79% Year-to-date Change: 28.0% | |
| THC Links: Profile News Message Board | |
| Charts:- Daily , Weekly | |
| Add THC to Watchlist: View: Get Complete THC Trend Analysis ➞ | |
| For tabular summary view of above stock list: Summary View ➞ 0 - 25 , 25 - 50 , 50 - 75 , 75 - 100 , 100 - 125 , 125 - 150 , 150 - 175 , 175 - 200 , 200 - 225 , 225 - 250 , 250 - 275 , 275 - 300 , 300 - 325 , 325 - 350 , 350 - 375 , 375 - 400 , 400 - 425 , 425 - 450 , 450 - 475 , 475 - 500 , 500 - 525 , 525 - 550 , 550 - 575 , 575 - 600 , 600 - 625 , 625 - 650 , 650 - 675 , 675 - 700 , 700 - 725 , 725 - 750 | ||
| Click To Change The Sort Order: By Market Cap or Company Size Performance: Year-to-date, Week and Day | |
| Select Chart Type: | ||
|
Best Stocks Today 12Stocks.com |
© 2024 12Stocks.com Terms & Conditions Privacy Contact Us
All Information Provided Only For Education And Not To Be Used For Investing or Trading. See Terms & Conditions


One More Thing ... Get Best Stocks Delivered Daily!
Never Ever Miss A Move With Our Top Ten Stocks Lists
Find Best Stocks In Any Market - Bull or Bear Market
Take A Peek At Our Top Ten Stocks Lists: Daily, Weekly, Year-to-Date & Top Trends
Find Best Stocks In Any Market - Bull or Bear Market
Take A Peek At Our Top Ten Stocks Lists: Daily, Weekly, Year-to-Date & Top Trends
Midcap Stocks With Best Up Trends [0-bearish to 100-bullish]: HashiCorp [100], Kirby [100], Ardagh Metal[100], Churchill Downs[100], Dover [100], Antero Resources[100], Virtu Financial[100], Allegro Micro[100], EQT [100], Avnet [100], Hess [100]
Best Midcap Stocks Year-to-Date:
Vistra Energy[85.85%], ShockWave Medical[72.5%], AppLovin [69.92%], EMCOR [63.63%], Constellation Energy[60.24%], Spotify [49%], Pure Storage[43.37%], Wingstop [43.31%], Antero Resources[42.68%], Natera [40.96%], Interactive Brokers[40.6%] Best Midcap Stocks This Week:
HashiCorp [37.23%], Hasbro [17.46%], Globe Life[14.66%], Kirby [13.78%], Watsco [12.7%], Ardagh Metal[12.61%], Wabtec [12.29%], Teradyne [12.18%], TransUnion [12%], First Citizens[11.92%], MongoDB [10.68%] Best Midcap Stocks Daily:
HashiCorp [10.94%], TransUnion [8.77%], Kirby [7.88%], Carrier Global[7.19%], First Citizens[6.99%], Teradyne [6.91%], Ardagh Metal[6.65%], Tyler Technologies[6.24%], Churchill Downs[6.18%], CACI [5.50%], Wyndham Hotels[4.53%]