
 Login Sign Up


| |||||
 |  | ||||

| 12Stocks.com Market Intelligence |
Best MidCap Stocks
|
| In a hurry? Mid Cap Stocks Lists: Performance Trends Table, Stock Charts
Sort midcap stocks: Daily, Weekly, Year-to-Date, Market Cap & Trends. Filter midcap stocks list by sector: Show all, Tech, Finance, Energy, Staples, Retail, Industrial, Materials, Utilities and HealthCare Filter midcap stocks list by size:All MidCap Large Mid-Range Small |
| 12Stocks.com Mid Cap Stocks Performances & Trends Daily | |||||||||
|
|  The overall Smart Investing & Trading Score is 63 (0-bearish to 100-bullish) which puts Mid Cap index in short term neutral to bullish trend. The Smart Investing & Trading Score from previous trading session is 44 and an improvement of trend continues.
| ||||||||
Here are the Smart Investing & Trading Scores of the most requested mid cap stocks at 12Stocks.com (click stock name for detailed review):
|


| 12Stocks.com: Top Performing Mid Cap Index Stocks | ||||||||||||||||||||||||||||||||||||||||||||||||
 The top performing Mid Cap Index stocks year to date are
Now, more recently, over last week, the top performing Mid Cap Index stocks on the move are


|
||||||||||||||||||||||||||||||||||||||||||||||||
| 12Stocks.com: Investing in Midcap Index with Stocks | |
|
The following table helps investors and traders sort through current performance and trends (as measured by Smart Investing & Trading Score) of various
stocks in the Midcap Index. Quick View: Move mouse or cursor over stock symbol (ticker) to view short-term technical chart and over stock name to view long term chart. Click on  to add stock symbol to your watchlist and to add stock symbol to your watchlist and  to view watchlist. Click on any ticker or stock name for detailed market intelligence report for that stock. to view watchlist. Click on any ticker or stock name for detailed market intelligence report for that stock. |
12Stocks.com Performance of Stocks in Midcap Index
| Ticker | Stock Name | Watchlist | Category | Recent Price | Smart Investing & Trading Score | Change % | Weekly Change% |
| EWBC | East West |   | Financials | 77.20 | 100 | 2.52% | 5.93% |
| BOKF | BOK Financial | | Financials | 93.05 | 100 | 2.13% | 5.92% |
| AES | AES | | Utilities | 17.37 | 85 | 1.40% | 5.91% |
| RCL | Royal Caribbean | | Services & Goods | 136.73 | 88 | 0.04% | 5.82% |
| DDOG | Datadog | | Technology | 127.07 | 66 | 0.50% | 5.80% |
| TOL | Toll Brothers | | Industrials | 118.70 | 70 | -0.69% | 5.78% |
| TDOC | Teladoc Health | | Technology | 13.73 | 47 | -0.07% | 5.78% |
| JEF | Jefferies Financial | | Financials | 44.60 | 68 | 0.02% | 5.76% |
| FHB | First Hawaiian | | Financials | 22.21 | 100 | 1.14% | 5.76% |
| BRKR | Bruker | | Health Care | 82.20 | 63 | -0.32% | 5.71% |
| PVH | PVH | | Consumer Staples | 112.87 | 64 | 0.20% | 5.70% |
| ZION | Zions Ban | | Financials | 42.17 | 80 | 1.01% | 5.64% |
| AVTR | Avantor | | Materials | 25.46 | 65 | -0.74% | 5.64% |
| FIVN | Five9 | | Technology | 60.28 | 57 | 0.23% | 5.59% |
| IQV | IQVIA | | Health Care | 240.84 | 60 | 0.93% | 5.59% |
| AMBP | Ardagh Metal | | Services & Goods | 3.69 | 74 | -0.67% | 5.59% |
| CRL | Charles River | | Health Care | 239.43 | 70 | -0.29% | 5.58% |
| APH | Amphenol | | Technology | 116.31 | 80 | 1.79% | 5.57% |
| FICO | Fair Isaac | | Technology | 1193.03 | 62 | 0.41% | 5.57% |
| AVT | Avnet | | Services & Goods | 49.24 | 100 | 1.59% | 5.53% |
| DXCM | DexCom | | Health Care | 137.87 | 80 | 2.89% | 5.48% |
| SNV | Synovus Financial | | Financials | 36.82 | 42 | 0.52% | 5.47% |
| KEX | Kirby | | Transports | 101.05 | 100 | -0.87% | 5.47% |
| BLDR | Builders FirstSource | | Industrials | 186.69 | 65 | -0.29% | 5.46% |
| GWRE | Guidewire Software | | Technology | 113.51 | 75 | -0.24% | 5.45% |
| For chart view version of above stock list: Chart View ➞ 0 - 25 , 25 - 50 , 50 - 75 , 75 - 100 , 100 - 125 , 125 - 150 , 150 - 175 , 175 - 200 , 200 - 225 , 225 - 250 , 250 - 275 , 275 - 300 , 300 - 325 , 325 - 350 , 350 - 375 , 375 - 400 , 400 - 425 , 425 - 450 , 450 - 475 , 475 - 500 , 500 - 525 , 525 - 550 , 550 - 575 , 575 - 600 , 600 - 625 , 625 - 650 , 650 - 675 , 675 - 700 , 700 - 725 , 725 - 750 , 750 - 775 | ||
 | Click To Change The Sort Order: By Market Cap or Company Size Performance: Year-to-date, Week and Day |  |
|
Get the most comprehensive stock market coverage daily at 12Stocks.com ➞ Best Stocks Today ➞ Best Stocks Weekly ➞ Best Stocks Year-to-Date ➞ Best Stocks Trends ➞  Best Stocks Today 12Stocks.com Best Nasdaq Stocks ➞ Best S&P 500 Stocks ➞ Best Tech Stocks ➞ Best Biotech Stocks ➞ |
| Detailed Overview of Midcap Stocks |
| Midcap Technical Overview, Leaders & Laggards, Top Midcap ETF Funds & Detailed Midcap Stocks List, Charts, Trends & More |
| Midcap: Technical Analysis, Trends & YTD Performance | |
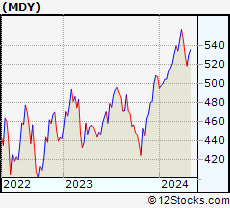
| MidCap segment as represented by
MDY, an exchange-traded fund [ETF], holds basket of about four hundred midcap stocks from across all major sectors of the US stock market. The midcap index (contains stocks like Green Mountain Coffee Roasters and Tractor Supply Company) is up by 4.42% and is currently underperforming the overall market by -1.24% year-to-date. Below is a quick view of technical charts and trends: | |
 MDY Weekly Chart |
|
| Long Term Trend: Very Good | |
| Medium Term Trend: Not Good | |
 MDY Daily Chart |
|
| Short Term Trend: Very Good | |
| Overall Trend Score: 63 | |
| YTD Performance: 4.42% | |
| **Trend Scores & Views Are Only For Educational Purposes And Not For Investing | |
| 12Stocks.com: Investing in Midcap Index using Exchange Traded Funds | |
|
The following table shows list of key exchange traded funds (ETF) that
help investors track Midcap index. The following list also includes leveraged ETF funds that track twice or thrice the daily returns of Midcap indices. Short or inverse ETF funds move in the opposite direction to the index they track and are useful during market pullbacks or during bear markets. Quick View: Move mouse or cursor over ETF symbol (ticker) to view short-term technical chart and over ETF name to view long term chart. Click on ticker or stock name for detailed view. Click on to add stock symbol to your watchlist and to view watchlist. |
12Stocks.com List of ETFs that track Midcap Index
| Ticker | ETF Name | Watchlist | Recent Price | Smart Investing & Trading Score | Change % | Week % | Year-to-date % |
| IJH | iShares Core S&P Mid-Cap | | 57.87 | 68 | 0.03 | 2.28 | 4.4% |
| IWR | iShares Russell Mid-Cap | | 80.41 | 63 | 0.05 | 2.22 | 3.45% |
| IWP | iShares Russell Mid-Cap Growth | | 108.49 | 58 | -0.13 | 2.64 | 3.86% |
| MDY | SPDR S&P MidCap 400 ETF | | 529.80 | 63 | 0.00 | 2.22 | 4.42% |
| IJK | iShares S&P Mid-Cap 400 Growth | | 86.99 | 63 | 0.07 | 2.52 | 9.81% |
| IWS | iShares Russell Mid-Cap Value | | 119.97 | 68 | 0.09 | 1.97 | 3.16% |
| IJJ | iShares S&P Mid-Cap 400 Value | | 112.59 | 51 | 0.11 | 1.85 | -1.27% |
| XMLV | PowerShares S&P MidCap Low Volatil ETF | | 55.04 | 75 | 0.24 | 1.62 | 3.5% |
| MVV | ProShares Ultra MidCap400 | | 61.60 | 41 | 0.10 | 4.41 | 6.41% |
| UMDD | ProShares UltraPro MidCap400 | | 24.09 | 63 | -0.08 | 6.77 | 7.93% |
| SMDD | ProShares UltraPro Short MidCap400 | | 11.84 | 32 | 1.58 | -5.79 | -12.1% |
| MYY | ProShares Short MidCap400 | | 20.74 | 32 | 0.00 | -2.12 | -3.33% |
| MZZ | ProShares UltraShort MidCap400 | | 11.69 | 34 | 0.26 | -3.95 | -7.01% |
| 12Stocks.com: Charts, Trends, Fundamental Data and Performances of MidCap Stocks | |
|
We now take in-depth look at all MidCap stocks including charts, multi-period performances and overall trends (as measured by Smart Investing & Trading Score). One can sort MidCap stocks (click link to choose) by Daily, Weekly and by Year-to-Date performances. Also, one can sort by size of the company or by market capitalization. |
| Select Your Default Chart Type: | |||||
| |||||
| Click on stock symbol or name for detailed view. Click on to add stock symbol to your watchlist and to view watchlist. Quick View: Move mouse or cursor over "Daily" to quickly view daily technical stock chart and over "Weekly" to view weekly technical stock chart. | |||||

 | EWBC East West Bancorp, Inc. |
| Sector: Financials | |
| SubSector: Foreign Money Center Banks | |
| MarketCap: 4618.31 Millions | |
| Recent Price: 77.20 Smart Investing & Trading Score: 100 | |
| Day Percent Change: 2.52% Day Change: 1.90 | |
| Week Change: 5.93% Year-to-date Change: 7.3% | |
| EWBC Links: Profile News Message Board | |
| Charts:- Daily , Weekly | |
| Add EWBC to Watchlist: View: Get Complete EWBC Trend Analysis ➞ | |
 | BOKF BOK Financial Corporation |
| Sector: Financials | |
| SubSector: Regional - Southwest Banks | |
| MarketCap: 2945.35 Millions | |
| Recent Price: 93.05 Smart Investing & Trading Score: 100 | |
| Day Percent Change: 2.13% Day Change: 1.94 | |
| Week Change: 5.92% Year-to-date Change: 8.6% | |
| BOKF Links: Profile News Message Board | |
| Charts:- Daily , Weekly | |
| Add BOKF to Watchlist: View: Get Complete BOKF Trend Analysis ➞ | |
 | AES The AES Corporation |
| Sector: Utilities | |
| SubSector: Electric Utilities | |
| MarketCap: 9173.44 Millions | |
| Recent Price: 17.37 Smart Investing & Trading Score: 85 | |
| Day Percent Change: 1.40% Day Change: 0.24 | |
| Week Change: 5.91% Year-to-date Change: -9.8% | |
| AES Links: Profile News Message Board | |
| Charts:- Daily , Weekly | |
| Add AES to Watchlist: View: Get Complete AES Trend Analysis ➞ | |
 | RCL Royal Caribbean Cruises Ltd. |
| Sector: Services & Goods | |
| SubSector: Resorts & Casinos | |
| MarketCap: 7294.14 Millions | |
| Recent Price: 136.73 Smart Investing & Trading Score: 88 | |
| Day Percent Change: 0.04% Day Change: 0.06 | |
| Week Change: 5.82% Year-to-date Change: 5.6% | |
| RCL Links: Profile News Message Board | |
| Charts:- Daily , Weekly | |
| Add RCL to Watchlist: View: Get Complete RCL Trend Analysis ➞ | |
 | DDOG Datadog, Inc. |
| Sector: Technology | |
| SubSector: Application Software | |
| MarketCap: 10653.2 Millions | |
| Recent Price: 127.07 Smart Investing & Trading Score: 66 | |
| Day Percent Change: 0.50% Day Change: 0.63 | |
| Week Change: 5.8% Year-to-date Change: 4.7% | |
| DDOG Links: Profile News Message Board | |
| Charts:- Daily , Weekly | |
| Add DDOG to Watchlist: View: Get Complete DDOG Trend Analysis ➞ | |
 | TOL Toll Brothers, Inc. |
| Sector: Industrials | |
| SubSector: Residential Construction | |
| MarketCap: 2278.26 Millions | |
| Recent Price: 118.70 Smart Investing & Trading Score: 70 | |
| Day Percent Change: -0.69% Day Change: -0.82 | |
| Week Change: 5.78% Year-to-date Change: 15.5% | |
| TOL Links: Profile News Message Board | |
| Charts:- Daily , Weekly | |
| Add TOL to Watchlist: View: Get Complete TOL Trend Analysis ➞ | |
 | TDOC Teladoc Health, Inc. |
| Sector: Technology | |
| SubSector: Healthcare Information Services | |
| MarketCap: 11968.5 Millions | |
| Recent Price: 13.73 Smart Investing & Trading Score: 47 | |
| Day Percent Change: -0.07% Day Change: -0.01 | |
| Week Change: 5.78% Year-to-date Change: -36.3% | |
| TDOC Links: Profile News Message Board | |
| Charts:- Daily , Weekly | |
| Add TDOC to Watchlist: View: Get Complete TDOC Trend Analysis ➞ | |
 | JEF Jefferies Financial Group Inc. |
| Sector: Financials | |
| SubSector: Investment Brokerage - Regional | |
| MarketCap: 3987.15 Millions | |
| Recent Price: 44.60 Smart Investing & Trading Score: 68 | |
| Day Percent Change: 0.02% Day Change: 0.01 | |
| Week Change: 5.76% Year-to-date Change: 10.4% | |
| JEF Links: Profile News Message Board | |
| Charts:- Daily , Weekly | |
| Add JEF to Watchlist: View: Get Complete JEF Trend Analysis ➞ | |
 | FHB First Hawaiian, Inc. |
| Sector: Financials | |
| SubSector: Regional - Pacific Banks | |
| MarketCap: 2398.99 Millions | |
| Recent Price: 22.21 Smart Investing & Trading Score: 100 | |
| Day Percent Change: 1.14% Day Change: 0.25 | |
| Week Change: 5.76% Year-to-date Change: -2.8% | |
| FHB Links: Profile News Message Board | |
| Charts:- Daily , Weekly | |
| Add FHB to Watchlist: View: Get Complete FHB Trend Analysis ➞ | |
 | BRKR Bruker Corporation |
| Sector: Health Care | |
| SubSector: Medical Laboratories & Research | |
| MarketCap: 5932 Millions | |
| Recent Price: 82.20 Smart Investing & Trading Score: 63 | |
| Day Percent Change: -0.32% Day Change: -0.26 | |
| Week Change: 5.71% Year-to-date Change: 11.9% | |
| BRKR Links: Profile News Message Board | |
| Charts:- Daily , Weekly | |
| Add BRKR to Watchlist: View: Get Complete BRKR Trend Analysis ➞ | |
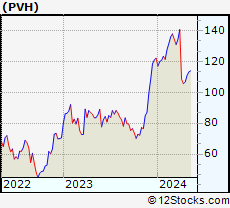 | PVH PVH Corp. |
| Sector: Consumer Staples | |
| SubSector: Textile - Apparel Clothing | |
| MarketCap: 2947.65 Millions | |
| Recent Price: 112.87 Smart Investing & Trading Score: 64 | |
| Day Percent Change: 0.20% Day Change: 0.23 | |
| Week Change: 5.7% Year-to-date Change: -7.6% | |
| PVH Links: Profile News Message Board | |
| Charts:- Daily , Weekly | |
| Add PVH to Watchlist: View: Get Complete PVH Trend Analysis ➞ | |
 | ZION Zions Bancorporation, National Association |
| Sector: Financials | |
| SubSector: Regional - Pacific Banks | |
| MarketCap: 4577.89 Millions | |
| Recent Price: 42.17 Smart Investing & Trading Score: 80 | |
| Day Percent Change: 1.01% Day Change: 0.42 | |
| Week Change: 5.64% Year-to-date Change: -3.9% | |
| ZION Links: Profile News Message Board | |
| Charts:- Daily , Weekly | |
| Add ZION to Watchlist: View: Get Complete ZION Trend Analysis ➞ | |
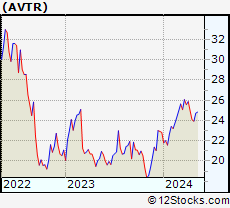 | AVTR Avantor, Inc. |
| Sector: Materials | |
| SubSector: Specialty Chemicals | |
| MarketCap: 6954 Millions | |
| Recent Price: 25.46 Smart Investing & Trading Score: 65 | |
| Day Percent Change: -0.74% Day Change: -0.19 | |
| Week Change: 5.64% Year-to-date Change: 11.5% | |
| AVTR Links: Profile News Message Board | |
| Charts:- Daily , Weekly | |
| Add AVTR to Watchlist: View: Get Complete AVTR Trend Analysis ➞ | |
 | FIVN Five9, Inc. |
| Sector: Technology | |
| SubSector: Application Software | |
| MarketCap: 4253.62 Millions | |
| Recent Price: 60.28 Smart Investing & Trading Score: 57 | |
| Day Percent Change: 0.23% Day Change: 0.14 | |
| Week Change: 5.59% Year-to-date Change: -23.4% | |
| FIVN Links: Profile News Message Board | |
| Charts:- Daily , Weekly | |
| Add FIVN to Watchlist: View: Get Complete FIVN Trend Analysis ➞ | |
 | IQV IQVIA Holdings Inc. |
| Sector: Health Care | |
| SubSector: Medical Laboratories & Research | |
| MarketCap: 19616.5 Millions | |
| Recent Price: 240.84 Smart Investing & Trading Score: 60 | |
| Day Percent Change: 0.93% Day Change: 2.22 | |
| Week Change: 5.59% Year-to-date Change: 4.1% | |
| IQV Links: Profile News Message Board | |
| Charts:- Daily , Weekly | |
| Add IQV to Watchlist: View: Get Complete IQV Trend Analysis ➞ | |
 | AMBP Ardagh Metal Packaging S.A. |
| Sector: Services & Goods | |
| SubSector: Packaging & Containers | |
| MarketCap: 2170 Millions | |
| Recent Price: 3.69 Smart Investing & Trading Score: 74 | |
| Day Percent Change: -0.67% Day Change: -0.02 | |
| Week Change: 5.59% Year-to-date Change: -3.7% | |
| AMBP Links: Profile News Message Board | |
| Charts:- Daily , Weekly | |
| Add AMBP to Watchlist: View: Get Complete AMBP Trend Analysis ➞ | |
 | CRL Charles River Laboratories International, Inc. |
| Sector: Health Care | |
| SubSector: Medical Laboratories & Research | |
| MarketCap: 5700.5 Millions | |
| Recent Price: 239.43 Smart Investing & Trading Score: 70 | |
| Day Percent Change: -0.29% Day Change: -0.70 | |
| Week Change: 5.58% Year-to-date Change: 1.3% | |
| CRL Links: Profile News Message Board | |
| Charts:- Daily , Weekly | |
| Add CRL to Watchlist: View: Get Complete CRL Trend Analysis ➞ | |
 | APH Amphenol Corporation |
| Sector: Technology | |
| SubSector: Diversified Electronics | |
| MarketCap: 23422 Millions | |
| Recent Price: 116.31 Smart Investing & Trading Score: 80 | |
| Day Percent Change: 1.79% Day Change: 2.05 | |
| Week Change: 5.57% Year-to-date Change: 17.3% | |
| APH Links: Profile News Message Board | |
| Charts:- Daily , Weekly | |
| Add APH to Watchlist: View: Get Complete APH Trend Analysis ➞ | |
 | FICO Fair Isaac Corporation |
| Sector: Technology | |
| SubSector: Business Software & Services | |
| MarketCap: 7930.98 Millions | |
| Recent Price: 1193.03 Smart Investing & Trading Score: 62 | |
| Day Percent Change: 0.41% Day Change: 4.84 | |
| Week Change: 5.57% Year-to-date Change: 2.5% | |
| FICO Links: Profile News Message Board | |
| Charts:- Daily , Weekly | |
| Add FICO to Watchlist: View: Get Complete FICO Trend Analysis ➞ | |
 | AVT Avnet, Inc. |
| Sector: Services & Goods | |
| SubSector: Electronics Wholesale | |
| MarketCap: 2776.33 Millions | |
| Recent Price: 49.24 Smart Investing & Trading Score: 100 | |
| Day Percent Change: 1.59% Day Change: 0.77 | |
| Week Change: 5.53% Year-to-date Change: -2.3% | |
| AVT Links: Profile News Message Board | |
| Charts:- Daily , Weekly | |
| Add AVT to Watchlist: View: Get Complete AVT Trend Analysis ➞ | |
 | DXCM DexCom, Inc. |
| Sector: Health Care | |
| SubSector: Medical Laboratories & Research | |
| MarketCap: 19559 Millions | |
| Recent Price: 137.87 Smart Investing & Trading Score: 80 | |
| Day Percent Change: 2.89% Day Change: 3.87 | |
| Week Change: 5.48% Year-to-date Change: 11.1% | |
| DXCM Links: Profile News Message Board | |
| Charts:- Daily , Weekly | |
| Add DXCM to Watchlist: View: Get Complete DXCM Trend Analysis ➞ | |
 | SNV Synovus Financial Corp. |
| Sector: Financials | |
| SubSector: Regional - Mid-Atlantic Banks | |
| MarketCap: 2697.29 Millions | |
| Recent Price: 36.82 Smart Investing & Trading Score: 42 | |
| Day Percent Change: 0.52% Day Change: 0.19 | |
| Week Change: 5.47% Year-to-date Change: -2.2% | |
| SNV Links: Profile News Message Board | |
| Charts:- Daily , Weekly | |
| Add SNV to Watchlist: View: Get Complete SNV Trend Analysis ➞ | |
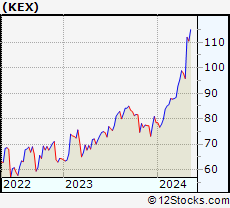 | KEX Kirby Corporation |
| Sector: Transports | |
| SubSector: Shipping | |
| MarketCap: 2533.34 Millions | |
| Recent Price: 101.05 Smart Investing & Trading Score: 100 | |
| Day Percent Change: -0.87% Day Change: -0.89 | |
| Week Change: 5.47% Year-to-date Change: 28.8% | |
| KEX Links: Profile News Message Board | |
| Charts:- Daily , Weekly | |
| Add KEX to Watchlist: View: Get Complete KEX Trend Analysis ➞ | |
 | BLDR Builders FirstSource, Inc. |
| Sector: Industrials | |
| SubSector: General Building Materials | |
| MarketCap: 1714.63 Millions | |
| Recent Price: 186.69 Smart Investing & Trading Score: 65 | |
| Day Percent Change: -0.29% Day Change: -0.55 | |
| Week Change: 5.46% Year-to-date Change: 11.8% | |
| BLDR Links: Profile News Message Board | |
| Charts:- Daily , Weekly | |
| Add BLDR to Watchlist: View: Get Complete BLDR Trend Analysis ➞ | |
 | GWRE Guidewire Software, Inc. |
| Sector: Technology | |
| SubSector: Business Software & Services | |
| MarketCap: 7073.18 Millions | |
| Recent Price: 113.51 Smart Investing & Trading Score: 75 | |
| Day Percent Change: -0.24% Day Change: -0.27 | |
| Week Change: 5.45% Year-to-date Change: 4.1% | |
| GWRE Links: Profile News Message Board | |
| Charts:- Daily , Weekly | |
| Add GWRE to Watchlist: View: Get Complete GWRE Trend Analysis ➞ | |
| For tabular summary view of above stock list: Summary View ➞ 0 - 25 , 25 - 50 , 50 - 75 , 75 - 100 , 100 - 125 , 125 - 150 , 150 - 175 , 175 - 200 , 200 - 225 , 225 - 250 , 250 - 275 , 275 - 300 , 300 - 325 , 325 - 350 , 350 - 375 , 375 - 400 , 400 - 425 , 425 - 450 , 450 - 475 , 475 - 500 , 500 - 525 , 525 - 550 , 550 - 575 , 575 - 600 , 600 - 625 , 625 - 650 , 650 - 675 , 675 - 700 , 700 - 725 , 725 - 750 , 750 - 775 | ||
| Click To Change The Sort Order: By Market Cap or Company Size Performance: Year-to-date, Week and Day | |
| Select Chart Type: | ||
|
Best Stocks Today 12Stocks.com |
© 2024 12Stocks.com Terms & Conditions Privacy Contact Us
All Information Provided Only For Education And Not To Be Used For Investing or Trading. See Terms & Conditions


One More Thing ... Get Best Stocks Delivered Daily!
Never Ever Miss A Move With Our Top Ten Stocks Lists
Find Best Stocks In Any Market - Bull or Bear Market
Take A Peek At Our Top Ten Stocks Lists: Daily, Weekly, Year-to-Date & Top Trends
Find Best Stocks In Any Market - Bull or Bear Market
Take A Peek At Our Top Ten Stocks Lists: Daily, Weekly, Year-to-Date & Top Trends
Midcap Stocks With Best Up Trends [0-bearish to 100-bullish]: Hasbro [100], Wabtec [100], Allegro Micro[100], Microchip [100], Synchrony Financial[100], EQT [100], Prosperity Bancshares[100], Range Resources[100], Virtu Financial[100], Crane Co[100], National Fuel[100]
Best Midcap Stocks Year-to-Date:
Vistra Energy[82.92%], AppLovin [74.52%], ShockWave Medical[72.58%], Constellation Energy[59.4%], EMCOR [57.31%], Spotify [49.66%], Natera [46.07%], Pure Storage[42.04%], Williams-Sonoma [41.5%], Wingstop [41.38%], NRG Energy[40.44%] Best Midcap Stocks This Week:
HashiCorp [23.7%], Globe Life[17.77%], Hasbro [17.66%], Tandem Diabetes[15.41%], Wabtec [13.32%], MongoDB [12.82%], Ryder System[12.4%], Microchip [11.02%], Watsco [11%], Crane Co[9.77%], Coinbase Global[9.74%] Best Midcap Stocks Daily:
Hasbro [11.85%], Wabtec [10.04%], CoStar [8.66%], Allegro Micro[8.24%], GameStop [7.58%], Watsco [6.54%], ON Semiconductor[6.24%], Hertz Global[6.23%], Sarepta [6.09%], Lattice Semiconductor[5.31%], Microchip [5.21%]