
 Login Sign Up


| |||||
 |  | ||||

| 12Stocks.com Market Intelligence |
Best MidCap Stocks
|
| In a hurry? Mid Cap Stocks Lists: Performance Trends Table, Stock Charts
Sort midcap stocks: Daily, Weekly, Year-to-Date, Market Cap & Trends. Filter midcap stocks list by sector: Show all, Tech, Finance, Energy, Staples, Retail, Industrial, Materials, Utilities and HealthCare Filter midcap stocks list by size:All MidCap Large Mid-Range Small |
| 12Stocks.com Mid Cap Stocks Performances & Trends Daily | |||||||||
|
|  The overall Smart Investing & Trading Score is 49 (0-bearish to 100-bullish) which puts Mid Cap index in short term neutral trend. The Smart Investing & Trading Score from previous trading session is 63 and hence a deterioration of trend.
| ||||||||
Here are the Smart Investing & Trading Scores of the most requested mid cap stocks at 12Stocks.com (click stock name for detailed review):
|


| 12Stocks.com: Top Performing Mid Cap Index Stocks | ||||||||||||||||||||||||||||||||||||||||||||||||
 The top performing Mid Cap Index stocks year to date are
Now, more recently, over last week, the top performing Mid Cap Index stocks on the move are


|
||||||||||||||||||||||||||||||||||||||||||||||||
| 12Stocks.com: Investing in Midcap Index with Stocks | |
|
The following table helps investors and traders sort through current performance and trends (as measured by Smart Investing & Trading Score) of various
stocks in the Midcap Index. Quick View: Move mouse or cursor over stock symbol (ticker) to view short-term technical chart and over stock name to view long term chart. Click on  to add stock symbol to your watchlist and to add stock symbol to your watchlist and  to view watchlist. Click on any ticker or stock name for detailed market intelligence report for that stock. to view watchlist. Click on any ticker or stock name for detailed market intelligence report for that stock. |
12Stocks.com Performance of Stocks in Midcap Index
| Ticker | Stock Name | Watchlist | Category | Recent Price | Smart Investing & Trading Score | Change % | Weekly Change% |
| RF | Regions Financial |   | Financials | 19.50 | 75 | -1.39% | 3.15% |
| SCI | Service | | Services & Goods | 70.96 | 75 | -0.76% | 3.15% |
| EHC | Encompass Health | | Health Care | 81.70 | 65 | -1.32% | 3.14% |
| SLM | SLM | | Financials | 21.75 | 100 | -1.61% | 3.11% |
| TSCO | Tractor Supply | | Services & Goods | 260.57 | 76 | 0.95% | 3.08% |
| ADT | ADT | | Services & Goods | 6.38 | 49 | 0.00% | 3.07% |
| DBX | Dropbox | | Technology | 23.70 | 44 | -1.35% | 3.07% |
| PYCR | Paycor HCM | | Technology | 17.49 | 35 | 1.10% | 3.06% |
| TTEK | Tetra Tech | | Services & Goods | 190.31 | 68 | 0.54% | 3.05% |
| LPX | Louisiana-Pacific | | Services & Goods | 74.30 | 63 | -1.18% | 3.04% |
| PWR | Quanta Services | | Industrials | 250.62 | 56 | -1.01% | 3.03% |
| CLX | Clorox | | Consumer Staples | 147.90 | 95 | 0.08% | 3.03% |
| KBR | KBR | | Services & Goods | 64.56 | 75 | 0.28% | 3.02% |
| BOKF | BOK Financial | | Financials | 90.49 | 100 | -2.75% | 3.01% |
| SNX | SYNNEX | | Technology | 116.71 | 93 | -0.46% | 2.99% |
| CHK | Chesapeake Energy | | Energy | 90.11 | 90 | -0.63% | 2.98% |
| ALGN | Align | | Health Care | 307.88 | 68 | -1.88% | 2.98% |
| WAT | Waters | | Health Care | 304.88 | 25 | -1.73% | 2.97% |
| HEI | HEICO | | Industrials | 202.96 | 93 | -0.87% | 2.97% |
| SHC | Sotera Health | | Health Care | 11.11 | 37 | -1.33% | 2.97% |
| JLL | Jones Lang | | Financials | 180.30 | 63 | -0.86% | 2.96% |
| OMF | OneMain | | Financials | 50.14 | 93 | -2.28% | 2.96% |
| AVB | AvalonBay Communities | | Financials | 189.54 | 100 | -0.94% | 2.94% |
| MPW | Medical Properties | | Financials | 4.55 | 71 | -0.44% | 2.94% |
| CPRT | Copart | | Services & Goods | 54.42 | 58 | -0.93% | 2.91% |
| For chart view version of above stock list: Chart View ➞ 0 - 25 , 25 - 50 , 50 - 75 , 75 - 100 , 100 - 125 , 125 - 150 , 150 - 175 , 175 - 200 , 200 - 225 , 225 - 250 , 250 - 275 , 275 - 300 , 300 - 325 , 325 - 350 , 350 - 375 , 375 - 400 , 400 - 425 , 425 - 450 , 450 - 475 , 475 - 500 , 500 - 525 , 525 - 550 , 550 - 575 , 575 - 600 , 600 - 625 , 625 - 650 , 650 - 675 , 675 - 700 , 700 - 725 , 725 - 750 | ||
 | Click To Change The Sort Order: By Market Cap or Company Size Performance: Year-to-date, Week and Day |  |
|
Get the most comprehensive stock market coverage daily at 12Stocks.com ➞ Best Stocks Today ➞ Best Stocks Weekly ➞ Best Stocks Year-to-Date ➞ Best Stocks Trends ➞  Best Stocks Today 12Stocks.com Best Nasdaq Stocks ➞ Best S&P 500 Stocks ➞ Best Tech Stocks ➞ Best Biotech Stocks ➞ |
| Detailed Overview of Midcap Stocks |
| Midcap Technical Overview, Leaders & Laggards, Top Midcap ETF Funds & Detailed Midcap Stocks List, Charts, Trends & More |
| Midcap: Technical Analysis, Trends & YTD Performance | |
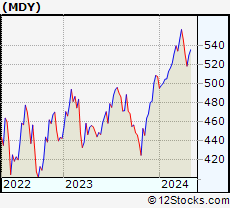
| MidCap segment as represented by
MDY, an exchange-traded fund [ETF], holds basket of about four hundred midcap stocks from across all major sectors of the US stock market. The midcap index (contains stocks like Green Mountain Coffee Roasters and Tractor Supply Company) is up by 3.34% and is currently underperforming the overall market by -0.91% year-to-date. Below is a quick view of technical charts and trends: | |
 MDY Weekly Chart |
|
| Long Term Trend: Good | |
| Medium Term Trend: Not Good | |
 MDY Daily Chart |
|
| Short Term Trend: Deteriorating | |
| Overall Trend Score: 49 | |
| YTD Performance: 3.34% | |
| **Trend Scores & Views Are Only For Educational Purposes And Not For Investing | |
| 12Stocks.com: Investing in Midcap Index using Exchange Traded Funds | |
|
The following table shows list of key exchange traded funds (ETF) that
help investors track Midcap index. The following list also includes leveraged ETF funds that track twice or thrice the daily returns of Midcap indices. Short or inverse ETF funds move in the opposite direction to the index they track and are useful during market pullbacks or during bear markets. Quick View: Move mouse or cursor over ETF symbol (ticker) to view short-term technical chart and over ETF name to view long term chart. Click on ticker or stock name for detailed view. Click on to add stock symbol to your watchlist and to view watchlist. |
12Stocks.com List of ETFs that track Midcap Index
| Ticker | ETF Name | Watchlist | Recent Price | Smart Investing & Trading Score | Change % | Week % | Year-to-date % |
| MDY | SPDR S&P MidCap 400 ETF | | 524.32 | 49 | -1.04 | 1.16 | 3.34% |
| UMDD | ProShares UltraPro MidCap400 | | 23.29 | 56 | -3.33 | 3.22 | 4.34% |
| SMDD | ProShares UltraPro Short MidCap400 | | 12.12 | 54 | 2.41 | -3.52 | -9.98% |
| MZZ | ProShares UltraShort MidCap400 | | 11.93 | 34 | 2.01 | -2.02 | -5.14% |
| MYY | ProShares Short MidCap400 | | 20.74 | 32 | 0.00 | -2.12 | -3.33% |
| 12Stocks.com: Charts, Trends, Fundamental Data and Performances of MidCap Stocks | |
|
We now take in-depth look at all MidCap stocks including charts, multi-period performances and overall trends (as measured by Smart Investing & Trading Score). One can sort MidCap stocks (click link to choose) by Daily, Weekly and by Year-to-Date performances. Also, one can sort by size of the company or by market capitalization. |
| Select Your Default Chart Type: | |||||
| |||||
| Click on stock symbol or name for detailed view. Click on to add stock symbol to your watchlist and to view watchlist. Quick View: Move mouse or cursor over "Daily" to quickly view daily technical stock chart and over "Weekly" to view weekly technical stock chart. | |||||

 | RF Regions Financial Corporation |
| Sector: Financials | |
| SubSector: Regional - Southeast Banks | |
| MarketCap: 8936.25 Millions | |
| Recent Price: 19.50 Smart Investing & Trading Score: 75 | |
| Day Percent Change: -1.39% Day Change: -0.27 | |
| Week Change: 3.15% Year-to-date Change: 0.6% | |
| RF Links: Profile News Message Board | |
| Charts:- Daily , Weekly | |
| Add RF to Watchlist: View: Get Complete RF Trend Analysis ➞ | |
 | SCI Service Corporation International |
| Sector: Services & Goods | |
| SubSector: Personal Services | |
| MarketCap: 7216.05 Millions | |
| Recent Price: 70.96 Smart Investing & Trading Score: 75 | |
| Day Percent Change: -0.76% Day Change: -0.54 | |
| Week Change: 3.15% Year-to-date Change: 3.7% | |
| SCI Links: Profile News Message Board | |
| Charts:- Daily , Weekly | |
| Add SCI to Watchlist: View: Get Complete SCI Trend Analysis ➞ | |
 | EHC Encompass Health Corporation |
| Sector: Health Care | |
| SubSector: Hospitals | |
| MarketCap: 5384.06 Millions | |
| Recent Price: 81.70 Smart Investing & Trading Score: 65 | |
| Day Percent Change: -1.32% Day Change: -1.09 | |
| Week Change: 3.14% Year-to-date Change: 22.5% | |
| EHC Links: Profile News Message Board | |
| Charts:- Daily , Weekly | |
| Add EHC to Watchlist: View: Get Complete EHC Trend Analysis ➞ | |
 | SLM SLM Corporation |
| Sector: Financials | |
| SubSector: Credit Services | |
| MarketCap: 3099.78 Millions | |
| Recent Price: 21.75 Smart Investing & Trading Score: 100 | |
| Day Percent Change: -1.61% Day Change: -0.36 | |
| Week Change: 3.11% Year-to-date Change: 13.7% | |
| SLM Links: Profile News Message Board | |
| Charts:- Daily , Weekly | |
| Add SLM to Watchlist: View: Get Complete SLM Trend Analysis ➞ | |
 | TSCO Tractor Supply Company |
| Sector: Services & Goods | |
| SubSector: Specialty Retail, Other | |
| MarketCap: 9692.94 Millions | |
| Recent Price: 260.57 Smart Investing & Trading Score: 76 | |
| Day Percent Change: 0.95% Day Change: 2.44 | |
| Week Change: 3.08% Year-to-date Change: 21.2% | |
| TSCO Links: Profile News Message Board | |
| Charts:- Daily , Weekly | |
| Add TSCO to Watchlist: View: Get Complete TSCO Trend Analysis ➞ | |
 | ADT ADT Inc. |
| Sector: Services & Goods | |
| SubSector: Security & Protection Services | |
| MarketCap: 2892.03 Millions | |
| Recent Price: 6.38 Smart Investing & Trading Score: 49 | |
| Day Percent Change: 0.00% Day Change: 0.00 | |
| Week Change: 3.07% Year-to-date Change: -6.5% | |
| ADT Links: Profile News Message Board | |
| Charts:- Daily , Weekly | |
| Add ADT to Watchlist: View: Get Complete ADT Trend Analysis ➞ | |
 | DBX Dropbox, Inc. |
| Sector: Technology | |
| SubSector: Application Software | |
| MarketCap: 7588.32 Millions | |
| Recent Price: 23.70 Smart Investing & Trading Score: 44 | |
| Day Percent Change: -1.35% Day Change: -0.32 | |
| Week Change: 3.07% Year-to-date Change: -19.6% | |
| DBX Links: Profile News Message Board | |
| Charts:- Daily , Weekly | |
| Add DBX to Watchlist: View: Get Complete DBX Trend Analysis ➞ | |
 | PYCR Paycor HCM, Inc. |
| Sector: Technology | |
| SubSector: Software - Application | |
| MarketCap: 4220 Millions | |
| Recent Price: 17.49 Smart Investing & Trading Score: 35 | |
| Day Percent Change: 1.10% Day Change: 0.19 | |
| Week Change: 3.06% Year-to-date Change: -19.3% | |
| PYCR Links: Profile News Message Board | |
| Charts:- Daily , Weekly | |
| Add PYCR to Watchlist: View: Get Complete PYCR Trend Analysis ➞ | |
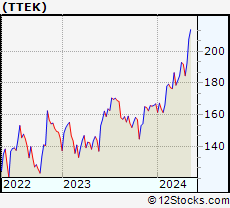 | TTEK Tetra Tech, Inc. |
| Sector: Services & Goods | |
| SubSector: Technical Services | |
| MarketCap: 3985.5 Millions | |
| Recent Price: 190.31 Smart Investing & Trading Score: 68 | |
| Day Percent Change: 0.54% Day Change: 1.02 | |
| Week Change: 3.05% Year-to-date Change: 14.0% | |
| TTEK Links: Profile News Message Board | |
| Charts:- Daily , Weekly | |
| Add TTEK to Watchlist: View: Get Complete TTEK Trend Analysis ➞ | |
 | LPX Louisiana-Pacific Corporation |
| Sector: Services & Goods | |
| SubSector: Building Materials Wholesale | |
| MarketCap: 1943.43 Millions | |
| Recent Price: 74.30 Smart Investing & Trading Score: 63 | |
| Day Percent Change: -1.18% Day Change: -0.89 | |
| Week Change: 3.04% Year-to-date Change: 4.9% | |
| LPX Links: Profile News Message Board | |
| Charts:- Daily , Weekly | |
| Add LPX to Watchlist: View: Get Complete LPX Trend Analysis ➞ | |
 | PWR Quanta Services, Inc. |
| Sector: Industrials | |
| SubSector: General Contractors | |
| MarketCap: 3936.63 Millions | |
| Recent Price: 250.62 Smart Investing & Trading Score: 56 | |
| Day Percent Change: -1.01% Day Change: -2.56 | |
| Week Change: 3.03% Year-to-date Change: 16.1% | |
| PWR Links: Profile News Message Board | |
| Charts:- Daily , Weekly | |
| Add PWR to Watchlist: View: Get Complete PWR Trend Analysis ➞ | |
 | CLX The Clorox Company |
| Sector: Consumer Staples | |
| SubSector: Housewares & Accessories | |
| MarketCap: 23688.3 Millions | |
| Recent Price: 147.90 Smart Investing & Trading Score: 95 | |
| Day Percent Change: 0.08% Day Change: 0.12 | |
| Week Change: 3.03% Year-to-date Change: 3.7% | |
| CLX Links: Profile News Message Board | |
| Charts:- Daily , Weekly | |
| Add CLX to Watchlist: View: Get Complete CLX Trend Analysis ➞ | |
 | KBR KBR, Inc. |
| Sector: Services & Goods | |
| SubSector: Technical Services | |
| MarketCap: 2526.1 Millions | |
| Recent Price: 64.56 Smart Investing & Trading Score: 75 | |
| Day Percent Change: 0.28% Day Change: 0.18 | |
| Week Change: 3.02% Year-to-date Change: 16.5% | |
| KBR Links: Profile News Message Board | |
| Charts:- Daily , Weekly | |
| Add KBR to Watchlist: View: Get Complete KBR Trend Analysis ➞ | |
 | BOKF BOK Financial Corporation |
| Sector: Financials | |
| SubSector: Regional - Southwest Banks | |
| MarketCap: 2945.35 Millions | |
| Recent Price: 90.49 Smart Investing & Trading Score: 100 | |
| Day Percent Change: -2.75% Day Change: -2.56 | |
| Week Change: 3.01% Year-to-date Change: 5.7% | |
| BOKF Links: Profile News Message Board | |
| Charts:- Daily , Weekly | |
| Add BOKF to Watchlist: View: Get Complete BOKF Trend Analysis ➞ | |
 | SNX SYNNEX Corporation |
| Sector: Technology | |
| SubSector: Information Technology Services | |
| MarketCap: 4519.48 Millions | |
| Recent Price: 116.71 Smart Investing & Trading Score: 93 | |
| Day Percent Change: -0.46% Day Change: -0.53 | |
| Week Change: 2.99% Year-to-date Change: 8.5% | |
| SNX Links: Profile News Message Board | |
| Charts:- Daily , Weekly | |
| Add SNX to Watchlist: View: Get Complete SNX Trend Analysis ➞ | |
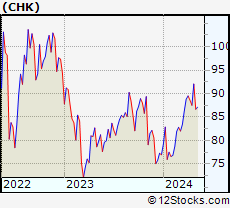 | CHK Chesapeake Energy Corporation |
| Sector: Energy | |
| SubSector: Oil & Gas E&P | |
| MarketCap: 10840 Millions | |
| Recent Price: 90.11 Smart Investing & Trading Score: 90 | |
| Day Percent Change: -0.63% Day Change: -0.58 | |
| Week Change: 2.98% Year-to-date Change: 17.1% | |
| CHK Links: Profile News Message Board | |
| Charts:- Daily , Weekly | |
| Add CHK to Watchlist: View: Get Complete CHK Trend Analysis ➞ | |
 | ALGN Align Technology, Inc. |
| Sector: Health Care | |
| SubSector: Medical Appliances & Equipment | |
| MarketCap: 12802 Millions | |
| Recent Price: 307.88 Smart Investing & Trading Score: 68 | |
| Day Percent Change: -1.88% Day Change: -5.89 | |
| Week Change: 2.98% Year-to-date Change: 12.4% | |
| ALGN Links: Profile News Message Board | |
| Charts:- Daily , Weekly | |
| Add ALGN to Watchlist: View: Get Complete ALGN Trend Analysis ➞ | |
 | WAT Waters Corporation |
| Sector: Health Care | |
| SubSector: Medical Instruments & Supplies | |
| MarketCap: 11882 Millions | |
| Recent Price: 304.88 Smart Investing & Trading Score: 25 | |
| Day Percent Change: -1.73% Day Change: -5.37 | |
| Week Change: 2.97% Year-to-date Change: -7.4% | |
| WAT Links: Profile News Message Board | |
| Charts:- Daily , Weekly | |
| Add WAT to Watchlist: View: Get Complete WAT Trend Analysis ➞ | |
 | HEI HEICO Corporation |
| Sector: Industrials | |
| SubSector: Aerospace/Defense Products & Services | |
| MarketCap: 10023.1 Millions | |
| Recent Price: 202.96 Smart Investing & Trading Score: 93 | |
| Day Percent Change: -0.87% Day Change: -1.79 | |
| Week Change: 2.97% Year-to-date Change: 13.5% | |
| HEI Links: Profile News Message Board | |
| Charts:- Daily , Weekly | |
| Add HEI to Watchlist: View: Get Complete HEI Trend Analysis ➞ | |
 | SHC Sotera Health Company |
| Sector: Health Care | |
| SubSector: Diagnostics & Research | |
| MarketCap: 71087 Millions | |
| Recent Price: 11.11 Smart Investing & Trading Score: 37 | |
| Day Percent Change: -1.33% Day Change: -0.15 | |
| Week Change: 2.97% Year-to-date Change: -34.1% | |
| SHC Links: Profile News Message Board | |
| Charts:- Daily , Weekly | |
| Add SHC to Watchlist: View: Get Complete SHC Trend Analysis ➞ | |
 | JLL Jones Lang LaSalle Incorporated |
| Sector: Financials | |
| SubSector: Property Management | |
| MarketCap: 5259.32 Millions | |
| Recent Price: 180.30 Smart Investing & Trading Score: 63 | |
| Day Percent Change: -0.86% Day Change: -1.56 | |
| Week Change: 2.96% Year-to-date Change: -4.5% | |
| JLL Links: Profile News Message Board | |
| Charts:- Daily , Weekly | |
| Add JLL to Watchlist: View: Get Complete JLL Trend Analysis ➞ | |
 | OMF OneMain Holdings, Inc. |
| Sector: Financials | |
| SubSector: Credit Services | |
| MarketCap: 2753.38 Millions | |
| Recent Price: 50.14 Smart Investing & Trading Score: 93 | |
| Day Percent Change: -2.28% Day Change: -1.17 | |
| Week Change: 2.96% Year-to-date Change: 1.9% | |
| OMF Links: Profile News Message Board | |
| Charts:- Daily , Weekly | |
| Add OMF to Watchlist: View: Get Complete OMF Trend Analysis ➞ | |
 | AVB AvalonBay Communities, Inc. |
| Sector: Financials | |
| SubSector: REIT - Residential | |
| MarketCap: 19921.9 Millions | |
| Recent Price: 189.54 Smart Investing & Trading Score: 100 | |
| Day Percent Change: -0.94% Day Change: -1.81 | |
| Week Change: 2.94% Year-to-date Change: 1.2% | |
| AVB Links: Profile News Message Board | |
| Charts:- Daily , Weekly | |
| Add AVB to Watchlist: View: Get Complete AVB Trend Analysis ➞ | |
 | MPW Medical Properties Trust, Inc. |
| Sector: Financials | |
| SubSector: REIT - Healthcare Facilities | |
| MarketCap: 8586.74 Millions | |
| Recent Price: 4.55 Smart Investing & Trading Score: 71 | |
| Day Percent Change: -0.44% Day Change: -0.02 | |
| Week Change: 2.94% Year-to-date Change: -7.3% | |
| MPW Links: Profile News Message Board | |
| Charts:- Daily , Weekly | |
| Add MPW to Watchlist: View: Get Complete MPW Trend Analysis ➞ | |
 | CPRT Copart, Inc. |
| Sector: Services & Goods | |
| SubSector: Auto Dealerships | |
| MarketCap: 15462.1 Millions | |
| Recent Price: 54.42 Smart Investing & Trading Score: 58 | |
| Day Percent Change: -0.93% Day Change: -0.51 | |
| Week Change: 2.91% Year-to-date Change: 11.1% | |
| CPRT Links: Profile News Message Board | |
| Charts:- Daily , Weekly | |
| Add CPRT to Watchlist: View: Get Complete CPRT Trend Analysis ➞ | |
| For tabular summary view of above stock list: Summary View ➞ 0 - 25 , 25 - 50 , 50 - 75 , 75 - 100 , 100 - 125 , 125 - 150 , 150 - 175 , 175 - 200 , 200 - 225 , 225 - 250 , 250 - 275 , 275 - 300 , 300 - 325 , 325 - 350 , 350 - 375 , 375 - 400 , 400 - 425 , 425 - 450 , 450 - 475 , 475 - 500 , 500 - 525 , 525 - 550 , 550 - 575 , 575 - 600 , 600 - 625 , 625 - 650 , 650 - 675 , 675 - 700 , 700 - 725 , 725 - 750 | ||
| Click To Change The Sort Order: By Market Cap or Company Size Performance: Year-to-date, Week and Day | |
| Select Chart Type: | ||
|
Best Stocks Today 12Stocks.com |
© 2024 12Stocks.com Terms & Conditions Privacy Contact Us
All Information Provided Only For Education And Not To Be Used For Investing or Trading. See Terms & Conditions


One More Thing ... Get Best Stocks Delivered Daily!
Never Ever Miss A Move With Our Top Ten Stocks Lists
Find Best Stocks In Any Market - Bull or Bear Market
Take A Peek At Our Top Ten Stocks Lists: Daily, Weekly, Year-to-Date & Top Trends
Find Best Stocks In Any Market - Bull or Bear Market
Take A Peek At Our Top Ten Stocks Lists: Daily, Weekly, Year-to-Date & Top Trends
Midcap Stocks With Best Up Trends [0-bearish to 100-bullish]: HashiCorp [100], Kirby [100], Ardagh Metal[100], Churchill Downs[100], Dover [100], Antero Resources[100], Virtu Financial[100], Allegro Micro[100], EQT [100], Avnet [100], Hess [100]
Best Midcap Stocks Year-to-Date:
Vistra Energy[85.85%], ShockWave Medical[72.5%], AppLovin [69.92%], EMCOR [63.63%], Constellation Energy[60.24%], Spotify [49%], Pure Storage[43.37%], Wingstop [43.31%], Antero Resources[42.68%], Natera [40.96%], Interactive Brokers[40.6%] Best Midcap Stocks This Week:
HashiCorp [37.23%], Hasbro [17.46%], Globe Life[14.66%], Kirby [13.78%], Watsco [12.7%], Ardagh Metal[12.61%], Wabtec [12.29%], Teradyne [12.18%], TransUnion [12%], First Citizens[11.92%], MongoDB [10.68%] Best Midcap Stocks Daily:
HashiCorp [10.94%], TransUnion [8.77%], Kirby [7.88%], Carrier Global[7.19%], First Citizens[6.99%], Teradyne [6.91%], Ardagh Metal[6.65%], Tyler Technologies[6.24%], Churchill Downs[6.18%], CACI [5.50%], Wyndham Hotels[4.53%]