
 Login Sign Up


| |||||
 |  | ||||

| 12Stocks.com Market Intelligence |
Best MidCap Stocks
|
| In a hurry? Mid Cap Stocks Lists: Performance Trends Table, Stock Charts
Sort midcap stocks: Daily, Weekly, Year-to-Date, Market Cap & Trends. Filter midcap stocks list by sector: Show all, Tech, Finance, Energy, Staples, Retail, Industrial, Materials, Utilities and HealthCare Filter midcap stocks list by size:All MidCap Large Mid-Range Small |
| 12Stocks.com Mid Cap Stocks Performances & Trends Daily | |||||||||
|
|  The overall Smart Investing & Trading Score is 49 (0-bearish to 100-bullish) which puts Mid Cap index in short term neutral trend. The Smart Investing & Trading Score from previous trading session is 63 and hence a deterioration of trend.
| ||||||||
Here are the Smart Investing & Trading Scores of the most requested mid cap stocks at 12Stocks.com (click stock name for detailed review):
|


| 12Stocks.com: Top Performing Mid Cap Index Stocks | ||||||||||||||||||||||||||||||||||||||||||||||||
 The top performing Mid Cap Index stocks year to date are
Now, more recently, over last week, the top performing Mid Cap Index stocks on the move are


|
||||||||||||||||||||||||||||||||||||||||||||||||
| 12Stocks.com: Investing in Midcap Index with Stocks | |
|
The following table helps investors and traders sort through current performance and trends (as measured by Smart Investing & Trading Score) of various
stocks in the Midcap Index. Quick View: Move mouse or cursor over stock symbol (ticker) to view short-term technical chart and over stock name to view long term chart. Click on  to add stock symbol to your watchlist and to add stock symbol to your watchlist and  to view watchlist. Click on any ticker or stock name for detailed market intelligence report for that stock. to view watchlist. Click on any ticker or stock name for detailed market intelligence report for that stock. |
12Stocks.com Performance of Stocks in Midcap Index
| Ticker | Stock Name | Watchlist | Category | Recent Price | Smart Investing & Trading Score | Change % | YTD Change% |
| OLED | Universal Display |   | Technology | 156.58 | 42 | 0.09 | -18.13% |
| WWD | Woodward | | Industrials | 149.74 | 63 | 0.09 | 10.00% |
| WRB | W. R. | | Financials | 77.91 | 0 | 0.08 | 10.17% |
| WTRG | Essential Utilities | | Utilities | 36.57 | 75 | 0.08 | -2.09% |
| AEE | Ameren | | Utilities | 74.76 | 93 | 0.07 | 3.35% |
| TXRH | Texas Roadhouse | | Services & Goods | 156.87 | 90 | 0.07 | 28.34% |
| SWAV | ShockWave Medical | | Health Care | 329.09 | 61 | 0.07 | 72.70% |
| AJG | Arthur J. | | Financials | 236.95 | 51 | 0.06 | 5.37% |
| MTG | MGIC | | Financials | 20.36 | 58 | 0.05 | 5.55% |
| HII | Huntington Ingalls | | Industrials | 275.98 | 51 | 0.05 | 6.29% |
| FICO | Fair Isaac | | Technology | 1193.66 | 55 | 0.05 | 2.55% |
| BRX | Brixmor Property | | Financials | 21.77 | 42 | 0.05 | -6.45% |
| DOCU | DocuSign | | Technology | 57.32 | 22 | 0.05 | -3.58% |
| ALL | Allstate | | Financials | 172.34 | 51 | 0.04 | 23.12% |
| RGA | Reinsurance | | Financials | 191.06 | 70 | 0.03 | 18.10% |
| DVA | DaVita | | Health Care | 132.77 | 61 | 0.02 | 26.74% |
| FR | First Industrial | | Financials | 46.04 | 25 | 0.02 | -12.59% |
| HAL | Halliburton | | Energy | 38.72 | 61 | 0.00 | 7.11% |
| WEN | Wendy s | | Services & Goods | 19.82 | 88 | 0.00 | 1.75% |
| AMC | AMC Entertainment | | Services & Goods | 3.28 | 57 | 0.00 | -46.41% |
| NTNX | Nutanix | | Technology | 60.89 | 51 | 0.00 | 27.68% |
| AVB | AvalonBay Communities | | Financials | 191.32 | 100 | -0.01 | 2.19% |
| UHAL | AMERCO | | Transports | 64.97 | 42 | -0.02 | -9.51% |
| MSCI | MSCI | | Technology | 464.49 | 17 | -0.03 | -17.88% |
| MP | MP Materials | | Materials | 15.73 | 30 | -0.03 | -20.73% |
| For chart view version of above stock list: Chart View ➞ 0 - 25 , 25 - 50 , 50 - 75 , 75 - 100 , 100 - 125 , 125 - 150 , 150 - 175 , 175 - 200 , 200 - 225 , 225 - 250 , 250 - 275 , 275 - 300 , 300 - 325 , 325 - 350 , 350 - 375 , 375 - 400 , 400 - 425 , 425 - 450 , 450 - 475 , 475 - 500 , 500 - 525 , 525 - 550 , 550 - 575 , 575 - 600 , 600 - 625 , 625 - 650 , 650 - 675 , 675 - 700 , 700 - 725 , 725 - 750 , 750 - 775 | ||
 | Click To Change The Sort Order: By Market Cap or Company Size Performance: Year-to-date, Week and Day |  |
|
Get the most comprehensive stock market coverage daily at 12Stocks.com ➞ Best Stocks Today ➞ Best Stocks Weekly ➞ Best Stocks Year-to-Date ➞ Best Stocks Trends ➞  Best Stocks Today 12Stocks.com Best Nasdaq Stocks ➞ Best S&P 500 Stocks ➞ Best Tech Stocks ➞ Best Biotech Stocks ➞ |
| Detailed Overview of Midcap Stocks |
| Midcap Technical Overview, Leaders & Laggards, Top Midcap ETF Funds & Detailed Midcap Stocks List, Charts, Trends & More |
| Midcap: Technical Analysis, Trends & YTD Performance | |
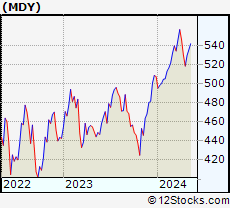
| MidCap segment as represented by
MDY, an exchange-traded fund [ETF], holds basket of about four hundred midcap stocks from across all major sectors of the US stock market. The midcap index (contains stocks like Green Mountain Coffee Roasters and Tractor Supply Company) is up by 4.04% and is currently underperforming the overall market by -1.12% year-to-date. Below is a quick view of technical charts and trends: | |
 MDY Weekly Chart |
|
| Long Term Trend: Good | |
| Medium Term Trend: Not Good | |
 MDY Daily Chart |
|
| Short Term Trend: Very Good | |
| Overall Trend Score: 49 | |
| YTD Performance: 4.04% | |
| **Trend Scores & Views Are Only For Educational Purposes And Not For Investing | |
| 12Stocks.com: Investing in Midcap Index using Exchange Traded Funds | |
|
The following table shows list of key exchange traded funds (ETF) that
help investors track Midcap index. The following list also includes leveraged ETF funds that track twice or thrice the daily returns of Midcap indices. Short or inverse ETF funds move in the opposite direction to the index they track and are useful during market pullbacks or during bear markets. Quick View: Move mouse or cursor over ETF symbol (ticker) to view short-term technical chart and over ETF name to view long term chart. Click on ticker or stock name for detailed view. Click on to add stock symbol to your watchlist and to view watchlist. |
12Stocks.com List of ETFs that track Midcap Index
| Ticker | ETF Name | Watchlist | Recent Price | Smart Investing & Trading Score | Change % | Week % | Year-to-date % |
| IJH | iShares Core S&P Mid-Cap | | 57.68 | 61 | -0.33 | 1.94 | 4.06% |
| IWP | iShares Russell Mid-Cap Growth | | 108.46 | 51 | -0.03 | 2.61 | 3.83% |
| IWR | iShares Russell Mid-Cap | | 80.27 | 56 | -0.17 | 2.05 | 3.27% |
| MDY | SPDR S&P MidCap 400 ETF | | 527.86 | 49 | -0.37 | 1.85 | 4.04% |
| IWS | iShares Russell Mid-Cap Value | | 119.79 | 61 | -0.15 | 1.82 | 3.01% |
| IJK | iShares S&P Mid-Cap 400 Growth | | 86.74 | 56 | -0.29 | 2.23 | 9.49% |
| IJJ | iShares S&P Mid-Cap 400 Value | | 111.95 | 51 | -0.57 | 1.27 | -1.83% |
| XMLV | PowerShares S&P MidCap Low Volatil ETF | | 54.74 | 68 | -0.55 | 1.07 | 2.93% |
| SMDD | ProShares UltraPro Short MidCap400 | | 11.89 | 39 | 0.46 | -5.36 | -11.69% |
| UMDD | ProShares UltraPro MidCap400 | | 23.72 | 49 | -1.54 | 5.13 | 6.27% |
| MVV | ProShares Ultra MidCap400 | | 61.03 | 41 | -0.93 | 3.44 | 5.42% |
| MZZ | ProShares UltraShort MidCap400 | | 11.75 | 34 | 0.51 | -3.46 | -6.53% |
| MYY | ProShares Short MidCap400 | | 20.97 | 39 | 1.11 | -1.03 | -2.26% |
| 12Stocks.com: Charts, Trends, Fundamental Data and Performances of MidCap Stocks | |
|
We now take in-depth look at all MidCap stocks including charts, multi-period performances and overall trends (as measured by Smart Investing & Trading Score). One can sort MidCap stocks (click link to choose) by Daily, Weekly and by Year-to-Date performances. Also, one can sort by size of the company or by market capitalization. |
| Select Your Default Chart Type: | |||||
| |||||
| Click on stock symbol or name for detailed view. Click on to add stock symbol to your watchlist and to view watchlist. Quick View: Move mouse or cursor over "Daily" to quickly view daily technical stock chart and over "Weekly" to view weekly technical stock chart. | |||||

 | OLED Universal Display Corporation |
| Sector: Technology | |
| SubSector: Semiconductor Equipment & Materials | |
| MarketCap: 5660.08 Millions | |
| Recent Price: 156.58 Smart Investing & Trading Score: 42 | |
| Day Percent Change: 0.09% Day Change: 0.14 | |
| Week Change: 4.52% Year-to-date Change: -18.1% | |
| OLED Links: Profile News Message Board | |
| Charts:- Daily , Weekly | |
| Add OLED to Watchlist: View: Get Complete OLED Trend Analysis ➞ | |
 | WWD Woodward, Inc. |
| Sector: Industrials | |
| SubSector: Aerospace/Defense Products & Services | |
| MarketCap: 3764.01 Millions | |
| Recent Price: 149.74 Smart Investing & Trading Score: 63 | |
| Day Percent Change: 0.09% Day Change: 0.13 | |
| Week Change: 1.53% Year-to-date Change: 10.0% | |
| WWD Links: Profile News Message Board | |
| Charts:- Daily , Weekly | |
| Add WWD to Watchlist: View: Get Complete WWD Trend Analysis ➞ | |
 | WRB W. R. Berkley Corporation |
| Sector: Financials | |
| SubSector: Property & Casualty Insurance | |
| MarketCap: 9863.82 Millions | |
| Recent Price: 77.91 Smart Investing & Trading Score: 0 | |
| Day Percent Change: 0.08% Day Change: 0.06 | |
| Week Change: -5.45% Year-to-date Change: 10.2% | |
| WRB Links: Profile News Message Board | |
| Charts:- Daily , Weekly | |
| Add WRB to Watchlist: View: Get Complete WRB Trend Analysis ➞ | |
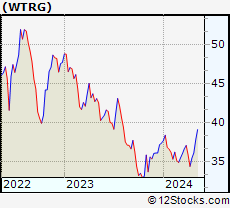 | WTRG Essential Utilities, Inc. |
| Sector: Utilities | |
| SubSector: Water Utilities | |
| MarketCap: 8485.22 Millions | |
| Recent Price: 36.57 Smart Investing & Trading Score: 75 | |
| Day Percent Change: 0.08% Day Change: 0.03 | |
| Week Change: 3.19% Year-to-date Change: -2.1% | |
| WTRG Links: Profile News Message Board | |
| Charts:- Daily , Weekly | |
| Add WTRG to Watchlist: View: Get Complete WTRG Trend Analysis ➞ | |
 | AEE Ameren Corporation |
| Sector: Utilities | |
| SubSector: Electric Utilities | |
| MarketCap: 17308.2 Millions | |
| Recent Price: 74.76 Smart Investing & Trading Score: 93 | |
| Day Percent Change: 0.07% Day Change: 0.05 | |
| Week Change: 1.19% Year-to-date Change: 3.4% | |
| AEE Links: Profile News Message Board | |
| Charts:- Daily , Weekly | |
| Add AEE to Watchlist: View: Get Complete AEE Trend Analysis ➞ | |
 | TXRH Texas Roadhouse, Inc. |
| Sector: Services & Goods | |
| SubSector: Restaurants | |
| MarketCap: 2569.4 Millions | |
| Recent Price: 156.87 Smart Investing & Trading Score: 90 | |
| Day Percent Change: 0.07% Day Change: 0.11 | |
| Week Change: 4.07% Year-to-date Change: 28.3% | |
| TXRH Links: Profile News Message Board | |
| Charts:- Daily , Weekly | |
| Add TXRH to Watchlist: View: Get Complete TXRH Trend Analysis ➞ | |
 | SWAV ShockWave Medical, Inc. |
| Sector: Health Care | |
| SubSector: Medical Appliances & Equipment | |
| MarketCap: 855.58 Millions | |
| Recent Price: 329.09 Smart Investing & Trading Score: 61 | |
| Day Percent Change: 0.07% Day Change: 0.22 | |
| Week Change: 0.02% Year-to-date Change: 72.7% | |
| SWAV Links: Profile News Message Board | |
| Charts:- Daily , Weekly | |
| Add SWAV to Watchlist: View: Get Complete SWAV Trend Analysis ➞ | |
 | AJG Arthur J. Gallagher & Co. |
| Sector: Financials | |
| SubSector: Insurance Brokers | |
| MarketCap: 14852.2 Millions | |
| Recent Price: 236.95 Smart Investing & Trading Score: 51 | |
| Day Percent Change: 0.06% Day Change: 0.14 | |
| Week Change: 0.16% Year-to-date Change: 5.4% | |
| AJG Links: Profile News Message Board | |
| Charts:- Daily , Weekly | |
| Add AJG to Watchlist: View: Get Complete AJG Trend Analysis ➞ | |
 | MTG MGIC Investment Corporation |
| Sector: Financials | |
| SubSector: Property & Casualty Insurance | |
| MarketCap: 2521.62 Millions | |
| Recent Price: 20.36 Smart Investing & Trading Score: 58 | |
| Day Percent Change: 0.05% Day Change: 0.01 | |
| Week Change: 2.67% Year-to-date Change: 5.6% | |
| MTG Links: Profile News Message Board | |
| Charts:- Daily , Weekly | |
| Add MTG to Watchlist: View: Get Complete MTG Trend Analysis ➞ | |
 | HII Huntington Ingalls Industries, Inc. |
| Sector: Industrials | |
| SubSector: Aerospace/Defense Products & Services | |
| MarketCap: 7276.11 Millions | |
| Recent Price: 275.98 Smart Investing & Trading Score: 51 | |
| Day Percent Change: 0.05% Day Change: 0.14 | |
| Week Change: 1.59% Year-to-date Change: 6.3% | |
| HII Links: Profile News Message Board | |
| Charts:- Daily , Weekly | |
| Add HII to Watchlist: View: Get Complete HII Trend Analysis ➞ | |
 | FICO Fair Isaac Corporation |
| Sector: Technology | |
| SubSector: Business Software & Services | |
| MarketCap: 7930.98 Millions | |
| Recent Price: 1193.66 Smart Investing & Trading Score: 55 | |
| Day Percent Change: 0.05% Day Change: 0.63 | |
| Week Change: 5.63% Year-to-date Change: 2.6% | |
| FICO Links: Profile News Message Board | |
| Charts:- Daily , Weekly | |
| Add FICO to Watchlist: View: Get Complete FICO Trend Analysis ➞ | |
 | BRX Brixmor Property Group Inc. |
| Sector: Financials | |
| SubSector: REIT - Retail | |
| MarketCap: 3561.54 Millions | |
| Recent Price: 21.77 Smart Investing & Trading Score: 42 | |
| Day Percent Change: 0.05% Day Change: 0.01 | |
| Week Change: 1.4% Year-to-date Change: -6.5% | |
| BRX Links: Profile News Message Board | |
| Charts:- Daily , Weekly | |
| Add BRX to Watchlist: View: Get Complete BRX Trend Analysis ➞ | |
 | DOCU DocuSign, Inc. |
| Sector: Technology | |
| SubSector: Business Software & Services | |
| MarketCap: 15618.8 Millions | |
| Recent Price: 57.32 Smart Investing & Trading Score: 22 | |
| Day Percent Change: 0.05% Day Change: 0.03 | |
| Week Change: 2.98% Year-to-date Change: -3.6% | |
| DOCU Links: Profile News Message Board | |
| Charts:- Daily , Weekly | |
| Add DOCU to Watchlist: View: Get Complete DOCU Trend Analysis ➞ | |
 | ALL The Allstate Corporation |
| Sector: Financials | |
| SubSector: Property & Casualty Insurance | |
| MarketCap: 25916.6 Millions | |
| Recent Price: 172.34 Smart Investing & Trading Score: 51 | |
| Day Percent Change: 0.04% Day Change: 0.07 | |
| Week Change: -0.36% Year-to-date Change: 23.1% | |
| ALL Links: Profile News Message Board | |
| Charts:- Daily , Weekly | |
| Add ALL to Watchlist: View: Get Complete ALL Trend Analysis ➞ | |
 | RGA Reinsurance Group of America, Incorporated |
| Sector: Financials | |
| SubSector: Life Insurance | |
| MarketCap: 4423.36 Millions | |
| Recent Price: 191.06 Smart Investing & Trading Score: 70 | |
| Day Percent Change: 0.03% Day Change: 0.05 | |
| Week Change: 2.43% Year-to-date Change: 18.1% | |
| RGA Links: Profile News Message Board | |
| Charts:- Daily , Weekly | |
| Add RGA to Watchlist: View: Get Complete RGA Trend Analysis ➞ | |
 | DVA DaVita Inc. |
| Sector: Health Care | |
| SubSector: Specialized Health Services | |
| MarketCap: 8954.36 Millions | |
| Recent Price: 132.77 Smart Investing & Trading Score: 61 | |
| Day Percent Change: 0.02% Day Change: 0.03 | |
| Week Change: 3.87% Year-to-date Change: 26.7% | |
| DVA Links: Profile News Message Board | |
| Charts:- Daily , Weekly | |
| Add DVA to Watchlist: View: Get Complete DVA Trend Analysis ➞ | |
 | FR First Industrial Realty Trust, Inc. |
| Sector: Financials | |
| SubSector: REIT - Industrial | |
| MarketCap: 3883.39 Millions | |
| Recent Price: 46.04 Smart Investing & Trading Score: 25 | |
| Day Percent Change: 0.02% Day Change: 0.01 | |
| Week Change: 0.9% Year-to-date Change: -12.6% | |
| FR Links: Profile News Message Board | |
| Charts:- Daily , Weekly | |
| Add FR to Watchlist: View: Get Complete FR Trend Analysis ➞ | |
 | HAL Halliburton Company |
| Sector: Energy | |
| SubSector: Oil & Gas Equipment & Services | |
| MarketCap: 5419.41 Millions | |
| Recent Price: 38.72 Smart Investing & Trading Score: 61 | |
| Day Percent Change: 0.00% Day Change: 0.00 | |
| Week Change: -0.92% Year-to-date Change: 7.1% | |
| HAL Links: Profile News Message Board | |
| Charts:- Daily , Weekly | |
| Add HAL to Watchlist: View: Get Complete HAL Trend Analysis ➞ | |
 | WEN The Wendy s Company |
| Sector: Services & Goods | |
| SubSector: Restaurants | |
| MarketCap: 2814.9 Millions | |
| Recent Price: 19.82 Smart Investing & Trading Score: 88 | |
| Day Percent Change: 0.00% Day Change: 0.00 | |
| Week Change: 2.96% Year-to-date Change: 1.8% | |
| WEN Links: Profile News Message Board | |
| Charts:- Daily , Weekly | |
| Add WEN to Watchlist: View: Get Complete WEN Trend Analysis ➞ | |
 | AMC AMC Entertainment Holdings, Inc. |
| Sector: Services & Goods | |
| SubSector: Movie Production, Theaters | |
| MarketCap: 415.929 Millions | |
| Recent Price: 3.28 Smart Investing & Trading Score: 57 | |
| Day Percent Change: 0.00% Day Change: 0.00 | |
| Week Change: 3.8% Year-to-date Change: -46.4% | |
| AMC Links: Profile News Message Board | |
| Charts:- Daily , Weekly | |
| Add AMC to Watchlist: View: Get Complete AMC Trend Analysis ➞ | |
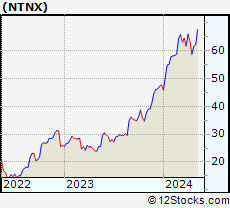 | NTNX Nutanix, Inc. |
| Sector: Technology | |
| SubSector: Technical & System Software | |
| MarketCap: 3376.6 Millions | |
| Recent Price: 60.89 Smart Investing & Trading Score: 51 | |
| Day Percent Change: 0.00% Day Change: 0.00 | |
| Week Change: 3.64% Year-to-date Change: 27.7% | |
| NTNX Links: Profile News Message Board | |
| Charts:- Daily , Weekly | |
| Add NTNX to Watchlist: View: Get Complete NTNX Trend Analysis ➞ | |
 | AVB AvalonBay Communities, Inc. |
| Sector: Financials | |
| SubSector: REIT - Residential | |
| MarketCap: 19921.9 Millions | |
| Recent Price: 191.32 Smart Investing & Trading Score: 100 | |
| Day Percent Change: -0.01% Day Change: -0.02 | |
| Week Change: 3.9% Year-to-date Change: 2.2% | |
| AVB Links: Profile News Message Board | |
| Charts:- Daily , Weekly | |
| Add AVB to Watchlist: View: Get Complete AVB Trend Analysis ➞ | |
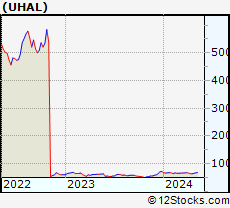 | UHAL AMERCO |
| Sector: Transports | |
| SubSector: Rental & Leasing Services | |
| MarketCap: 5271.94 Millions | |
| Recent Price: 64.97 Smart Investing & Trading Score: 42 | |
| Day Percent Change: -0.02% Day Change: -0.01 | |
| Week Change: 2.8% Year-to-date Change: -9.5% | |
| UHAL Links: Profile News Message Board | |
| Charts:- Daily , Weekly | |
| Add UHAL to Watchlist: View: Get Complete UHAL Trend Analysis ➞ | |
 | MSCI MSCI Inc. |
| Sector: Technology | |
| SubSector: Processing Systems & Products | |
| MarketCap: 21086.3 Millions | |
| Recent Price: 464.49 Smart Investing & Trading Score: 17 | |
| Day Percent Change: -0.03% Day Change: -0.16 | |
| Week Change: -8.94% Year-to-date Change: -17.9% | |
| MSCI Links: Profile News Message Board | |
| Charts:- Daily , Weekly | |
| Add MSCI to Watchlist: View: Get Complete MSCI Trend Analysis ➞ | |
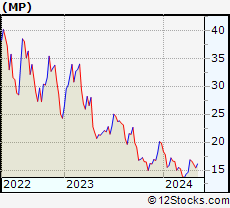 | MP MP Materials Corp. |
| Sector: Materials | |
| SubSector: Other Industrial Metals & Mining | |
| MarketCap: 41237 Millions | |
| Recent Price: 15.73 Smart Investing & Trading Score: 30 | |
| Day Percent Change: -0.03% Day Change: -0.01 | |
| Week Change: -5.15% Year-to-date Change: -20.7% | |
| MP Links: Profile News Message Board | |
| Charts:- Daily , Weekly | |
| Add MP to Watchlist: View: Get Complete MP Trend Analysis ➞ | |
| For tabular summary view of above stock list: Summary View ➞ 0 - 25 , 25 - 50 , 50 - 75 , 75 - 100 , 100 - 125 , 125 - 150 , 150 - 175 , 175 - 200 , 200 - 225 , 225 - 250 , 250 - 275 , 275 - 300 , 300 - 325 , 325 - 350 , 350 - 375 , 375 - 400 , 400 - 425 , 425 - 450 , 450 - 475 , 475 - 500 , 500 - 525 , 525 - 550 , 550 - 575 , 575 - 600 , 600 - 625 , 625 - 650 , 650 - 675 , 675 - 700 , 700 - 725 , 725 - 750 , 750 - 775 | ||
| Click To Change The Sort Order: By Market Cap or Company Size Performance: Year-to-date, Week and Day | |
| Select Chart Type: | ||
|
Best Stocks Today 12Stocks.com |
© 2024 12Stocks.com Terms & Conditions Privacy Contact Us
All Information Provided Only For Education And Not To Be Used For Investing or Trading. See Terms & Conditions


One More Thing ... Get Best Stocks Delivered Daily!
Never Ever Miss A Move With Our Top Ten Stocks Lists
Find Best Stocks In Any Market - Bull or Bear Market
Take A Peek At Our Top Ten Stocks Lists: Daily, Weekly, Year-to-Date & Top Trends
Find Best Stocks In Any Market - Bull or Bear Market
Take A Peek At Our Top Ten Stocks Lists: Daily, Weekly, Year-to-Date & Top Trends
Midcap Stocks With Best Up Trends [0-bearish to 100-bullish]: Kirby [100], HashiCorp [100], Ardagh Metal[100], Teradyne [100], Antero Resources[100], Churchill Downs[100], Dover [100], Tractor Supply[100], Virtu Financial[100], EQT [100], Microchip [100]
Best Midcap Stocks Year-to-Date:
Vistra Energy[88.16%], AppLovin [73.92%], ShockWave Medical[72.7%], EMCOR [62.16%], Constellation Energy[60.54%], Spotify [53.81%], Antero Resources[47.22%], Pure Storage[46.44%], Natera [45.72%], Wingstop [44.17%], CAVA [43.95%] Best Midcap Stocks This Week:
HashiCorp [36.92%], Hasbro [17.55%], Kirby [17.07%], Tandem Diabetes[16.86%], Ardagh Metal[14.9%], First Citizens[14.87%], Antero Resources[14%], Tyler Technologies[13.57%], Teradyne [13.48%], Wabtec [13.19%], Globe Life[13.19%] Best Midcap Stocks Daily:
Kirby [10.99%], HashiCorp [10.69%], First Citizens[9.80%], Tyler Technologies[9.32%], Ardagh Metal[8.82%], TransUnion [8.17%], Teradyne [8.15%], Carrier Global[7.19%], Antero Resources[6.20%], CACI [5.93%], United Rentals[5.45%]