
 Login Sign Up


| |||||
 |  | ||||

| 12Stocks.com Market Intelligence |
Best MidCap Stocks
|
| In a hurry? Mid Cap Stocks Lists: Performance Trends Table, Stock Charts
Sort midcap stocks: Daily, Weekly, Year-to-Date, Market Cap & Trends. Filter midcap stocks list by sector: Show all, Tech, Finance, Energy, Staples, Retail, Industrial, Materials, Utilities and HealthCare Filter midcap stocks list by size:All MidCap Large Mid-Range Small |
| 12Stocks.com Mid Cap Stocks Performances & Trends Daily | |||||||||
|
|  The overall Smart Investing & Trading Score is 49 (0-bearish to 100-bullish) which puts Mid Cap index in short term neutral trend. The Smart Investing & Trading Score from previous trading session is 63 and hence a deterioration of trend.
| ||||||||
Here are the Smart Investing & Trading Scores of the most requested mid cap stocks at 12Stocks.com (click stock name for detailed review):
|


| 12Stocks.com: Top Performing Mid Cap Index Stocks | ||||||||||||||||||||||||||||||||||||||||||||||||
 The top performing Mid Cap Index stocks year to date are
Now, more recently, over last week, the top performing Mid Cap Index stocks on the move are


|
||||||||||||||||||||||||||||||||||||||||||||||||
| 12Stocks.com: Investing in Midcap Index with Stocks | |
|
The following table helps investors and traders sort through current performance and trends (as measured by Smart Investing & Trading Score) of various
stocks in the Midcap Index. Quick View: Move mouse or cursor over stock symbol (ticker) to view short-term technical chart and over stock name to view long term chart. Click on  to add stock symbol to your watchlist and to add stock symbol to your watchlist and  to view watchlist. Click on any ticker or stock name for detailed market intelligence report for that stock. to view watchlist. Click on any ticker or stock name for detailed market intelligence report for that stock. |
12Stocks.com Performance of Stocks in Midcap Index
| Ticker | Stock Name | Watchlist | Category | Recent Price | Smart Investing & Trading Score | Change % | YTD Change% |
| ROIV | Roivant Sciences |   | Health Care | 10.88 | 41 | 0.55 | -2.03% |
| AN | AutoNation | | Services & Goods | 160.38 | 81 | 0.54 | 6.79% |
| RCL | Royal Caribbean | | Services & Goods | 137.47 | 95 | 0.54 | 6.16% |
| OKE | ONEOK | | Utilities | 81.38 | 95 | 0.53 | 15.89% |
| AMH | American Homes | | Financials | 35.76 | 58 | 0.53 | -0.56% |
| CPRT | Copart | | Services & Goods | 55.22 | 58 | 0.53 | 12.69% |
| WMB | Williams | | Energy | 39.45 | 88 | 0.51 | 13.26% |
| TPL | Texas Pacific | | Financials | 592.02 | 49 | 0.51 | -62.35% |
| SAIC | Science Applications | | Technology | 129.12 | 62 | 0.51 | 3.86% |
| ROK | Rockwell Automation | | Industrials | 276.95 | 61 | 0.50 | -10.80% |
| INVH | Invitation Homes | | Financials | 34.48 | 75 | 0.50 | 1.08% |
| PLTK | Playtika Holding | | Services & Goods | 7.05 | 69 | 0.50 | -18.26% |
| ETSY | Etsy | | Services & Goods | 67.20 | 56 | 0.49 | -17.09% |
| OGE | OGE Energy | | Utilities | 34.48 | 100 | 0.47 | -1.29% |
| RPRX | Royalty Pharma | | Health Care | 28.11 | 17 | 0.46 | 0.07% |
| MDU | MDU Resources | | Industrials | 24.80 | 75 | 0.45 | 25.25% |
| OVV | Ovintiv | | Energy | 53.14 | 53 | 0.45 | 20.99% |
| EIX | Edison | | Utilities | 71.13 | 78 | 0.44 | -0.50% |
| EQR | Equity Residential | | Financials | 64.88 | 100 | 0.42 | 6.08% |
| TTWO | Take-Two Interactive | | Technology | 143.43 | 42 | 0.42 | -10.89% |
| JKHY | Jack Henry | | Technology | 165.89 | 41 | 0.42 | 1.52% |
| VICI | VICI Properties | | Financials | 28.55 | 27 | 0.42 | -10.45% |
| PCG | PG&E | | Utilities | 17.07 | 76 | 0.41 | -5.32% |
| DLB | Dolby | | Technology | 79.91 | 25 | 0.41 | -7.28% |
| VNT | Vontier | | Technology | 40.47 | 44 | 0.40 | 17.13% |
| For chart view version of above stock list: Chart View ➞ 0 - 25 , 25 - 50 , 50 - 75 , 75 - 100 , 100 - 125 , 125 - 150 , 150 - 175 , 175 - 200 , 200 - 225 , 225 - 250 , 250 - 275 , 275 - 300 , 300 - 325 , 325 - 350 , 350 - 375 , 375 - 400 , 400 - 425 , 425 - 450 , 450 - 475 , 475 - 500 , 500 - 525 , 525 - 550 , 550 - 575 , 575 - 600 , 600 - 625 , 625 - 650 , 650 - 675 , 675 - 700 , 700 - 725 , 725 - 750 , 750 - 775 | ||
 | Click To Change The Sort Order: By Market Cap or Company Size Performance: Year-to-date, Week and Day |  |
|
Get the most comprehensive stock market coverage daily at 12Stocks.com ➞ Best Stocks Today ➞ Best Stocks Weekly ➞ Best Stocks Year-to-Date ➞ Best Stocks Trends ➞  Best Stocks Today 12Stocks.com Best Nasdaq Stocks ➞ Best S&P 500 Stocks ➞ Best Tech Stocks ➞ Best Biotech Stocks ➞ |
| Detailed Overview of Midcap Stocks |
| Midcap Technical Overview, Leaders & Laggards, Top Midcap ETF Funds & Detailed Midcap Stocks List, Charts, Trends & More |
| Midcap: Technical Analysis, Trends & YTD Performance | |
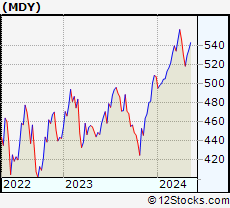
| MidCap segment as represented by
MDY, an exchange-traded fund [ETF], holds basket of about four hundred midcap stocks from across all major sectors of the US stock market. The midcap index (contains stocks like Green Mountain Coffee Roasters and Tractor Supply Company) is up by 4.04% and is currently underperforming the overall market by -1.12% year-to-date. Below is a quick view of technical charts and trends: | |
 MDY Weekly Chart |
|
| Long Term Trend: Good | |
| Medium Term Trend: Not Good | |
 MDY Daily Chart |
|
| Short Term Trend: Very Good | |
| Overall Trend Score: 49 | |
| YTD Performance: 4.04% | |
| **Trend Scores & Views Are Only For Educational Purposes And Not For Investing | |
| 12Stocks.com: Investing in Midcap Index using Exchange Traded Funds | |
|
The following table shows list of key exchange traded funds (ETF) that
help investors track Midcap index. The following list also includes leveraged ETF funds that track twice or thrice the daily returns of Midcap indices. Short or inverse ETF funds move in the opposite direction to the index they track and are useful during market pullbacks or during bear markets. Quick View: Move mouse or cursor over ETF symbol (ticker) to view short-term technical chart and over ETF name to view long term chart. Click on ticker or stock name for detailed view. Click on to add stock symbol to your watchlist and to view watchlist. |
12Stocks.com List of ETFs that track Midcap Index
| Ticker | ETF Name | Watchlist | Recent Price | Smart Investing & Trading Score | Change % | Week % | Year-to-date % |
| IJH | iShares Core S&P Mid-Cap | | 57.68 | 61 | -0.33 | 1.94 | 4.06% |
| IWP | iShares Russell Mid-Cap Growth | | 108.46 | 51 | -0.03 | 2.61 | 3.83% |
| IWR | iShares Russell Mid-Cap | | 80.27 | 56 | -0.17 | 2.05 | 3.27% |
| MDY | SPDR S&P MidCap 400 ETF | | 527.86 | 49 | -0.37 | 1.85 | 4.04% |
| IWS | iShares Russell Mid-Cap Value | | 119.79 | 61 | -0.15 | 1.82 | 3.01% |
| IJK | iShares S&P Mid-Cap 400 Growth | | 86.74 | 56 | -0.29 | 2.23 | 9.49% |
| IJJ | iShares S&P Mid-Cap 400 Value | | 111.95 | 51 | -0.57 | 1.27 | -1.83% |
| XMLV | PowerShares S&P MidCap Low Volatil ETF | | 54.74 | 68 | -0.55 | 1.07 | 2.93% |
| SMDD | ProShares UltraPro Short MidCap400 | | 11.89 | 39 | 0.46 | -5.36 | -11.69% |
| UMDD | ProShares UltraPro MidCap400 | | 23.72 | 49 | -1.54 | 5.13 | 6.27% |
| MVV | ProShares Ultra MidCap400 | | 61.03 | 41 | -0.93 | 3.44 | 5.42% |
| MZZ | ProShares UltraShort MidCap400 | | 11.75 | 34 | 0.51 | -3.46 | -6.53% |
| MYY | ProShares Short MidCap400 | | 20.97 | 39 | 1.11 | -1.03 | -2.26% |
| 12Stocks.com: Charts, Trends, Fundamental Data and Performances of MidCap Stocks | |
|
We now take in-depth look at all MidCap stocks including charts, multi-period performances and overall trends (as measured by Smart Investing & Trading Score). One can sort MidCap stocks (click link to choose) by Daily, Weekly and by Year-to-Date performances. Also, one can sort by size of the company or by market capitalization. |
| Select Your Default Chart Type: | |||||
| |||||
| Click on stock symbol or name for detailed view. Click on to add stock symbol to your watchlist and to view watchlist. Quick View: Move mouse or cursor over "Daily" to quickly view daily technical stock chart and over "Weekly" to view weekly technical stock chart. | |||||

 | ROIV Roivant Sciences Ltd. |
| Sector: Health Care | |
| SubSector: Biotechnology | |
| MarketCap: 7780 Millions | |
| Recent Price: 10.88 Smart Investing & Trading Score: 41 | |
| Day Percent Change: 0.55% Day Change: 0.06 | |
| Week Change: 4.02% Year-to-date Change: -2.0% | |
| ROIV Links: Profile News Message Board | |
| Charts:- Daily , Weekly | |
| Add ROIV to Watchlist: View: Get Complete ROIV Trend Analysis ➞ | |
 | AN AutoNation, Inc. |
| Sector: Services & Goods | |
| SubSector: Auto Dealerships | |
| MarketCap: 2732.61 Millions | |
| Recent Price: 160.38 Smart Investing & Trading Score: 81 | |
| Day Percent Change: 0.54% Day Change: 0.86 | |
| Week Change: 4.05% Year-to-date Change: 6.8% | |
| AN Links: Profile News Message Board | |
| Charts:- Daily , Weekly | |
| Add AN to Watchlist: View: Get Complete AN Trend Analysis ➞ | |
 | RCL Royal Caribbean Cruises Ltd. |
| Sector: Services & Goods | |
| SubSector: Resorts & Casinos | |
| MarketCap: 7294.14 Millions | |
| Recent Price: 137.47 Smart Investing & Trading Score: 95 | |
| Day Percent Change: 0.54% Day Change: 0.74 | |
| Week Change: 6.39% Year-to-date Change: 6.2% | |
| RCL Links: Profile News Message Board | |
| Charts:- Daily , Weekly | |
| Add RCL to Watchlist: View: Get Complete RCL Trend Analysis ➞ | |
 | OKE ONEOK, Inc. |
| Sector: Utilities | |
| SubSector: Gas Utilities | |
| MarketCap: 10788.7 Millions | |
| Recent Price: 81.38 Smart Investing & Trading Score: 95 | |
| Day Percent Change: 0.53% Day Change: 0.43 | |
| Week Change: 2.2% Year-to-date Change: 15.9% | |
| OKE Links: Profile News Message Board | |
| Charts:- Daily , Weekly | |
| Add OKE to Watchlist: View: Get Complete OKE Trend Analysis ➞ | |
 | AMH American Homes 4 Rent |
| Sector: Financials | |
| SubSector: REIT - Residential | |
| MarketCap: 6135.31 Millions | |
| Recent Price: 35.76 Smart Investing & Trading Score: 58 | |
| Day Percent Change: 0.53% Day Change: 0.19 | |
| Week Change: 1.39% Year-to-date Change: -0.6% | |
| AMH Links: Profile News Message Board | |
| Charts:- Daily , Weekly | |
| Add AMH to Watchlist: View: Get Complete AMH Trend Analysis ➞ | |
 | CPRT Copart, Inc. |
| Sector: Services & Goods | |
| SubSector: Auto Dealerships | |
| MarketCap: 15462.1 Millions | |
| Recent Price: 55.22 Smart Investing & Trading Score: 58 | |
| Day Percent Change: 0.53% Day Change: 0.29 | |
| Week Change: 4.43% Year-to-date Change: 12.7% | |
| CPRT Links: Profile News Message Board | |
| Charts:- Daily , Weekly | |
| Add CPRT to Watchlist: View: Get Complete CPRT Trend Analysis ➞ | |
 | WMB The Williams Companies, Inc. |
| Sector: Energy | |
| SubSector: Oil & Gas Pipelines | |
| MarketCap: 16851.5 Millions | |
| Recent Price: 39.45 Smart Investing & Trading Score: 88 | |
| Day Percent Change: 0.51% Day Change: 0.20 | |
| Week Change: 2.44% Year-to-date Change: 13.3% | |
| WMB Links: Profile News Message Board | |
| Charts:- Daily , Weekly | |
| Add WMB to Watchlist: View: Get Complete WMB Trend Analysis ➞ | |
 | TPL Texas Pacific Land Trust |
| Sector: Financials | |
| SubSector: Real Estate Development | |
| MarketCap: 3052.29 Millions | |
| Recent Price: 592.02 Smart Investing & Trading Score: 49 | |
| Day Percent Change: 0.51% Day Change: 3.01 | |
| Week Change: 1.62% Year-to-date Change: -62.4% | |
| TPL Links: Profile News Message Board | |
| Charts:- Daily , Weekly | |
| Add TPL to Watchlist: View: Get Complete TPL Trend Analysis ➞ | |
 | SAIC Science Applications International Corporation |
| Sector: Technology | |
| SubSector: Information Technology Services | |
| MarketCap: 3388.78 Millions | |
| Recent Price: 129.12 Smart Investing & Trading Score: 62 | |
| Day Percent Change: 0.51% Day Change: 0.65 | |
| Week Change: 3.35% Year-to-date Change: 3.9% | |
| SAIC Links: Profile News Message Board | |
| Charts:- Daily , Weekly | |
| Add SAIC to Watchlist: View: Get Complete SAIC Trend Analysis ➞ | |
 | ROK Rockwell Automation, Inc. |
| Sector: Industrials | |
| SubSector: Diversified Machinery | |
| MarketCap: 15666.1 Millions | |
| Recent Price: 276.95 Smart Investing & Trading Score: 61 | |
| Day Percent Change: 0.50% Day Change: 1.39 | |
| Week Change: 2.59% Year-to-date Change: -10.8% | |
| ROK Links: Profile News Message Board | |
| Charts:- Daily , Weekly | |
| Add ROK to Watchlist: View: Get Complete ROK Trend Analysis ➞ | |
 | INVH Invitation Homes Inc. |
| Sector: Financials | |
| SubSector: Real Estate Development | |
| MarketCap: 9782.89 Millions | |
| Recent Price: 34.48 Smart Investing & Trading Score: 75 | |
| Day Percent Change: 0.50% Day Change: 0.17 | |
| Week Change: 2.71% Year-to-date Change: 1.1% | |
| INVH Links: Profile News Message Board | |
| Charts:- Daily , Weekly | |
| Add INVH to Watchlist: View: Get Complete INVH Trend Analysis ➞ | |
 | PLTK Playtika Holding Corp. |
| Sector: Services & Goods | |
| SubSector: Electronic Gaming & Multimedia | |
| MarketCap: 4260 Millions | |
| Recent Price: 7.05 Smart Investing & Trading Score: 69 | |
| Day Percent Change: 0.50% Day Change: 0.04 | |
| Week Change: 2.47% Year-to-date Change: -18.3% | |
| PLTK Links: Profile News Message Board | |
| Charts:- Daily , Weekly | |
| Add PLTK to Watchlist: View: Get Complete PLTK Trend Analysis ➞ | |
 | ETSY Etsy, Inc. |
| Sector: Services & Goods | |
| SubSector: Specialty Retail, Other | |
| MarketCap: 4263.24 Millions | |
| Recent Price: 67.20 Smart Investing & Trading Score: 56 | |
| Day Percent Change: 0.49% Day Change: 0.33 | |
| Week Change: 0.66% Year-to-date Change: -17.1% | |
| ETSY Links: Profile News Message Board | |
| Charts:- Daily , Weekly | |
| Add ETSY to Watchlist: View: Get Complete ETSY Trend Analysis ➞ | |
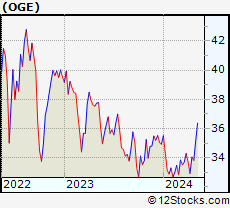 | OGE OGE Energy Corp. |
| Sector: Utilities | |
| SubSector: Electric Utilities | |
| MarketCap: 5454.34 Millions | |
| Recent Price: 34.48 Smart Investing & Trading Score: 100 | |
| Day Percent Change: 0.47% Day Change: 0.16 | |
| Week Change: 1.26% Year-to-date Change: -1.3% | |
| OGE Links: Profile News Message Board | |
| Charts:- Daily , Weekly | |
| Add OGE to Watchlist: View: Get Complete OGE Trend Analysis ➞ | |
 | RPRX Royalty Pharma plc |
| Sector: Health Care | |
| SubSector: Biotechnology | |
| MarketCap: 28457 Millions | |
| Recent Price: 28.11 Smart Investing & Trading Score: 17 | |
| Day Percent Change: 0.46% Day Change: 0.13 | |
| Week Change: -0.18% Year-to-date Change: 0.1% | |
| RPRX Links: Profile News Message Board | |
| Charts:- Daily , Weekly | |
| Add RPRX to Watchlist: View: Get Complete RPRX Trend Analysis ➞ | |
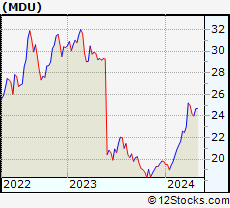 | MDU MDU Resources Group, Inc. |
| Sector: Industrials | |
| SubSector: General Building Materials | |
| MarketCap: 4262.53 Millions | |
| Recent Price: 24.80 Smart Investing & Trading Score: 75 | |
| Day Percent Change: 0.45% Day Change: 0.11 | |
| Week Change: 3.29% Year-to-date Change: 25.3% | |
| MDU Links: Profile News Message Board | |
| Charts:- Daily , Weekly | |
| Add MDU to Watchlist: View: Get Complete MDU Trend Analysis ➞ | |
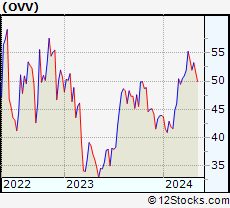 | OVV Ovintiv Inc. |
| Sector: Energy | |
| SubSector: Independent Oil & Gas | |
| MarketCap: 713.793 Millions | |
| Recent Price: 53.14 Smart Investing & Trading Score: 53 | |
| Day Percent Change: 0.45% Day Change: 0.24 | |
| Week Change: 2.23% Year-to-date Change: 21.0% | |
| OVV Links: Profile News Message Board | |
| Charts:- Daily , Weekly | |
| Add OVV to Watchlist: View: Get Complete OVV Trend Analysis ➞ | |
 | EIX Edison International |
| Sector: Utilities | |
| SubSector: Electric Utilities | |
| MarketCap: 19358.1 Millions | |
| Recent Price: 71.13 Smart Investing & Trading Score: 78 | |
| Day Percent Change: 0.44% Day Change: 0.31 | |
| Week Change: 1.72% Year-to-date Change: -0.5% | |
| EIX Links: Profile News Message Board | |
| Charts:- Daily , Weekly | |
| Add EIX to Watchlist: View: Get Complete EIX Trend Analysis ➞ | |
 | EQR Equity Residential |
| Sector: Financials | |
| SubSector: REIT - Residential | |
| MarketCap: 22061.9 Millions | |
| Recent Price: 64.88 Smart Investing & Trading Score: 100 | |
| Day Percent Change: 0.42% Day Change: 0.27 | |
| Week Change: 5.43% Year-to-date Change: 6.1% | |
| EQR Links: Profile News Message Board | |
| Charts:- Daily , Weekly | |
| Add EQR to Watchlist: View: Get Complete EQR Trend Analysis ➞ | |
 | TTWO Take-Two Interactive Software, Inc. |
| Sector: Technology | |
| SubSector: Multimedia & Graphics Software | |
| MarketCap: 12479.6 Millions | |
| Recent Price: 143.43 Smart Investing & Trading Score: 42 | |
| Day Percent Change: 0.42% Day Change: 0.60 | |
| Week Change: 2.01% Year-to-date Change: -10.9% | |
| TTWO Links: Profile News Message Board | |
| Charts:- Daily , Weekly | |
| Add TTWO to Watchlist: View: Get Complete TTWO Trend Analysis ➞ | |
 | JKHY Jack Henry & Associates, Inc. |
| Sector: Technology | |
| SubSector: Information Technology Services | |
| MarketCap: 10695.4 Millions | |
| Recent Price: 165.89 Smart Investing & Trading Score: 41 | |
| Day Percent Change: 0.42% Day Change: 0.69 | |
| Week Change: 0.18% Year-to-date Change: 1.5% | |
| JKHY Links: Profile News Message Board | |
| Charts:- Daily , Weekly | |
| Add JKHY to Watchlist: View: Get Complete JKHY Trend Analysis ➞ | |
 | VICI VICI Properties Inc. |
| Sector: Financials | |
| SubSector: REIT - Diversified | |
| MarketCap: 7327.03 Millions | |
| Recent Price: 28.55 Smart Investing & Trading Score: 27 | |
| Day Percent Change: 0.42% Day Change: 0.12 | |
| Week Change: 2.37% Year-to-date Change: -10.5% | |
| VICI Links: Profile News Message Board | |
| Charts:- Daily , Weekly | |
| Add VICI to Watchlist: View: Get Complete VICI Trend Analysis ➞ | |
 | PCG PG&E Corporation |
| Sector: Utilities | |
| SubSector: Electric Utilities | |
| MarketCap: 5078.04 Millions | |
| Recent Price: 17.07 Smart Investing & Trading Score: 76 | |
| Day Percent Change: 0.41% Day Change: 0.07 | |
| Week Change: 1.31% Year-to-date Change: -5.3% | |
| PCG Links: Profile News Message Board | |
| Charts:- Daily , Weekly | |
| Add PCG to Watchlist: View: Get Complete PCG Trend Analysis ➞ | |
 | DLB Dolby Laboratories, Inc. |
| Sector: Technology | |
| SubSector: Diversified Electronics | |
| MarketCap: 5618.16 Millions | |
| Recent Price: 79.91 Smart Investing & Trading Score: 25 | |
| Day Percent Change: 0.41% Day Change: 0.33 | |
| Week Change: 2.21% Year-to-date Change: -7.3% | |
| DLB Links: Profile News Message Board | |
| Charts:- Daily , Weekly | |
| Add DLB to Watchlist: View: Get Complete DLB Trend Analysis ➞ | |
 | VNT Vontier Corporation |
| Sector: Technology | |
| SubSector: Scientific & Technical Instruments | |
| MarketCap: 53787 Millions | |
| Recent Price: 40.47 Smart Investing & Trading Score: 44 | |
| Day Percent Change: 0.40% Day Change: 0.16 | |
| Week Change: 0.2% Year-to-date Change: 17.1% | |
| VNT Links: Profile News Message Board | |
| Charts:- Daily , Weekly | |
| Add VNT to Watchlist: View: Get Complete VNT Trend Analysis ➞ | |
| For tabular summary view of above stock list: Summary View ➞ 0 - 25 , 25 - 50 , 50 - 75 , 75 - 100 , 100 - 125 , 125 - 150 , 150 - 175 , 175 - 200 , 200 - 225 , 225 - 250 , 250 - 275 , 275 - 300 , 300 - 325 , 325 - 350 , 350 - 375 , 375 - 400 , 400 - 425 , 425 - 450 , 450 - 475 , 475 - 500 , 500 - 525 , 525 - 550 , 550 - 575 , 575 - 600 , 600 - 625 , 625 - 650 , 650 - 675 , 675 - 700 , 700 - 725 , 725 - 750 , 750 - 775 | ||
| Click To Change The Sort Order: By Market Cap or Company Size Performance: Year-to-date, Week and Day | |
| Select Chart Type: | ||
|
Best Stocks Today 12Stocks.com |
© 2024 12Stocks.com Terms & Conditions Privacy Contact Us
All Information Provided Only For Education And Not To Be Used For Investing or Trading. See Terms & Conditions


One More Thing ... Get Best Stocks Delivered Daily!
Never Ever Miss A Move With Our Top Ten Stocks Lists
Find Best Stocks In Any Market - Bull or Bear Market
Take A Peek At Our Top Ten Stocks Lists: Daily, Weekly, Year-to-Date & Top Trends
Find Best Stocks In Any Market - Bull or Bear Market
Take A Peek At Our Top Ten Stocks Lists: Daily, Weekly, Year-to-Date & Top Trends
Midcap Stocks With Best Up Trends [0-bearish to 100-bullish]: Kirby [100], HashiCorp [100], Ardagh Metal[100], Teradyne [100], Antero Resources[100], Churchill Downs[100], Dover [100], Tractor Supply[100], Virtu Financial[100], EQT [100], Microchip [100]
Best Midcap Stocks Year-to-Date:
Vistra Energy[88.16%], AppLovin [73.92%], ShockWave Medical[72.7%], EMCOR [62.16%], Constellation Energy[60.54%], Spotify [53.81%], Antero Resources[47.22%], Pure Storage[46.44%], Natera [45.72%], Wingstop [44.17%], CAVA [43.95%] Best Midcap Stocks This Week:
HashiCorp [36.92%], Hasbro [17.55%], Kirby [17.07%], Tandem Diabetes[16.86%], Ardagh Metal[14.9%], First Citizens[14.87%], Antero Resources[14%], Tyler Technologies[13.57%], Teradyne [13.48%], Wabtec [13.19%], Globe Life[13.19%] Best Midcap Stocks Daily:
Kirby [10.99%], HashiCorp [10.69%], First Citizens[9.80%], Tyler Technologies[9.32%], Ardagh Metal[8.82%], TransUnion [8.17%], Teradyne [8.15%], Carrier Global[7.19%], Antero Resources[6.20%], CACI [5.93%], United Rentals[5.45%]