
 Login Sign Up


| |||||
 |  | ||||

| 12Stocks.com Market Intelligence |
Best MidCap Stocks
|
| In a hurry? Mid Cap Stocks Lists: Performance Trends Table, Stock Charts
Sort midcap stocks: Daily, Weekly, Year-to-Date, Market Cap & Trends. Filter midcap stocks list by sector: Show all, Tech, Finance, Energy, Staples, Retail, Industrial, Materials, Utilities and HealthCare Filter midcap stocks list by size:All MidCap Large Mid-Range Small |
| 12Stocks.com Mid Cap Stocks Performances & Trends Daily | |||||||||
|
|  The overall Smart Investing & Trading Score is 63 (0-bearish to 100-bullish) which puts Mid Cap index in short term neutral to bullish trend. The Smart Investing & Trading Score from previous trading session is 44 and hence an improvement of trend.
| ||||||||
Here are the Smart Investing & Trading Scores of the most requested mid cap stocks at 12Stocks.com (click stock name for detailed review):
|


| 12Stocks.com: Top Performing Mid Cap Index Stocks | ||||||||||||||||||||||||||||||||||||||||||||||||
 The top performing Mid Cap Index stocks year to date are
Now, more recently, over last week, the top performing Mid Cap Index stocks on the move are


|
||||||||||||||||||||||||||||||||||||||||||||||||
| 12Stocks.com: Investing in Midcap Index with Stocks | |
|
The following table helps investors and traders sort through current performance and trends (as measured by Smart Investing & Trading Score) of various
stocks in the Midcap Index. Quick View: Move mouse or cursor over stock symbol (ticker) to view short-term technical chart and over stock name to view long term chart. Click on  to add stock symbol to your watchlist and to add stock symbol to your watchlist and  to view watchlist. Click on any ticker or stock name for detailed market intelligence report for that stock. to view watchlist. Click on any ticker or stock name for detailed market intelligence report for that stock. |
12Stocks.com Performance of Stocks in Midcap Index
| Ticker | Stock Name | Watchlist | Category | Recent Price | Smart Investing & Trading Score | Change % | YTD Change% |
| JLL | Jones Lang |   | Financials | 179.02 | 58 | 2.23 | -5.22% |
| RL | Ralph Lauren | | Consumer Staples | 161.97 | 58 | 2.22 | 12.32% |
| LNC | Loln National | | Financials | 28.26 | 68 | 2.21 | 4.78% |
| SNV | Synovus Financial | | Financials | 35.68 | 22 | 2.21 | -5.23% |
| KIM | Kimco Realty | | Financials | 18.60 | 57 | 2.20 | -12.72% |
| HIW | Highwoods Properties | | Financials | 24.71 | 76 | 2.19 | 7.62% |
| EWBC | East West | | Financials | 74.47 | 75 | 2.18 | 3.50% |
| RCL | Royal Caribbean | | Services & Goods | 131.99 | 65 | 2.15 | 1.93% |
| WU | Western Union | | Financials | 13.30 | 75 | 2.15 | 11.58% |
| WAL | Western Alliance | | Financials | 58.67 | 54 | 2.14 | -10.82% |
| QRVO | Qorvo | | Technology | 107.12 | 48 | 2.14 | -4.88% |
| PSTG | Pure Storage | | Technology | 50.51 | 41 | 2.12 | 41.64% |
| WING | Wingstop | | Services & Goods | 354.75 | 63 | 2.12 | 38.26% |
| SOFI | SoFi Technologies | | Financials | 7.26 | 35 | 2.11 | -26.29% |
| S | SentinelOne | | Technology | 20.47 | 28 | 2.09 | -25.40% |
| CPB | Campbell Soup | | Consumer Staples | 45.12 | 100 | 2.08 | 4.37% |
| SWKS | Skyworks Solutions | | Technology | 98.11 | 25 | 2.08 | -12.73% |
| TRIP | TripAdvisor | | Technology | 25.56 | 56 | 2.08 | 18.72% |
| SRCL | Stericycle | | Industrials | 50.94 | 65 | 2.06 | 2.78% |
| WTFC | Wintrust Financial | | Financials | 99.30 | 75 | 2.05 | 7.06% |
| CMA | Comerica | | Financials | 52.61 | 80 | 2.04 | -5.73% |
| LAMR | Lamar Advertising | | Financials | 113.71 | 75 | 2.04 | 6.99% |
| CPNG | Coupang | | Services & Goods | 22.46 | 76 | 2.04 | 38.64% |
| FIVN | Five9 | | Technology | 58.25 | 42 | 2.03 | -25.98% |
| DRVN | Driven | | Services & Goods | 14.40 | 46 | 2.02 | 0.28% |
| For chart view version of above stock list: Chart View ➞ 0 - 25 , 25 - 50 , 50 - 75 , 75 - 100 , 100 - 125 , 125 - 150 , 150 - 175 , 175 - 200 , 200 - 225 , 225 - 250 , 250 - 275 , 275 - 300 , 300 - 325 , 325 - 350 , 350 - 375 , 375 - 400 , 400 - 425 , 425 - 450 , 450 - 475 , 475 - 500 , 500 - 525 , 525 - 550 , 550 - 575 , 575 - 600 , 600 - 625 , 625 - 650 , 650 - 675 , 675 - 700 , 700 - 725 , 725 - 750 , 750 - 775 | ||
 | Click To Change The Sort Order: By Market Cap or Company Size Performance: Year-to-date, Week and Day |  |
|
Get the most comprehensive stock market coverage daily at 12Stocks.com ➞ Best Stocks Today ➞ Best Stocks Weekly ➞ Best Stocks Year-to-Date ➞ Best Stocks Trends ➞  Best Stocks Today 12Stocks.com Best Nasdaq Stocks ➞ Best S&P 500 Stocks ➞ Best Tech Stocks ➞ Best Biotech Stocks ➞ |
| Detailed Overview of Midcap Stocks |
| Midcap Technical Overview, Leaders & Laggards, Top Midcap ETF Funds & Detailed Midcap Stocks List, Charts, Trends & More |
| Midcap: Technical Analysis, Trends & YTD Performance | |
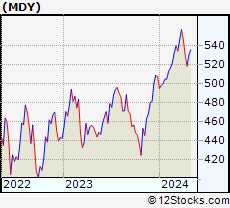
| MidCap segment as represented by
MDY, an exchange-traded fund [ETF], holds basket of about four hundred midcap stocks from across all major sectors of the US stock market. The midcap index (contains stocks like Green Mountain Coffee Roasters and Tractor Supply Company) is up by 3.18% and is currently underperforming the overall market by -1.21% year-to-date. Below is a quick view of technical charts and trends: | |
 MDY Weekly Chart |
|
| Long Term Trend: Good | |
| Medium Term Trend: Not Good | |
 MDY Daily Chart |
|
| Short Term Trend: Very Good | |
| Overall Trend Score: 63 | |
| YTD Performance: 3.18% | |
| **Trend Scores & Views Are Only For Educational Purposes And Not For Investing | |
| 12Stocks.com: Investing in Midcap Index using Exchange Traded Funds | |
|
The following table shows list of key exchange traded funds (ETF) that
help investors track Midcap index. The following list also includes leveraged ETF funds that track twice or thrice the daily returns of Midcap indices. Short or inverse ETF funds move in the opposite direction to the index they track and are useful during market pullbacks or during bear markets. Quick View: Move mouse or cursor over ETF symbol (ticker) to view short-term technical chart and over ETF name to view long term chart. Click on ticker or stock name for detailed view. Click on to add stock symbol to your watchlist and to view watchlist. |
12Stocks.com List of ETFs that track Midcap Index
| Ticker | ETF Name | Watchlist | Recent Price | Smart Investing & Trading Score | Change % | Week % | Year-to-date % |
| IWS | iShares Russell Mid-Cap Value | | 118.80 | 68 | 0.98 | 0.98 | 2.16% |
| IWP | iShares Russell Mid-Cap Growth | | 106.71 | 51 | 0.96 | 0.96 | 2.15% |
| IWR | iShares Russell Mid-Cap | | 79.38 | 56 | 0.92 | 0.92 | 2.12% |
| IJH | iShares Core S&P Mid-Cap | | 56.81 | 56 | 0.42 | 0.42 | 2.5% |
| MDY | SPDR S&P MidCap 400 ETF | | 523.50 | 63 | 1.01 | 1.01 | 3.18% |
| IJK | iShares S&P Mid-Cap 400 Growth | | 85.58 | 56 | 0.86 | 0.86 | 8.03% |
| IJJ | iShares S&P Mid-Cap 400 Value | | 111.54 | 63 | 0.90 | 0.9 | -2.19% |
| MYY | ProShares Short MidCap400 | | 20.97 | 32 | -1.04 | -1.04 | -2.26% |
| XMLV | PowerShares S&P MidCap Low Volatil ETF | | 54.54 | 75 | 0.70 | 0.7 | 2.56% |
| MZZ | ProShares UltraShort MidCap400 | | 11.96 | 27 | -1.73 | -1.73 | -4.86% |
| SMDD | ProShares UltraPro Short MidCap400 | | 12.11 | 32 | -3.60 | -3.6 | -10.05% |
| UMDD | ProShares UltraPro MidCap400 | | 23.17 | 63 | 2.69 | 2.69 | 3.81% |
| MVV | ProShares Ultra MidCap400 | | 60.29 | 63 | 2.19 | 2.19 | 4.15% |
| 12Stocks.com: Charts, Trends, Fundamental Data and Performances of MidCap Stocks | |
|
We now take in-depth look at all MidCap stocks including charts, multi-period performances and overall trends (as measured by Smart Investing & Trading Score). One can sort MidCap stocks (click link to choose) by Daily, Weekly and by Year-to-Date performances. Also, one can sort by size of the company or by market capitalization. |
| Select Your Default Chart Type: | |||||
| |||||
| Click on stock symbol or name for detailed view. Click on to add stock symbol to your watchlist and to view watchlist. Quick View: Move mouse or cursor over "Daily" to quickly view daily technical stock chart and over "Weekly" to view weekly technical stock chart. | |||||

 | JLL Jones Lang LaSalle Incorporated |
| Sector: Financials | |
| SubSector: Property Management | |
| MarketCap: 5259.32 Millions | |
| Recent Price: 179.02 Smart Investing & Trading Score: 58 | |
| Day Percent Change: 2.23% Day Change: 3.91 | |
| Week Change: 2.23% Year-to-date Change: -5.2% | |
| JLL Links: Profile News Message Board | |
| Charts:- Daily , Weekly | |
| Add JLL to Watchlist: View: Get Complete JLL Trend Analysis ➞ | |
 | RL Ralph Lauren Corporation |
| Sector: Consumer Staples | |
| SubSector: Textile - Apparel Clothing | |
| MarketCap: 5589.95 Millions | |
| Recent Price: 161.97 Smart Investing & Trading Score: 58 | |
| Day Percent Change: 2.22% Day Change: 3.51 | |
| Week Change: 2.22% Year-to-date Change: 12.3% | |
| RL Links: Profile News Message Board | |
| Charts:- Daily , Weekly | |
| Add RL to Watchlist: View: Get Complete RL Trend Analysis ➞ | |
 | LNC Lincoln National Corporation |
| Sector: Financials | |
| SubSector: Life Insurance | |
| MarketCap: 4545.26 Millions | |
| Recent Price: 28.26 Smart Investing & Trading Score: 68 | |
| Day Percent Change: 2.21% Day Change: 0.61 | |
| Week Change: 2.21% Year-to-date Change: 4.8% | |
| LNC Links: Profile News Message Board | |
| Charts:- Daily , Weekly | |
| Add LNC to Watchlist: View: Get Complete LNC Trend Analysis ➞ | |
 | SNV Synovus Financial Corp. |
| Sector: Financials | |
| SubSector: Regional - Mid-Atlantic Banks | |
| MarketCap: 2697.29 Millions | |
| Recent Price: 35.68 Smart Investing & Trading Score: 22 | |
| Day Percent Change: 2.21% Day Change: 0.77 | |
| Week Change: 2.21% Year-to-date Change: -5.2% | |
| SNV Links: Profile News Message Board | |
| Charts:- Daily , Weekly | |
| Add SNV to Watchlist: View: Get Complete SNV Trend Analysis ➞ | |
 | KIM Kimco Realty Corporation |
| Sector: Financials | |
| SubSector: REIT - Retail | |
| MarketCap: 5358.64 Millions | |
| Recent Price: 18.60 Smart Investing & Trading Score: 57 | |
| Day Percent Change: 2.20% Day Change: 0.40 | |
| Week Change: 2.2% Year-to-date Change: -12.7% | |
| KIM Links: Profile News Message Board | |
| Charts:- Daily , Weekly | |
| Add KIM to Watchlist: View: Get Complete KIM Trend Analysis ➞ | |
 | HIW Highwoods Properties, Inc. |
| Sector: Financials | |
| SubSector: REIT - Office | |
| MarketCap: 3227.46 Millions | |
| Recent Price: 24.71 Smart Investing & Trading Score: 76 | |
| Day Percent Change: 2.19% Day Change: 0.53 | |
| Week Change: 2.19% Year-to-date Change: 7.6% | |
| HIW Links: Profile News Message Board | |
| Charts:- Daily , Weekly | |
| Add HIW to Watchlist: View: Get Complete HIW Trend Analysis ➞ | |
 | EWBC East West Bancorp, Inc. |
| Sector: Financials | |
| SubSector: Foreign Money Center Banks | |
| MarketCap: 4618.31 Millions | |
| Recent Price: 74.47 Smart Investing & Trading Score: 75 | |
| Day Percent Change: 2.18% Day Change: 1.59 | |
| Week Change: 2.18% Year-to-date Change: 3.5% | |
| EWBC Links: Profile News Message Board | |
| Charts:- Daily , Weekly | |
| Add EWBC to Watchlist: View: Get Complete EWBC Trend Analysis ➞ | |
 | RCL Royal Caribbean Cruises Ltd. |
| Sector: Services & Goods | |
| SubSector: Resorts & Casinos | |
| MarketCap: 7294.14 Millions | |
| Recent Price: 131.99 Smart Investing & Trading Score: 65 | |
| Day Percent Change: 2.15% Day Change: 2.78 | |
| Week Change: 2.15% Year-to-date Change: 1.9% | |
| RCL Links: Profile News Message Board | |
| Charts:- Daily , Weekly | |
| Add RCL to Watchlist: View: Get Complete RCL Trend Analysis ➞ | |
 | WU The Western Union Company |
| Sector: Financials | |
| SubSector: Credit Services | |
| MarketCap: 7974.48 Millions | |
| Recent Price: 13.30 Smart Investing & Trading Score: 75 | |
| Day Percent Change: 2.15% Day Change: 0.28 | |
| Week Change: 2.15% Year-to-date Change: 11.6% | |
| WU Links: Profile News Message Board | |
| Charts:- Daily , Weekly | |
| Add WU to Watchlist: View: Get Complete WU Trend Analysis ➞ | |
 | WAL Western Alliance Bancorporation |
| Sector: Financials | |
| SubSector: Regional - Pacific Banks | |
| MarketCap: 2980.09 Millions | |
| Recent Price: 58.67 Smart Investing & Trading Score: 54 | |
| Day Percent Change: 2.14% Day Change: 1.23 | |
| Week Change: 2.14% Year-to-date Change: -10.8% | |
| WAL Links: Profile News Message Board | |
| Charts:- Daily , Weekly | |
| Add WAL to Watchlist: View: Get Complete WAL Trend Analysis ➞ | |
 | QRVO Qorvo, Inc. |
| Sector: Technology | |
| SubSector: Semiconductor - Broad Line | |
| MarketCap: 9524.32 Millions | |
| Recent Price: 107.12 Smart Investing & Trading Score: 48 | |
| Day Percent Change: 2.14% Day Change: 2.24 | |
| Week Change: 2.14% Year-to-date Change: -4.9% | |
| QRVO Links: Profile News Message Board | |
| Charts:- Daily , Weekly | |
| Add QRVO to Watchlist: View: Get Complete QRVO Trend Analysis ➞ | |
 | PSTG Pure Storage, Inc. |
| Sector: Technology | |
| SubSector: Data Storage Devices | |
| MarketCap: 2993.99 Millions | |
| Recent Price: 50.51 Smart Investing & Trading Score: 41 | |
| Day Percent Change: 2.12% Day Change: 1.05 | |
| Week Change: 2.12% Year-to-date Change: 41.6% | |
| PSTG Links: Profile News Message Board | |
| Charts:- Daily , Weekly | |
| Add PSTG to Watchlist: View: Get Complete PSTG Trend Analysis ➞ | |
 | WING Wingstop Inc. |
| Sector: Services & Goods | |
| SubSector: Restaurants | |
| MarketCap: 1744.7 Millions | |
| Recent Price: 354.75 Smart Investing & Trading Score: 63 | |
| Day Percent Change: 2.12% Day Change: 7.38 | |
| Week Change: 2.12% Year-to-date Change: 38.3% | |
| WING Links: Profile News Message Board | |
| Charts:- Daily , Weekly | |
| Add WING to Watchlist: View: Get Complete WING Trend Analysis ➞ | |
 | SOFI SoFi Technologies, Inc. |
| Sector: Financials | |
| SubSector: Credit Services | |
| MarketCap: 7990 Millions | |
| Recent Price: 7.26 Smart Investing & Trading Score: 35 | |
| Day Percent Change: 2.11% Day Change: 0.15 | |
| Week Change: 2.11% Year-to-date Change: -26.3% | |
| SOFI Links: Profile News Message Board | |
| Charts:- Daily , Weekly | |
| Add SOFI to Watchlist: View: Get Complete SOFI Trend Analysis ➞ | |
 | S SentinelOne, Inc. |
| Sector: Technology | |
| SubSector: Software - Infrastructure | |
| MarketCap: 4420 Millions | |
| Recent Price: 20.47 Smart Investing & Trading Score: 28 | |
| Day Percent Change: 2.09% Day Change: 0.42 | |
| Week Change: 2.09% Year-to-date Change: -25.4% | |
| S Links: Profile News Message Board | |
| Charts:- Daily , Weekly | |
| Add S to Watchlist: View: Get Complete S Trend Analysis ➞ | |
 | CPB Campbell Soup Company |
| Sector: Consumer Staples | |
| SubSector: Processed & Packaged Goods | |
| MarketCap: 14468.8 Millions | |
| Recent Price: 45.12 Smart Investing & Trading Score: 100 | |
| Day Percent Change: 2.08% Day Change: 0.92 | |
| Week Change: 2.08% Year-to-date Change: 4.4% | |
| CPB Links: Profile News Message Board | |
| Charts:- Daily , Weekly | |
| Add CPB to Watchlist: View: Get Complete CPB Trend Analysis ➞ | |
 | SWKS Skyworks Solutions, Inc. |
| Sector: Technology | |
| SubSector: Semiconductor - Integrated Circuits | |
| MarketCap: 13981 Millions | |
| Recent Price: 98.11 Smart Investing & Trading Score: 25 | |
| Day Percent Change: 2.08% Day Change: 2.00 | |
| Week Change: 2.08% Year-to-date Change: -12.7% | |
| SWKS Links: Profile News Message Board | |
| Charts:- Daily , Weekly | |
| Add SWKS to Watchlist: View: Get Complete SWKS Trend Analysis ➞ | |
 | TRIP TripAdvisor, Inc. |
| Sector: Technology | |
| SubSector: Internet Information Providers | |
| MarketCap: 2633.9 Millions | |
| Recent Price: 25.56 Smart Investing & Trading Score: 56 | |
| Day Percent Change: 2.08% Day Change: 0.52 | |
| Week Change: 2.08% Year-to-date Change: 18.7% | |
| TRIP Links: Profile News Message Board | |
| Charts:- Daily , Weekly | |
| Add TRIP to Watchlist: View: Get Complete TRIP Trend Analysis ➞ | |
 | SRCL Stericycle, Inc. |
| Sector: Industrials | |
| SubSector: Waste Management | |
| MarketCap: 4285.78 Millions | |
| Recent Price: 50.94 Smart Investing & Trading Score: 65 | |
| Day Percent Change: 2.06% Day Change: 1.03 | |
| Week Change: 2.06% Year-to-date Change: 2.8% | |
| SRCL Links: Profile News Message Board | |
| Charts:- Daily , Weekly | |
| Add SRCL to Watchlist: View: Get Complete SRCL Trend Analysis ➞ | |
 | WTFC Wintrust Financial Corporation |
| Sector: Financials | |
| SubSector: Regional - Midwest Banks | |
| MarketCap: 1942.6 Millions | |
| Recent Price: 99.30 Smart Investing & Trading Score: 75 | |
| Day Percent Change: 2.05% Day Change: 1.99 | |
| Week Change: 2.05% Year-to-date Change: 7.1% | |
| WTFC Links: Profile News Message Board | |
| Charts:- Daily , Weekly | |
| Add WTFC to Watchlist: View: Get Complete WTFC Trend Analysis ➞ | |
 | CMA Comerica Incorporated |
| Sector: Financials | |
| SubSector: Money Center Banks | |
| MarketCap: 4449.49 Millions | |
| Recent Price: 52.61 Smart Investing & Trading Score: 80 | |
| Day Percent Change: 2.04% Day Change: 1.05 | |
| Week Change: 2.04% Year-to-date Change: -5.7% | |
| CMA Links: Profile News Message Board | |
| Charts:- Daily , Weekly | |
| Add CMA to Watchlist: View: Get Complete CMA Trend Analysis ➞ | |
 | LAMR Lamar Advertising Company (REIT) |
| Sector: Financials | |
| SubSector: REIT - Diversified | |
| MarketCap: 4838.33 Millions | |
| Recent Price: 113.71 Smart Investing & Trading Score: 75 | |
| Day Percent Change: 2.04% Day Change: 2.27 | |
| Week Change: 2.04% Year-to-date Change: 7.0% | |
| LAMR Links: Profile News Message Board | |
| Charts:- Daily , Weekly | |
| Add LAMR to Watchlist: View: Get Complete LAMR Trend Analysis ➞ | |
 | CPNG Coupang, Inc. |
| Sector: Services & Goods | |
| SubSector: Internet Retail | |
| MarketCap: 30840 Millions | |
| Recent Price: 22.46 Smart Investing & Trading Score: 76 | |
| Day Percent Change: 2.04% Day Change: 0.45 | |
| Week Change: 2.04% Year-to-date Change: 38.6% | |
| CPNG Links: Profile News Message Board | |
| Charts:- Daily , Weekly | |
| Add CPNG to Watchlist: View: Get Complete CPNG Trend Analysis ➞ | |
 | FIVN Five9, Inc. |
| Sector: Technology | |
| SubSector: Application Software | |
| MarketCap: 4253.62 Millions | |
| Recent Price: 58.25 Smart Investing & Trading Score: 42 | |
| Day Percent Change: 2.03% Day Change: 1.16 | |
| Week Change: 2.03% Year-to-date Change: -26.0% | |
| FIVN Links: Profile News Message Board | |
| Charts:- Daily , Weekly | |
| Add FIVN to Watchlist: View: Get Complete FIVN Trend Analysis ➞ | |
 | DRVN Driven Brands Holdings Inc. |
| Sector: Services & Goods | |
| SubSector: Auto & Truck Dealerships | |
| MarketCap: 4490 Millions | |
| Recent Price: 14.40 Smart Investing & Trading Score: 46 | |
| Day Percent Change: 2.02% Day Change: 0.29 | |
| Week Change: 2.02% Year-to-date Change: 0.3% | |
| DRVN Links: Profile News Message Board | |
| Charts:- Daily , Weekly | |
| Add DRVN to Watchlist: View: Get Complete DRVN Trend Analysis ➞ | |
| For tabular summary view of above stock list: Summary View ➞ 0 - 25 , 25 - 50 , 50 - 75 , 75 - 100 , 100 - 125 , 125 - 150 , 150 - 175 , 175 - 200 , 200 - 225 , 225 - 250 , 250 - 275 , 275 - 300 , 300 - 325 , 325 - 350 , 350 - 375 , 375 - 400 , 400 - 425 , 425 - 450 , 450 - 475 , 475 - 500 , 500 - 525 , 525 - 550 , 550 - 575 , 575 - 600 , 600 - 625 , 625 - 650 , 650 - 675 , 675 - 700 , 700 - 725 , 725 - 750 , 750 - 775 | ||
| Click To Change The Sort Order: By Market Cap or Company Size Performance: Year-to-date, Week and Day | |
| Select Chart Type: | ||
|
Best Stocks Today 12Stocks.com |
© 2024 12Stocks.com Terms & Conditions Privacy Contact Us
All Information Provided Only For Education And Not To Be Used For Investing or Trading. See Terms & Conditions


One More Thing ... Get Best Stocks Delivered Daily!
Never Ever Miss A Move With Our Top Ten Stocks Lists
Find Best Stocks In Any Market - Bull or Bear Market
Take A Peek At Our Top Ten Stocks Lists: Daily, Weekly, Year-to-Date & Top Trends
Find Best Stocks In Any Market - Bull or Bear Market
Take A Peek At Our Top Ten Stocks Lists: Daily, Weekly, Year-to-Date & Top Trends
Midcap Stocks With Best Up Trends [0-bearish to 100-bullish]: United Airlines[100], EQT [100], Wendy s[100], Bentley [100], Campbell Soup[100], Commerce Bancshares[100], Grocery Outlet[100], Ally Financial[100], Hanover Insurance[100], UDR [100], M&T Bank[100]
Best Midcap Stocks Year-to-Date:
Vistra Energy[73.21%], ShockWave Medical[72.44%], AppLovin [70.55%], Constellation Energy[56.45%], EMCOR [54.38%], Spotify [44.88%], Pure Storage[41.64%], Natera [41.46%], Williams-Sonoma [38.87%], Coupang [38.64%], Kinsale Capital[38.31%] Best Midcap Stocks This Week:
AMC Entertainment[8.23%], Coinbase Global[7.07%], Kohl s[6.51%], New York[5.76%], United Airlines[4.98%], Tandem Diabetes[4.37%], Crocs [4.02%], Ardagh Metal[4.01%], MongoDB [3.92%], Natera [3.9%], Enphase Energy[3.78%] Best Midcap Stocks Daily:
AMC Entertainment[8.23%], Coinbase Global[7.07%], Kohl s[6.51%], New York[5.76%], United Airlines[4.98%], Tandem Diabetes[4.37%], Crocs [4.02%], Ardagh Metal[4.01%], MongoDB [3.92%], Natera [3.90%], Enphase Energy[3.78%]