
 Login Sign Up


| |||||
 |  | ||||

| 12Stocks.com Market Intelligence |
Best MidCap Stocks
|
| In a hurry? Mid Cap Stocks Lists: Performance Trends Table, Stock Charts
Sort midcap stocks: Daily, Weekly, Year-to-Date, Market Cap & Trends. Filter midcap stocks list by sector: Show all, Tech, Finance, Energy, Staples, Retail, Industrial, Materials, Utilities and HealthCare Filter midcap stocks list by size:All MidCap Large Mid-Range Small |
| 12Stocks.com Mid Cap Stocks Performances & Trends Daily | |||||||||
|
|  The overall Smart Investing & Trading Score is 70 (0-bearish to 100-bullish) which puts Mid Cap index in short term neutral to bullish trend. The Smart Investing & Trading Score from previous trading session is 56 and hence an improvement of trend.
| ||||||||
Here are the Smart Investing & Trading Scores of the most requested mid cap stocks at 12Stocks.com (click stock name for detailed review):
|


| 12Stocks.com: Top Performing Mid Cap Index Stocks | ||||||||||||||||||||||||||||||||||||||||||||||||
 The top performing Mid Cap Index stocks year to date are
Now, more recently, over last week, the top performing Mid Cap Index stocks on the move are


|
||||||||||||||||||||||||||||||||||||||||||||||||
| 12Stocks.com: Investing in Midcap Index with Stocks | |
|
The following table helps investors and traders sort through current performance and trends (as measured by Smart Investing & Trading Score) of various
stocks in the Midcap Index. Quick View: Move mouse or cursor over stock symbol (ticker) to view short-term technical chart and over stock name to view long term chart. Click on  to add stock symbol to your watchlist and to add stock symbol to your watchlist and  to view watchlist. Click on any ticker or stock name for detailed market intelligence report for that stock. to view watchlist. Click on any ticker or stock name for detailed market intelligence report for that stock. |
12Stocks.com Performance of Stocks in Midcap Index
| Ticker | Stock Name | Watchlist | Category | Recent Price | Smart Investing & Trading Score | Change % | Weekly Change% |
| HAL | Halliburton |   | Energy | 38.49 | 61 | -0.12% | -0.12% |
| AR | Antero Resources | | Energy | 33.76 | 100 | -0.12% | -0.12% |
| CTRA | Contura Energy | | Materials | 28.25 | 83 | -0.12% | -0.12% |
| RYN | Rayonier | | Industrials | 30.12 | 38 | -0.13% | -0.13% |
| GNRC | Generac | | Industrials | 139.92 | 88 | -0.14% | -0.14% |
| WU | Western Union | | Financials | 13.45 | 68 | -0.15% | -0.15% |
| YUM | Yum! | | Services & Goods | 141.54 | 78 | -0.16% | -0.16% |
| CHD | Church & Dwight Co | | Consumer Staples | 106.16 | 63 | -0.16% | -0.16% |
| PTC | PTC | | Technology | 180.69 | 45 | -0.16% | -0.16% |
| ROL | Rollins | | Services & Goods | 44.83 | 90 | -0.16% | -0.16% |
| TTD | Trade Desk | | Technology | 84.59 | 63 | -0.17% | -0.17% |
| SWAV | ShockWave Medical | | Health Care | 329.40 | 75 | -0.18% | -0.18% |
| SSRM | SSR Mining | | Materials | 5.56 | 57 | -0.18% | -0.18% |
| PH | Parker-Hannifin | | Industrials | 552.60 | 71 | -0.19% | -0.19% |
| ICLR | ICON Public | | Health Care | 307.73 | 58 | -0.19% | -0.19% |
| OMC | Omnicom | | Services & Goods | 95.70 | 78 | -0.20% | -0.20% |
| RGLD | Royal Gold | | Materials | 124.33 | 88 | -0.20% | -0.20% |
| IEX | IDEX | | Industrials | 220.19 | 36 | -0.21% | -0.21% |
| EXPD | Expeditors | | Transports | 113.06 | 35 | -0.21% | -0.21% |
| XYL | Xylem | | Industrials | 132.12 | 90 | -0.21% | -0.21% |
| JHG | Janus Henderson | | Financials | 31.62 | 61 | -0.22% | -0.22% |
| WMB | Williams | | Energy | 39.17 | 73 | -0.23% | -0.23% |
| CFR | Cullen/Frost Bankers | | Financials | 106.83 | 30 | -0.23% | -0.23% |
| KSS | Kohl s | | Services & Goods | 24.47 | 49 | -0.24% | -0.24% |
| NCNO | nCino | | Technology | 29.44 | 20 | -0.24% | -0.24% |
| For chart view version of above stock list: Chart View ➞ 0 - 25 , 25 - 50 , 50 - 75 , 75 - 100 , 100 - 125 , 125 - 150 , 150 - 175 , 175 - 200 , 200 - 225 , 225 - 250 , 250 - 275 , 275 - 300 , 300 - 325 , 325 - 350 , 350 - 375 , 375 - 400 , 400 - 425 , 425 - 450 , 450 - 475 , 475 - 500 , 500 - 525 , 525 - 550 , 550 - 575 , 575 - 600 , 600 - 625 , 625 - 650 , 650 - 675 , 675 - 700 , 700 - 725 | ||
 | Click To Change The Sort Order: By Market Cap or Company Size Performance: Year-to-date, Week and Day |  |
|
Get the most comprehensive stock market coverage daily at 12Stocks.com ➞ Best Stocks Today ➞ Best Stocks Weekly ➞ Best Stocks Year-to-Date ➞ Best Stocks Trends ➞  Best Stocks Today 12Stocks.com Best Nasdaq Stocks ➞ Best S&P 500 Stocks ➞ Best Tech Stocks ➞ Best Biotech Stocks ➞ |
| Detailed Overview of Midcap Stocks |
| Midcap Technical Overview, Leaders & Laggards, Top Midcap ETF Funds & Detailed Midcap Stocks List, Charts, Trends & More |
| Midcap: Technical Analysis, Trends & YTD Performance | |
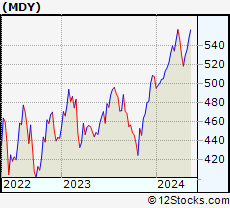
| MidCap segment as represented by
MDY, an exchange-traded fund [ETF], holds basket of about four hundred midcap stocks from across all major sectors of the US stock market. The midcap index (contains stocks like Green Mountain Coffee Roasters and Tractor Supply Company) is up by 4.92% and is currently underperforming the overall market by -1.58% year-to-date. Below is a quick view of technical charts and trends: | |
 MDY Weekly Chart |
|
| Long Term Trend: Very Good | |
| Medium Term Trend: Good | |
 MDY Daily Chart |
|
| Short Term Trend: Very Good | |
| Overall Trend Score: 70 | |
| YTD Performance: 4.92% | |
| **Trend Scores & Views Are Only For Educational Purposes And Not For Investing | |
| 12Stocks.com: Investing in Midcap Index using Exchange Traded Funds | |
|
The following table shows list of key exchange traded funds (ETF) that
help investors track Midcap index. The following list also includes leveraged ETF funds that track twice or thrice the daily returns of Midcap indices. Short or inverse ETF funds move in the opposite direction to the index they track and are useful during market pullbacks or during bear markets. Quick View: Move mouse or cursor over ETF symbol (ticker) to view short-term technical chart and over ETF name to view long term chart. Click on ticker or stock name for detailed view. Click on to add stock symbol to your watchlist and to view watchlist. |
12Stocks.com List of ETFs that track Midcap Index
| Ticker | ETF Name | Watchlist | Recent Price | Smart Investing & Trading Score | Change % | Week % | Year-to-date % |
| IWR | iShares Russell Mid-Cap | | 80.94 | 75 | 0.52 | 0.52 | 4.12% |
| IJH | iShares Core S&P Mid-Cap | | 58.08 | 75 | 0.44 | 0.44 | 4.77% |
| IWP | iShares Russell Mid-Cap Growth | | 109.38 | 78 | 0.37 | 0.37 | 4.71% |
| IWS | iShares Russell Mid-Cap Value | | 120.78 | 75 | 0.66 | 0.66 | 3.86% |
| MDY | SPDR S&P MidCap 400 ETF | | 532.34 | 70 | 0.56 | 0.56 | 4.92% |
| IJK | iShares S&P Mid-Cap 400 Growth | | 87.42 | 70 | 0.48 | 0.48 | 10.35% |
| IJJ | iShares S&P Mid-Cap 400 Value | | 113.04 | 88 | 0.72 | 0.72 | -0.88% |
| UMDD | ProShares UltraPro MidCap400 | | 24.34 | 78 | 1.59 | 1.59 | 9.05% |
| XMLV | PowerShares S&P MidCap Low Volatil ETF | | 54.95 | 83 | 0.54 | 0.54 | 3.32% |
| MYY | ProShares Short MidCap400 | | 20.64 | 25 | -0.72 | -0.72 | -3.8% |
| MZZ | ProShares UltraShort MidCap400 | | 11.67 | 27 | -0.09 | -0.09 | -7.17% |
| MVV | ProShares Ultra MidCap400 | | 62.18 | 83 | 1.22 | 1.22 | 7.41% |
| SMDD | ProShares UltraPro Short MidCap400 | | 11.65 | 10 | -1.52 | -1.52 | -13.47% |
| 12Stocks.com: Charts, Trends, Fundamental Data and Performances of MidCap Stocks | |
|
We now take in-depth look at all MidCap stocks including charts, multi-period performances and overall trends (as measured by Smart Investing & Trading Score). One can sort MidCap stocks (click link to choose) by Daily, Weekly and by Year-to-Date performances. Also, one can sort by size of the company or by market capitalization. |
| Select Your Default Chart Type: | |||||
| |||||
| Click on stock symbol or name for detailed view. Click on to add stock symbol to your watchlist and to view watchlist. Quick View: Move mouse or cursor over "Daily" to quickly view daily technical stock chart and over "Weekly" to view weekly technical stock chart. | |||||

 | HAL Halliburton Company |
| Sector: Energy | |
| SubSector: Oil & Gas Equipment & Services | |
| MarketCap: 5419.41 Millions | |
| Recent Price: 38.49 Smart Investing & Trading Score: 61 | |
| Day Percent Change: -0.12% Day Change: -0.05 | |
| Week Change: -0.12% Year-to-date Change: 6.5% | |
| HAL Links: Profile News Message Board | |
| Charts:- Daily , Weekly | |
| Add HAL to Watchlist: View: Get Complete HAL Trend Analysis ➞ | |
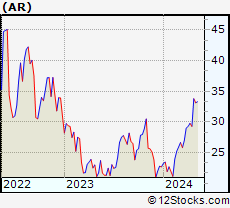 | AR Antero Resources Corporation |
| Sector: Energy | |
| SubSector: Oil & Gas Drilling & Exploration | |
| MarketCap: 256.939 Millions | |
| Recent Price: 33.76 Smart Investing & Trading Score: 100 | |
| Day Percent Change: -0.12% Day Change: -0.04 | |
| Week Change: -0.12% Year-to-date Change: 48.9% | |
| AR Links: Profile News Message Board | |
| Charts:- Daily , Weekly | |
| Add AR to Watchlist: View: Get Complete AR Trend Analysis ➞ | |
 | CTRA Contura Energy, Inc. |
| Sector: Materials | |
| SubSector: Industrial Metals & Minerals | |
| MarketCap: 75.291 Millions | |
| Recent Price: 28.25 Smart Investing & Trading Score: 83 | |
| Day Percent Change: -0.12% Day Change: -0.04 | |
| Week Change: -0.12% Year-to-date Change: 10.7% | |
| CTRA Links: Profile News Message Board | |
| Charts:- Daily , Weekly | |
| Add CTRA to Watchlist: View: Get Complete CTRA Trend Analysis ➞ | |
 | RYN Rayonier Inc. |
| Sector: Industrials | |
| SubSector: Lumber, Wood Production | |
| MarketCap: 3143 Millions | |
| Recent Price: 30.12 Smart Investing & Trading Score: 38 | |
| Day Percent Change: -0.13% Day Change: -0.04 | |
| Week Change: -0.13% Year-to-date Change: -9.9% | |
| RYN Links: Profile News Message Board | |
| Charts:- Daily , Weekly | |
| Add RYN to Watchlist: View: Get Complete RYN Trend Analysis ➞ | |
 | GNRC Generac Holdings Inc. |
| Sector: Industrials | |
| SubSector: Diversified Machinery | |
| MarketCap: 5736.26 Millions | |
| Recent Price: 139.92 Smart Investing & Trading Score: 88 | |
| Day Percent Change: -0.14% Day Change: -0.20 | |
| Week Change: -0.14% Year-to-date Change: 8.3% | |
| GNRC Links: Profile News Message Board | |
| Charts:- Daily , Weekly | |
| Add GNRC to Watchlist: View: Get Complete GNRC Trend Analysis ➞ | |
 | WU The Western Union Company |
| Sector: Financials | |
| SubSector: Credit Services | |
| MarketCap: 7974.48 Millions | |
| Recent Price: 13.45 Smart Investing & Trading Score: 68 | |
| Day Percent Change: -0.15% Day Change: -0.02 | |
| Week Change: -0.15% Year-to-date Change: 12.8% | |
| WU Links: Profile News Message Board | |
| Charts:- Daily , Weekly | |
| Add WU to Watchlist: View: Get Complete WU Trend Analysis ➞ | |
 | YUM Yum! Brands, Inc. |
| Sector: Services & Goods | |
| SubSector: Restaurants | |
| MarketCap: 18033.3 Millions | |
| Recent Price: 141.54 Smart Investing & Trading Score: 78 | |
| Day Percent Change: -0.16% Day Change: -0.23 | |
| Week Change: -0.16% Year-to-date Change: 8.3% | |
| YUM Links: Profile News Message Board | |
| Charts:- Daily , Weekly | |
| Add YUM to Watchlist: View: Get Complete YUM Trend Analysis ➞ | |
 | CHD Church & Dwight Co., Inc. |
| Sector: Consumer Staples | |
| SubSector: Cleaning Products | |
| MarketCap: 17425.7 Millions | |
| Recent Price: 106.16 Smart Investing & Trading Score: 63 | |
| Day Percent Change: -0.16% Day Change: -0.16 | |
| Week Change: -0.16% Year-to-date Change: 12.3% | |
| CHD Links: Profile News Message Board | |
| Charts:- Daily , Weekly | |
| Add CHD to Watchlist: View: Get Complete CHD Trend Analysis ➞ | |
 | PTC PTC Inc. |
| Sector: Technology | |
| SubSector: Technical & System Software | |
| MarketCap: 6166.7 Millions | |
| Recent Price: 180.69 Smart Investing & Trading Score: 45 | |
| Day Percent Change: -0.16% Day Change: -0.30 | |
| Week Change: -0.16% Year-to-date Change: 3.3% | |
| PTC Links: Profile News Message Board | |
| Charts:- Daily , Weekly | |
| Add PTC to Watchlist: View: Get Complete PTC Trend Analysis ➞ | |
 | ROL Rollins, Inc. |
| Sector: Services & Goods | |
| SubSector: Business Services | |
| MarketCap: 12827.4 Millions | |
| Recent Price: 44.83 Smart Investing & Trading Score: 90 | |
| Day Percent Change: -0.16% Day Change: -0.07 | |
| Week Change: -0.16% Year-to-date Change: 2.7% | |
| ROL Links: Profile News Message Board | |
| Charts:- Daily , Weekly | |
| Add ROL to Watchlist: View: Get Complete ROL Trend Analysis ➞ | |
 | TTD The Trade Desk, Inc. |
| Sector: Technology | |
| SubSector: Application Software | |
| MarketCap: 9006.92 Millions | |
| Recent Price: 84.59 Smart Investing & Trading Score: 63 | |
| Day Percent Change: -0.17% Day Change: -0.14 | |
| Week Change: -0.17% Year-to-date Change: 17.6% | |
| TTD Links: Profile News Message Board | |
| Charts:- Daily , Weekly | |
| Add TTD to Watchlist: View: Get Complete TTD Trend Analysis ➞ | |
 | SWAV ShockWave Medical, Inc. |
| Sector: Health Care | |
| SubSector: Medical Appliances & Equipment | |
| MarketCap: 855.58 Millions | |
| Recent Price: 329.40 Smart Investing & Trading Score: 75 | |
| Day Percent Change: -0.18% Day Change: -0.60 | |
| Week Change: -0.18% Year-to-date Change: 72.9% | |
| SWAV Links: Profile News Message Board | |
| Charts:- Daily , Weekly | |
| Add SWAV to Watchlist: View: Get Complete SWAV Trend Analysis ➞ | |
 | SSRM SSR Mining Inc. |
| Sector: Materials | |
| SubSector: Gold | |
| MarketCap: 1546.09 Millions | |
| Recent Price: 5.56 Smart Investing & Trading Score: 57 | |
| Day Percent Change: -0.18% Day Change: -0.01 | |
| Week Change: -0.18% Year-to-date Change: -48.3% | |
| SSRM Links: Profile News Message Board | |
| Charts:- Daily , Weekly | |
| Add SSRM to Watchlist: View: Get Complete SSRM Trend Analysis ➞ | |
 | PH Parker-Hannifin Corporation |
| Sector: Industrials | |
| SubSector: Industrial Equipment & Components | |
| MarketCap: 14888.9 Millions | |
| Recent Price: 552.60 Smart Investing & Trading Score: 71 | |
| Day Percent Change: -0.19% Day Change: -1.04 | |
| Week Change: -0.19% Year-to-date Change: 20.0% | |
| PH Links: Profile News Message Board | |
| Charts:- Daily , Weekly | |
| Add PH to Watchlist: View: Get Complete PH Trend Analysis ➞ | |
 | ICLR ICON Public Limited Company |
| Sector: Health Care | |
| SubSector: Medical Laboratories & Research | |
| MarketCap: 7011 Millions | |
| Recent Price: 307.73 Smart Investing & Trading Score: 58 | |
| Day Percent Change: -0.19% Day Change: -0.58 | |
| Week Change: -0.19% Year-to-date Change: 8.7% | |
| ICLR Links: Profile News Message Board | |
| Charts:- Daily , Weekly | |
| Add ICLR to Watchlist: View: Get Complete ICLR Trend Analysis ➞ | |
 | OMC Omnicom Group Inc. |
| Sector: Services & Goods | |
| SubSector: Advertising Agencies | |
| MarketCap: 11813.5 Millions | |
| Recent Price: 95.70 Smart Investing & Trading Score: 78 | |
| Day Percent Change: -0.20% Day Change: -0.19 | |
| Week Change: -0.2% Year-to-date Change: 10.6% | |
| OMC Links: Profile News Message Board | |
| Charts:- Daily , Weekly | |
| Add OMC to Watchlist: View: Get Complete OMC Trend Analysis ➞ | |
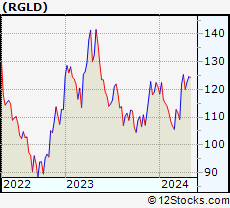 | RGLD Royal Gold, Inc. |
| Sector: Materials | |
| SubSector: Gold | |
| MarketCap: 5110.09 Millions | |
| Recent Price: 124.33 Smart Investing & Trading Score: 88 | |
| Day Percent Change: -0.20% Day Change: -0.25 | |
| Week Change: -0.2% Year-to-date Change: 2.8% | |
| RGLD Links: Profile News Message Board | |
| Charts:- Daily , Weekly | |
| Add RGLD to Watchlist: View: Get Complete RGLD Trend Analysis ➞ | |
 | IEX IDEX Corporation |
| Sector: Industrials | |
| SubSector: Diversified Machinery | |
| MarketCap: 9721.46 Millions | |
| Recent Price: 220.19 Smart Investing & Trading Score: 36 | |
| Day Percent Change: -0.21% Day Change: -0.47 | |
| Week Change: -0.21% Year-to-date Change: 1.4% | |
| IEX Links: Profile News Message Board | |
| Charts:- Daily , Weekly | |
| Add IEX to Watchlist: View: Get Complete IEX Trend Analysis ➞ | |
 | EXPD Expeditors International of Washington, Inc. |
| Sector: Transports | |
| SubSector: Air Delivery & Freight Services | |
| MarketCap: 10129.8 Millions | |
| Recent Price: 113.06 Smart Investing & Trading Score: 35 | |
| Day Percent Change: -0.21% Day Change: -0.24 | |
| Week Change: -0.21% Year-to-date Change: -11.1% | |
| EXPD Links: Profile News Message Board | |
| Charts:- Daily , Weekly | |
| Add EXPD to Watchlist: View: Get Complete EXPD Trend Analysis ➞ | |
 | XYL Xylem Inc. |
| Sector: Industrials | |
| SubSector: Diversified Machinery | |
| MarketCap: 12195.1 Millions | |
| Recent Price: 132.12 Smart Investing & Trading Score: 90 | |
| Day Percent Change: -0.21% Day Change: -0.28 | |
| Week Change: -0.21% Year-to-date Change: 15.5% | |
| XYL Links: Profile News Message Board | |
| Charts:- Daily , Weekly | |
| Add XYL to Watchlist: View: Get Complete XYL Trend Analysis ➞ | |
 | JHG Janus Henderson Group plc |
| Sector: Financials | |
| SubSector: Asset Management | |
| MarketCap: 2992.33 Millions | |
| Recent Price: 31.62 Smart Investing & Trading Score: 61 | |
| Day Percent Change: -0.22% Day Change: -0.07 | |
| Week Change: -0.22% Year-to-date Change: 4.9% | |
| JHG Links: Profile News Message Board | |
| Charts:- Daily , Weekly | |
| Add JHG to Watchlist: View: Get Complete JHG Trend Analysis ➞ | |
 | WMB The Williams Companies, Inc. |
| Sector: Energy | |
| SubSector: Oil & Gas Pipelines | |
| MarketCap: 16851.5 Millions | |
| Recent Price: 39.17 Smart Investing & Trading Score: 73 | |
| Day Percent Change: -0.23% Day Change: -0.09 | |
| Week Change: -0.23% Year-to-date Change: 12.5% | |
| WMB Links: Profile News Message Board | |
| Charts:- Daily , Weekly | |
| Add WMB to Watchlist: View: Get Complete WMB Trend Analysis ➞ | |
 | CFR Cullen/Frost Bankers, Inc. |
| Sector: Financials | |
| SubSector: Regional - Southwest Banks | |
| MarketCap: 3536.75 Millions | |
| Recent Price: 106.83 Smart Investing & Trading Score: 30 | |
| Day Percent Change: -0.23% Day Change: -0.25 | |
| Week Change: -0.23% Year-to-date Change: -1.5% | |
| CFR Links: Profile News Message Board | |
| Charts:- Daily , Weekly | |
| Add CFR to Watchlist: View: Get Complete CFR Trend Analysis ➞ | |
 | KSS Kohl s Corporation |
| Sector: Services & Goods | |
| SubSector: Department Stores | |
| MarketCap: 3068 Millions | |
| Recent Price: 24.47 Smart Investing & Trading Score: 49 | |
| Day Percent Change: -0.24% Day Change: -0.06 | |
| Week Change: -0.24% Year-to-date Change: -14.7% | |
| KSS Links: Profile News Message Board | |
| Charts:- Daily , Weekly | |
| Add KSS to Watchlist: View: Get Complete KSS Trend Analysis ➞ | |
 | NCNO nCino, Inc. |
| Sector: Technology | |
| SubSector: Software Application | |
| MarketCap: 74187 Millions | |
| Recent Price: 29.44 Smart Investing & Trading Score: 20 | |
| Day Percent Change: -0.24% Day Change: -0.07 | |
| Week Change: -0.24% Year-to-date Change: -12.5% | |
| NCNO Links: Profile News Message Board | |
| Charts:- Daily , Weekly | |
| Add NCNO to Watchlist: View: Get Complete NCNO Trend Analysis ➞ | |
| For tabular summary view of above stock list: Summary View ➞ 0 - 25 , 25 - 50 , 50 - 75 , 75 - 100 , 100 - 125 , 125 - 150 , 150 - 175 , 175 - 200 , 200 - 225 , 225 - 250 , 250 - 275 , 275 - 300 , 300 - 325 , 325 - 350 , 350 - 375 , 375 - 400 , 400 - 425 , 425 - 450 , 450 - 475 , 475 - 500 , 500 - 525 , 525 - 550 , 550 - 575 , 575 - 600 , 600 - 625 , 625 - 650 , 650 - 675 , 675 - 700 , 700 - 725 | ||
| Click To Change The Sort Order: By Market Cap or Company Size Performance: Year-to-date, Week and Day | |
| Select Chart Type: | ||
|
Best Stocks Today 12Stocks.com |
© 2024 12Stocks.com Terms & Conditions Privacy Contact Us
All Information Provided Only For Education And Not To Be Used For Investing or Trading. See Terms & Conditions


One More Thing ... Get Best Stocks Delivered Daily!
Never Ever Miss A Move With Our Top Ten Stocks Lists
Find Best Stocks In Any Market - Bull or Bear Market
Take A Peek At Our Top Ten Stocks Lists: Daily, Weekly, Year-to-Date & Top Trends
Find Best Stocks In Any Market - Bull or Bear Market
Take A Peek At Our Top Ten Stocks Lists: Daily, Weekly, Year-to-Date & Top Trends
Midcap Stocks With Best Up Trends [0-bearish to 100-bullish]: Tandem Diabetes[100], Albemarle [100], Quest Diagnostics[100], Domino s[100], Lazard [100], Aptar [100], LPL Financial[100], Cognex [100], United [100], Owens Corning[100], Highwoods Properties[100]
Best Midcap Stocks Year-to-Date:
Vistra Energy[98.34%], ShockWave Medical[72.86%], EMCOR [66.11%], Spotify [51.73%], Wingstop [50.21%], Natera [49.38%], Antero Resources[48.85%], Pure Storage[47.67%], NRG Energy[43.17%], Interactive Brokers[41.47%], Williams-Sonoma [40.87%] Best Midcap Stocks This Week:
Tandem Diabetes[7.07%], Sunrun [6.46%], Hertz Global[6.45%], Albemarle [6.36%], Liberty SiriusXM[5.31%], Petco Health[5.3%], Liberty SiriusXM[5.21%], Quest Diagnostics[5.18%], Vistra Energy[5.09%], Sirius XM[4.97%], Biogen [4.61%] Best Midcap Stocks Daily:
Tandem Diabetes[7.07%], Sunrun [6.46%], Hertz Global[6.45%], Albemarle [6.36%], Liberty SiriusXM[5.31%], Petco Health[5.30%], Liberty SiriusXM[5.21%], Quest Diagnostics[5.18%], Vistra Energy[5.09%], Sirius XM[4.97%], Biogen [4.61%]