
 Login Sign Up


| |||||
 |  | ||||

| 12Stocks.com Market Intelligence |
Best MidCap Stocks
|
| In a hurry? Mid Cap Stocks Lists: Performance Trends Table, Stock Charts
Sort midcap stocks: Daily, Weekly, Year-to-Date, Market Cap & Trends. Filter midcap stocks list by sector: Show all, Tech, Finance, Energy, Staples, Retail, Industrial, Materials, Utilities and HealthCare Filter midcap stocks list by size:All MidCap Large Mid-Range Small |
| 12Stocks.com Mid Cap Stocks Performances & Trends Daily | |||||||||
|
|  The overall Smart Investing & Trading Score is 63 (0-bearish to 100-bullish) which puts Mid Cap index in short term neutral to bullish trend. The Smart Investing & Trading Score from previous trading session is 44 and an improvement of trend continues.
| ||||||||
Here are the Smart Investing & Trading Scores of the most requested mid cap stocks at 12Stocks.com (click stock name for detailed review):
|


| 12Stocks.com: Top Performing Mid Cap Index Stocks | ||||||||||||||||||||||||||||||||||||||||||||||||
 The top performing Mid Cap Index stocks year to date are
Now, more recently, over last week, the top performing Mid Cap Index stocks on the move are


|
||||||||||||||||||||||||||||||||||||||||||||||||
| 12Stocks.com: Investing in Midcap Index with Stocks | |
|
The following table helps investors and traders sort through current performance and trends (as measured by Smart Investing & Trading Score) of various
stocks in the Midcap Index. Quick View: Move mouse or cursor over stock symbol (ticker) to view short-term technical chart and over stock name to view long term chart. Click on  to add stock symbol to your watchlist and to add stock symbol to your watchlist and  to view watchlist. Click on any ticker or stock name for detailed market intelligence report for that stock. to view watchlist. Click on any ticker or stock name for detailed market intelligence report for that stock. |
12Stocks.com Performance of Stocks in Midcap Index
| Ticker | Stock Name | Watchlist | Category | Recent Price | Smart Investing & Trading Score | Change % | Weekly Change% |
| DRI | Darden Restaurants |   | Services & Goods | 155.90 | 57 | 0.87% | 2.23% |
| GNTX | Gentex | | Consumer Staples | 34.66 | 65 | 1.20% | 2.21% |
| AWI | Armstrong World | | Industrials | 116.50 | 63 | 1.57% | 2.21% |
| TFX | Teleflex | | Health Care | 211.11 | 42 | 1.85% | 2.20% |
| LSCC | Lattice Semiconductor | | Technology | 67.97 | 43 | 2.86% | 2.20% |
| NRG | NRG Energy | | Utilities | 71.49 | 68 | 1.56% | 2.17% |
| AOS | A. O. | | Industrials | 87.92 | 83 | 1.17% | 2.15% |
| MAN | Manpower | | Services & Goods | 76.44 | 100 | 1.04% | 2.14% |
| GRMN | Garmin | | Technology | 142.51 | 63 | 1.06% | 2.14% |
| CAG | Conagra | | Consumer Staples | 31.27 | 93 | 0.55% | 2.12% |
| TXT | Textron | | Industrials | 95.28 | 75 | 1.61% | 2.12% |
| CARR | Carrier Global | | Industrials | 55.14 | 45 | 2.83% | 2.11% |
| WSM | Williams-Sonoma | | Services & Goods | 285.07 | 68 | 1.73% | 2.10% |
| ESAB | ESAB | | Industrials | 108.25 | 56 | 2.90% | 2.10% |
| CMA | Comerica | | Financials | 52.64 | 72 | 0.06% | 2.09% |
| BHF | Brighthouse Financial | | Financials | 49.90 | 59 | 1.53% | 2.09% |
| DBX | Dropbox | | Technology | 23.47 | 64 | 0.69% | 2.09% |
| ICUI | ICU Medical | | Health Care | 97.76 | 68 | 1.43% | 2.08% |
| INSP | Inspire Medical | | Technology | 233.93 | 63 | 3.87% | 2.05% |
| PCOR | Procore Technologies | | Technology | 71.73 | 38 | 1.63% | 2.05% |
| BK | Bank of New York | | Financials | 57.44 | 95 | 0.49% | 2.04% |
| MDU | MDU Resources | | Industrials | 24.50 | 75 | 1.37% | 2.04% |
| IRM | Iron Mountain | | Technology | 76.60 | 70 | 0.99% | 2.00% |
| SUI | Sun Communities | | Financials | 120.04 | 52 | 1.48% | 2.00% |
| CDW | CDW | | Technology | 240.47 | 58 | 1.19% | 1.99% |
| For chart view version of above stock list: Chart View ➞ 0 - 25 , 25 - 50 , 50 - 75 , 75 - 100 , 100 - 125 , 125 - 150 , 150 - 175 , 175 - 200 , 200 - 225 , 225 - 250 , 250 - 275 , 275 - 300 , 300 - 325 , 325 - 350 , 350 - 375 , 375 - 400 , 400 - 425 , 425 - 450 , 450 - 475 , 475 - 500 , 500 - 525 , 525 - 550 , 550 - 575 , 575 - 600 , 600 - 625 , 625 - 650 , 650 - 675 , 675 - 700 , 700 - 725 , 725 - 750 , 750 - 775 | ||
 | Click To Change The Sort Order: By Market Cap or Company Size Performance: Year-to-date, Week and Day |  |
|
Get the most comprehensive stock market coverage daily at 12Stocks.com ➞ Best Stocks Today ➞ Best Stocks Weekly ➞ Best Stocks Year-to-Date ➞ Best Stocks Trends ➞  Best Stocks Today 12Stocks.com Best Nasdaq Stocks ➞ Best S&P 500 Stocks ➞ Best Tech Stocks ➞ Best Biotech Stocks ➞ |
| Detailed Overview of Midcap Stocks |
| Midcap Technical Overview, Leaders & Laggards, Top Midcap ETF Funds & Detailed Midcap Stocks List, Charts, Trends & More |
| Midcap: Technical Analysis, Trends & YTD Performance | |
| MidCap segment as represented by
MDY, an exchange-traded fund [ETF], holds basket of about four hundred midcap stocks from across all major sectors of the US stock market. The midcap index (contains stocks like Green Mountain Coffee Roasters and Tractor Supply Company) is up by 4.42% and is currently underperforming the overall market by -1.22% year-to-date. Below is a quick view of technical charts and trends: | |
 MDY Weekly Chart |
|
| Long Term Trend: Very Good | |
| Medium Term Trend: Not Good | |
 MDY Daily Chart |
|
| Short Term Trend: Very Good | |
| Overall Trend Score: 63 | |
| YTD Performance: 4.42% | |
| **Trend Scores & Views Are Only For Educational Purposes And Not For Investing | |
| 12Stocks.com: Investing in Midcap Index using Exchange Traded Funds | |
|
The following table shows list of key exchange traded funds (ETF) that
help investors track Midcap index. The following list also includes leveraged ETF funds that track twice or thrice the daily returns of Midcap indices. Short or inverse ETF funds move in the opposite direction to the index they track and are useful during market pullbacks or during bear markets. Quick View: Move mouse or cursor over ETF symbol (ticker) to view short-term technical chart and over ETF name to view long term chart. Click on ticker or stock name for detailed view. Click on to add stock symbol to your watchlist and to view watchlist. |
12Stocks.com List of ETFs that track Midcap Index
| Ticker | ETF Name | Watchlist | Recent Price | Smart Investing & Trading Score | Change % | Week % | Year-to-date % |
| IJH | iShares Core S&P Mid-Cap | | 57.85 | 68 | 1.82 | 2.24 | 4.37% |
| IWS | iShares Russell Mid-Cap Value | | 119.86 | 68 | 0.89 | 1.88 | 3.07% |
| IWP | iShares Russell Mid-Cap Growth | | 108.63 | 58 | 1.80 | 2.77 | 3.99% |
| IWR | iShares Russell Mid-Cap | | 80.37 | 63 | 1.25 | 2.17 | 3.4% |
| MDY | SPDR S&P MidCap 400 ETF | | 529.80 | 63 | 1.20 | 2.22 | 4.42% |
| IJK | iShares S&P Mid-Cap 400 Growth | | 86.93 | 63 | 1.58 | 2.45 | 9.73% |
| IJJ | iShares S&P Mid-Cap 400 Value | | 112.47 | 63 | 0.83 | 1.74 | -1.38% |
| XMLV | PowerShares S&P MidCap Low Volatil ETF | | 54.91 | 75 | 0.68 | 1.38 | 3.25% |
| UMDD | ProShares UltraPro MidCap400 | | 24.11 | 63 | 4.06 | 6.86 | 8.02% |
| SMDD | ProShares UltraPro Short MidCap400 | | 11.65 | 32 | -3.79 | -7.26 | -13.46% |
| MVV | ProShares Ultra MidCap400 | | 61.54 | 63 | 2.07 | 4.31 | 6.31% |
| MZZ | ProShares UltraShort MidCap400 | | 11.66 | 27 | -2.51 | -4.2 | -7.24% |
| MYY | ProShares Short MidCap400 | | 20.74 | 32 | -1.09 | -2.12 | -3.33% |
| 12Stocks.com: Charts, Trends, Fundamental Data and Performances of MidCap Stocks | |
|
We now take in-depth look at all MidCap stocks including charts, multi-period performances and overall trends (as measured by Smart Investing & Trading Score). One can sort MidCap stocks (click link to choose) by Daily, Weekly and by Year-to-Date performances. Also, one can sort by size of the company or by market capitalization. |
| Select Your Default Chart Type: | |||||
| |||||
| Click on stock symbol or name for detailed view. Click on to add stock symbol to your watchlist and to view watchlist. Quick View: Move mouse or cursor over "Daily" to quickly view daily technical stock chart and over "Weekly" to view weekly technical stock chart. | |||||

 | DRI Darden Restaurants, Inc. |
| Sector: Services & Goods | |
| SubSector: Restaurants | |
| MarketCap: 5623.1 Millions | |
| Recent Price: 155.90 Smart Investing & Trading Score: 57 | |
| Day Percent Change: 0.87% Day Change: 1.35 | |
| Week Change: 2.23% Year-to-date Change: -5.1% | |
| DRI Links: Profile News Message Board | |
| Charts:- Daily , Weekly | |
| Add DRI to Watchlist: View: Get Complete DRI Trend Analysis ➞ | |
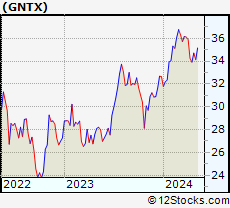 | GNTX Gentex Corporation |
| Sector: Consumer Staples | |
| SubSector: Auto Parts | |
| MarketCap: 5638.99 Millions | |
| Recent Price: 34.66 Smart Investing & Trading Score: 65 | |
| Day Percent Change: 1.20% Day Change: 0.41 | |
| Week Change: 2.21% Year-to-date Change: 6.1% | |
| GNTX Links: Profile News Message Board | |
| Charts:- Daily , Weekly | |
| Add GNTX to Watchlist: View: Get Complete GNTX Trend Analysis ➞ | |
 | AWI Armstrong World Industries, Inc. |
| Sector: Industrials | |
| SubSector: General Building Materials | |
| MarketCap: 3609.53 Millions | |
| Recent Price: 116.50 Smart Investing & Trading Score: 63 | |
| Day Percent Change: 1.57% Day Change: 1.80 | |
| Week Change: 2.21% Year-to-date Change: 18.5% | |
| AWI Links: Profile News Message Board | |
| Charts:- Daily , Weekly | |
| Add AWI to Watchlist: View: Get Complete AWI Trend Analysis ➞ | |
 | TFX Teleflex Incorporated |
| Sector: Health Care | |
| SubSector: Medical Instruments & Supplies | |
| MarketCap: 12989.3 Millions | |
| Recent Price: 211.11 Smart Investing & Trading Score: 42 | |
| Day Percent Change: 1.85% Day Change: 3.84 | |
| Week Change: 2.2% Year-to-date Change: -15.3% | |
| TFX Links: Profile News Message Board | |
| Charts:- Daily , Weekly | |
| Add TFX to Watchlist: View: Get Complete TFX Trend Analysis ➞ | |
 | LSCC Lattice Semiconductor Corporation |
| Sector: Technology | |
| SubSector: Semiconductor - Specialized | |
| MarketCap: 2104 Millions | |
| Recent Price: 67.97 Smart Investing & Trading Score: 43 | |
| Day Percent Change: 2.86% Day Change: 1.89 | |
| Week Change: 2.2% Year-to-date Change: -1.5% | |
| LSCC Links: Profile News Message Board | |
| Charts:- Daily , Weekly | |
| Add LSCC to Watchlist: View: Get Complete LSCC Trend Analysis ➞ | |
 | NRG NRG Energy, Inc. |
| Sector: Utilities | |
| SubSector: Diversified Utilities | |
| MarketCap: 6510.7 Millions | |
| Recent Price: 71.49 Smart Investing & Trading Score: 68 | |
| Day Percent Change: 1.56% Day Change: 1.10 | |
| Week Change: 2.17% Year-to-date Change: 38.3% | |
| NRG Links: Profile News Message Board | |
| Charts:- Daily , Weekly | |
| Add NRG to Watchlist: View: Get Complete NRG Trend Analysis ➞ | |
 | AOS A. O. Smith Corporation |
| Sector: Industrials | |
| SubSector: Industrial Electrical Equipment | |
| MarketCap: 5809.89 Millions | |
| Recent Price: 87.92 Smart Investing & Trading Score: 83 | |
| Day Percent Change: 1.17% Day Change: 1.02 | |
| Week Change: 2.15% Year-to-date Change: 6.7% | |
| AOS Links: Profile News Message Board | |
| Charts:- Daily , Weekly | |
| Add AOS to Watchlist: View: Get Complete AOS Trend Analysis ➞ | |
 | MAN ManpowerGroup Inc. |
| Sector: Services & Goods | |
| SubSector: Staffing & Outsourcing Services | |
| MarketCap: 3436.28 Millions | |
| Recent Price: 76.44 Smart Investing & Trading Score: 100 | |
| Day Percent Change: 1.04% Day Change: 0.79 | |
| Week Change: 2.14% Year-to-date Change: -3.8% | |
| MAN Links: Profile News Message Board | |
| Charts:- Daily , Weekly | |
| Add MAN to Watchlist: View: Get Complete MAN Trend Analysis ➞ | |
 | GRMN Garmin Ltd. |
| Sector: Technology | |
| SubSector: Scientific & Technical Instruments | |
| MarketCap: 13909.3 Millions | |
| Recent Price: 142.51 Smart Investing & Trading Score: 63 | |
| Day Percent Change: 1.06% Day Change: 1.49 | |
| Week Change: 2.14% Year-to-date Change: 10.9% | |
| GRMN Links: Profile News Message Board | |
| Charts:- Daily , Weekly | |
| Add GRMN to Watchlist: View: Get Complete GRMN Trend Analysis ➞ | |
 | CAG Conagra Brands, Inc. |
| Sector: Consumer Staples | |
| SubSector: Processed & Packaged Goods | |
| MarketCap: 14084.1 Millions | |
| Recent Price: 31.27 Smart Investing & Trading Score: 93 | |
| Day Percent Change: 0.55% Day Change: 0.17 | |
| Week Change: 2.12% Year-to-date Change: 9.1% | |
| CAG Links: Profile News Message Board | |
| Charts:- Daily , Weekly | |
| Add CAG to Watchlist: View: Get Complete CAG Trend Analysis ➞ | |
 | TXT Textron Inc. |
| Sector: Industrials | |
| SubSector: Aerospace/Defense - Major Diversified | |
| MarketCap: 6123.09 Millions | |
| Recent Price: 95.28 Smart Investing & Trading Score: 75 | |
| Day Percent Change: 1.61% Day Change: 1.51 | |
| Week Change: 2.12% Year-to-date Change: 18.5% | |
| TXT Links: Profile News Message Board | |
| Charts:- Daily , Weekly | |
| Add TXT to Watchlist: View: Get Complete TXT Trend Analysis ➞ | |
 | CARR Carrier Global Corporation |
| Sector: Industrials | |
| SubSector: Building Products & Equipment | |
| MarketCap: 32547 Millions | |
| Recent Price: 55.14 Smart Investing & Trading Score: 45 | |
| Day Percent Change: 2.83% Day Change: 1.52 | |
| Week Change: 2.11% Year-to-date Change: -4.0% | |
| CARR Links: Profile News Message Board | |
| Charts:- Daily , Weekly | |
| Add CARR to Watchlist: View: Get Complete CARR Trend Analysis ➞ | |
 | WSM Williams-Sonoma, Inc. |
| Sector: Services & Goods | |
| SubSector: Home Furnishing Stores | |
| MarketCap: 3370.05 Millions | |
| Recent Price: 285.07 Smart Investing & Trading Score: 68 | |
| Day Percent Change: 1.73% Day Change: 4.85 | |
| Week Change: 2.1% Year-to-date Change: 41.3% | |
| WSM Links: Profile News Message Board | |
| Charts:- Daily , Weekly | |
| Add WSM to Watchlist: View: Get Complete WSM Trend Analysis ➞ | |
 | ESAB ESAB Corporation |
| Sector: Industrials | |
| SubSector: Metal Fabrication | |
| MarketCap: 3940 Millions | |
| Recent Price: 108.25 Smart Investing & Trading Score: 56 | |
| Day Percent Change: 2.90% Day Change: 3.05 | |
| Week Change: 2.1% Year-to-date Change: 24.5% | |
| ESAB Links: Profile News Message Board | |
| Charts:- Daily , Weekly | |
| Add ESAB to Watchlist: View: Get Complete ESAB Trend Analysis ➞ | |
 | CMA Comerica Incorporated |
| Sector: Financials | |
| SubSector: Money Center Banks | |
| MarketCap: 4449.49 Millions | |
| Recent Price: 52.64 Smart Investing & Trading Score: 72 | |
| Day Percent Change: 0.06% Day Change: 0.03 | |
| Week Change: 2.09% Year-to-date Change: -5.7% | |
| CMA Links: Profile News Message Board | |
| Charts:- Daily , Weekly | |
| Add CMA to Watchlist: View: Get Complete CMA Trend Analysis ➞ | |
 | BHF Brighthouse Financial, Inc. |
| Sector: Financials | |
| SubSector: Life Insurance | |
| MarketCap: 2045.06 Millions | |
| Recent Price: 49.90 Smart Investing & Trading Score: 59 | |
| Day Percent Change: 1.53% Day Change: 0.75 | |
| Week Change: 2.09% Year-to-date Change: -5.7% | |
| BHF Links: Profile News Message Board | |
| Charts:- Daily , Weekly | |
| Add BHF to Watchlist: View: Get Complete BHF Trend Analysis ➞ | |
 | DBX Dropbox, Inc. |
| Sector: Technology | |
| SubSector: Application Software | |
| MarketCap: 7588.32 Millions | |
| Recent Price: 23.47 Smart Investing & Trading Score: 64 | |
| Day Percent Change: 0.69% Day Change: 0.16 | |
| Week Change: 2.09% Year-to-date Change: -20.4% | |
| DBX Links: Profile News Message Board | |
| Charts:- Daily , Weekly | |
| Add DBX to Watchlist: View: Get Complete DBX Trend Analysis ➞ | |
 | ICUI ICU Medical, Inc. |
| Sector: Health Care | |
| SubSector: Medical Instruments & Supplies | |
| MarketCap: 3640.7 Millions | |
| Recent Price: 97.76 Smart Investing & Trading Score: 68 | |
| Day Percent Change: 1.43% Day Change: 1.38 | |
| Week Change: 2.08% Year-to-date Change: -2.0% | |
| ICUI Links: Profile News Message Board | |
| Charts:- Daily , Weekly | |
| Add ICUI to Watchlist: View: Get Complete ICUI Trend Analysis ➞ | |
 | INSP Inspire Medical Systems, Inc. |
| Sector: Technology | |
| SubSector: Internet Information Providers | |
| MarketCap: 1239.8 Millions | |
| Recent Price: 233.93 Smart Investing & Trading Score: 63 | |
| Day Percent Change: 3.87% Day Change: 8.71 | |
| Week Change: 2.05% Year-to-date Change: 15.0% | |
| INSP Links: Profile News Message Board | |
| Charts:- Daily , Weekly | |
| Add INSP to Watchlist: View: Get Complete INSP Trend Analysis ➞ | |
 | PCOR Procore Technologies, Inc. |
| Sector: Technology | |
| SubSector: Software - Application | |
| MarketCap: 9180 Millions | |
| Recent Price: 71.73 Smart Investing & Trading Score: 38 | |
| Day Percent Change: 1.63% Day Change: 1.15 | |
| Week Change: 2.05% Year-to-date Change: 2.7% | |
| PCOR Links: Profile News Message Board | |
| Charts:- Daily , Weekly | |
| Add PCOR to Watchlist: View: Get Complete PCOR Trend Analysis ➞ | |
 | BK The Bank of New York Mellon Corporation |
| Sector: Financials | |
| SubSector: Asset Management | |
| MarketCap: 29807.5 Millions | |
| Recent Price: 57.44 Smart Investing & Trading Score: 95 | |
| Day Percent Change: 0.49% Day Change: 0.28 | |
| Week Change: 2.04% Year-to-date Change: 10.4% | |
| BK Links: Profile News Message Board | |
| Charts:- Daily , Weekly | |
| Add BK to Watchlist: View: Get Complete BK Trend Analysis ➞ | |
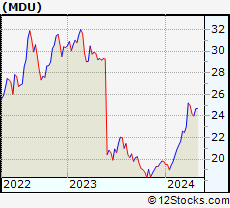 | MDU MDU Resources Group, Inc. |
| Sector: Industrials | |
| SubSector: General Building Materials | |
| MarketCap: 4262.53 Millions | |
| Recent Price: 24.50 Smart Investing & Trading Score: 75 | |
| Day Percent Change: 1.37% Day Change: 0.33 | |
| Week Change: 2.04% Year-to-date Change: 23.7% | |
| MDU Links: Profile News Message Board | |
| Charts:- Daily , Weekly | |
| Add MDU to Watchlist: View: Get Complete MDU Trend Analysis ➞ | |
 | IRM Iron Mountain Incorporated |
| Sector: Technology | |
| SubSector: Business Software & Services | |
| MarketCap: 7339.18 Millions | |
| Recent Price: 76.60 Smart Investing & Trading Score: 70 | |
| Day Percent Change: 0.99% Day Change: 0.75 | |
| Week Change: 2% Year-to-date Change: 9.5% | |
| IRM Links: Profile News Message Board | |
| Charts:- Daily , Weekly | |
| Add IRM to Watchlist: View: Get Complete IRM Trend Analysis ➞ | |
 | SUI Sun Communities, Inc. |
| Sector: Financials | |
| SubSector: REIT - Residential | |
| MarketCap: 11280.5 Millions | |
| Recent Price: 120.04 Smart Investing & Trading Score: 52 | |
| Day Percent Change: 1.48% Day Change: 1.75 | |
| Week Change: 2% Year-to-date Change: -10.2% | |
| SUI Links: Profile News Message Board | |
| Charts:- Daily , Weekly | |
| Add SUI to Watchlist: View: Get Complete SUI Trend Analysis ➞ | |
 | CDW CDW Corporation |
| Sector: Technology | |
| SubSector: Information Technology Services | |
| MarketCap: 12775 Millions | |
| Recent Price: 240.47 Smart Investing & Trading Score: 58 | |
| Day Percent Change: 1.19% Day Change: 2.83 | |
| Week Change: 1.99% Year-to-date Change: 5.8% | |
| CDW Links: Profile News Message Board | |
| Charts:- Daily , Weekly | |
| Add CDW to Watchlist: View: Get Complete CDW Trend Analysis ➞ | |
| For tabular summary view of above stock list: Summary View ➞ 0 - 25 , 25 - 50 , 50 - 75 , 75 - 100 , 100 - 125 , 125 - 150 , 150 - 175 , 175 - 200 , 200 - 225 , 225 - 250 , 250 - 275 , 275 - 300 , 300 - 325 , 325 - 350 , 350 - 375 , 375 - 400 , 400 - 425 , 425 - 450 , 450 - 475 , 475 - 500 , 500 - 525 , 525 - 550 , 550 - 575 , 575 - 600 , 600 - 625 , 625 - 650 , 650 - 675 , 675 - 700 , 700 - 725 , 725 - 750 , 750 - 775 | ||
| Click To Change The Sort Order: By Market Cap or Company Size Performance: Year-to-date, Week and Day | |
| Select Chart Type: | ||
|
Best Stocks Today 12Stocks.com |
© 2024 12Stocks.com Terms & Conditions Privacy Contact Us
All Information Provided Only For Education And Not To Be Used For Investing or Trading. See Terms & Conditions


One More Thing ... Get Best Stocks Delivered Daily!
Never Ever Miss A Move With Our Top Ten Stocks Lists
Find Best Stocks In Any Market - Bull or Bear Market
Take A Peek At Our Top Ten Stocks Lists: Daily, Weekly, Year-to-Date & Top Trends
Find Best Stocks In Any Market - Bull or Bear Market
Take A Peek At Our Top Ten Stocks Lists: Daily, Weekly, Year-to-Date & Top Trends
Midcap Stocks With Best Up Trends [0-bearish to 100-bullish]: HashiCorp [100], Ryder System[100], Quest Diagnostics[100], Hasbro [100], RLI [100], Popular [100], BioMarin Pharmaceutical[100], SLM [100], Kirby [100], Highwoods Properties[100], HEICO [100]
Best Midcap Stocks Year-to-Date:
AppLovin [78.89%], Vistra Energy[77.7%], ShockWave Medical[72.41%], Spotify [61.41%], Constellation Energy[60.75%], EMCOR [56.93%], Natera [45.34%], Pure Storage[45.26%], Wingstop [42.15%], Williams-Sonoma [41.28%], CAVA [40.73%] Best Midcap Stocks This Week:
HashiCorp [22.53%], Tandem Diabetes[14.92%], Globe Life[13.52%], Ryder System[12.23%], Coinbase Global[12.04%], MongoDB [11.91%], Spotify [9.96%], Kohl s[9.53%], Medpace [9.49%], Repligen [9%], GitLab [8.91%] Best Midcap Stocks Daily:
HashiCorp [19.54%], Globe Life[14.11%], Ryder System[11.94%], Spotify [11.41%], Tandem Diabetes[10.11%], Repligen [8.76%], Medpace [8.21%], Viasat [7.99%], MongoDB [7.69%], GitLab [6.80%], Lucid [6.11%]