
 Login Sign Up


| |||||
 |  | ||||

| 12Stocks.com Market Intelligence |
Best MidCap Stocks
|
| In a hurry? Mid Cap Stocks Lists: Performance Trends Table, Stock Charts
Sort midcap stocks: Daily, Weekly, Year-to-Date, Market Cap & Trends. Filter midcap stocks list by sector: Show all, Tech, Finance, Energy, Staples, Retail, Industrial, Materials, Utilities and HealthCare Filter midcap stocks list by size:All MidCap Large Mid-Range Small |
| 12Stocks.com Mid Cap Stocks Performances & Trends Daily | |||||||||
|
|  The overall Smart Investing & Trading Score is 63 (0-bearish to 100-bullish) which puts Mid Cap index in short term neutral to bullish trend. The Smart Investing & Trading Score from previous trading session is 44 and hence an improvement of trend.
| ||||||||
Here are the Smart Investing & Trading Scores of the most requested mid cap stocks at 12Stocks.com (click stock name for detailed review):
|


| 12Stocks.com: Top Performing Mid Cap Index Stocks | ||||||||||||||||||||||||||||||||||||||||||||||||
 The top performing Mid Cap Index stocks year to date are
Now, more recently, over last week, the top performing Mid Cap Index stocks on the move are


|
||||||||||||||||||||||||||||||||||||||||||||||||
| 12Stocks.com: Investing in Midcap Index with Stocks | |
|
The following table helps investors and traders sort through current performance and trends (as measured by Smart Investing & Trading Score) of various
stocks in the Midcap Index. Quick View: Move mouse or cursor over stock symbol (ticker) to view short-term technical chart and over stock name to view long term chart. Click on  to add stock symbol to your watchlist and to add stock symbol to your watchlist and  to view watchlist. Click on any ticker or stock name for detailed market intelligence report for that stock. to view watchlist. Click on any ticker or stock name for detailed market intelligence report for that stock. |
12Stocks.com Performance of Stocks in Midcap Index
| Ticker | Stock Name | Watchlist | Category | Recent Price | Smart Investing & Trading Score | Change % | Weekly Change% |
| HCP | HashiCorp |   | Technology | 24.57 | 63 | 2.50% | 2.50% |
| HOG | Harley-Davidson | | Consumer Staples | 38.99 | 68 | 2.50% | 2.50% |
| ARE | Alexandria Real | | Financials | 118.57 | 42 | 2.49% | 2.49% |
| TDOC | Teladoc Health | | Technology | 13.30 | 47 | 2.47% | 2.47% |
| BPOP | Popular | | Financials | 85.25 | 75 | 2.46% | 2.46% |
| TOST | Toast | | Technology | 22.15 | 41 | 2.45% | 2.45% |
| PNFP | Pinnacle Financial | | Financials | 81.42 | 54 | 2.42% | 2.42% |
| WSO | Watsco | | Services & Goods | 406.50 | 51 | 2.41% | 2.41% |
| ILMN | Illumina | | Health Care | 120.25 | 42 | 2.40% | 2.40% |
| WEN | Wendy s | | Services & Goods | 19.71 | 100 | 2.39% | 2.39% |
| RRC | Range Resources | | Energy | 36.11 | 95 | 2.38% | 2.38% |
| EXAS | Exact Sciences | | Health Care | 62.41 | 10 | 2.38% | 2.38% |
| PENN | Penn National | | Services & Goods | 16.93 | 49 | 2.36% | 2.36% |
| BAX | Baxter | | Health Care | 40.40 | 68 | 2.36% | 2.36% |
| SJM | J. M. | | Consumer Staples | 117.46 | 67 | 2.35% | 2.35% |
| UHS | Universal Health | | Health Care | 161.13 | 51 | 2.32% | 2.32% |
| BEPC | Brookfield Renewable | | Utilities | 22.89 | 59 | 2.32% | 2.32% |
| AA | Alcoa | | Materials | 36.35 | 81 | 2.31% | 2.31% |
| BSY | Bentley | | Technology | 53.20 | 100 | 2.30% | 2.30% |
| CRWD | CrowdStrike | | Technology | 289.15 | 10 | 2.30% | 2.30% |
| PHM | Pulte | | Industrials | 107.83 | 51 | 2.28% | 2.28% |
| CCK | Crown | | Consumer Staples | 79.43 | 74 | 2.27% | 2.27% |
| MCHP | Microchip | | Technology | 83.53 | 17 | 2.26% | 2.26% |
| MPW | Medical Properties | | Financials | 4.52 | 56 | 2.26% | 2.26% |
| ESTC | Elastic N.V | | Technology | 98.36 | 64 | 2.26% | 2.26% |
| For chart view version of above stock list: Chart View ➞ 0 - 25 , 25 - 50 , 50 - 75 , 75 - 100 , 100 - 125 , 125 - 150 , 150 - 175 , 175 - 200 , 200 - 225 , 225 - 250 , 250 - 275 , 275 - 300 , 300 - 325 , 325 - 350 , 350 - 375 , 375 - 400 , 400 - 425 , 425 - 450 , 450 - 475 , 475 - 500 , 500 - 525 , 525 - 550 , 550 - 575 , 575 - 600 , 600 - 625 , 625 - 650 , 650 - 675 , 675 - 700 , 700 - 725 , 725 - 750 , 750 - 775 | ||
 | Click To Change The Sort Order: By Market Cap or Company Size Performance: Year-to-date, Week and Day |  |
|
Get the most comprehensive stock market coverage daily at 12Stocks.com ➞ Best Stocks Today ➞ Best Stocks Weekly ➞ Best Stocks Year-to-Date ➞ Best Stocks Trends ➞  Best Stocks Today 12Stocks.com Best Nasdaq Stocks ➞ Best S&P 500 Stocks ➞ Best Tech Stocks ➞ Best Biotech Stocks ➞ |
| Detailed Overview of Midcap Stocks |
| Midcap Technical Overview, Leaders & Laggards, Top Midcap ETF Funds & Detailed Midcap Stocks List, Charts, Trends & More |
| Midcap: Technical Analysis, Trends & YTD Performance | |
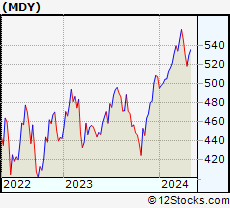
| MidCap segment as represented by
MDY, an exchange-traded fund [ETF], holds basket of about four hundred midcap stocks from across all major sectors of the US stock market. The midcap index (contains stocks like Green Mountain Coffee Roasters and Tractor Supply Company) is up by 3.18% and is currently underperforming the overall market by -1.21% year-to-date. Below is a quick view of technical charts and trends: | |
 MDY Weekly Chart |
|
| Long Term Trend: Good | |
| Medium Term Trend: Not Good | |
 MDY Daily Chart |
|
| Short Term Trend: Very Good | |
| Overall Trend Score: 63 | |
| YTD Performance: 3.18% | |
| **Trend Scores & Views Are Only For Educational Purposes And Not For Investing | |
| 12Stocks.com: Investing in Midcap Index using Exchange Traded Funds | |
|
The following table shows list of key exchange traded funds (ETF) that
help investors track Midcap index. The following list also includes leveraged ETF funds that track twice or thrice the daily returns of Midcap indices. Short or inverse ETF funds move in the opposite direction to the index they track and are useful during market pullbacks or during bear markets. Quick View: Move mouse or cursor over ETF symbol (ticker) to view short-term technical chart and over ETF name to view long term chart. Click on ticker or stock name for detailed view. Click on to add stock symbol to your watchlist and to view watchlist. |
12Stocks.com List of ETFs that track Midcap Index
| Ticker | ETF Name | Watchlist | Recent Price | Smart Investing & Trading Score | Change % | Week % | Year-to-date % |
| IWS | iShares Russell Mid-Cap Value | | 118.80 | 68 | 0.98 | 0.98 | 2.16% |
| IWP | iShares Russell Mid-Cap Growth | | 106.71 | 51 | 0.96 | 0.96 | 2.15% |
| IWR | iShares Russell Mid-Cap | | 79.38 | 56 | 0.92 | 0.92 | 2.12% |
| IJH | iShares Core S&P Mid-Cap | | 56.81 | 56 | 0.42 | 0.42 | 2.5% |
| MDY | SPDR S&P MidCap 400 ETF | | 523.50 | 63 | 1.01 | 1.01 | 3.18% |
| IJK | iShares S&P Mid-Cap 400 Growth | | 85.58 | 56 | 0.86 | 0.86 | 8.03% |
| IJJ | iShares S&P Mid-Cap 400 Value | | 111.54 | 63 | 0.90 | 0.9 | -2.19% |
| MYY | ProShares Short MidCap400 | | 20.97 | 32 | -1.04 | -1.04 | -2.26% |
| XMLV | PowerShares S&P MidCap Low Volatil ETF | | 54.54 | 75 | 0.70 | 0.7 | 2.56% |
| MZZ | ProShares UltraShort MidCap400 | | 11.96 | 27 | -1.73 | -1.73 | -4.86% |
| SMDD | ProShares UltraPro Short MidCap400 | | 12.11 | 32 | -3.60 | -3.6 | -10.05% |
| UMDD | ProShares UltraPro MidCap400 | | 23.17 | 63 | 2.69 | 2.69 | 3.81% |
| MVV | ProShares Ultra MidCap400 | | 60.29 | 63 | 2.19 | 2.19 | 4.15% |
| 12Stocks.com: Charts, Trends, Fundamental Data and Performances of MidCap Stocks | |
|
We now take in-depth look at all MidCap stocks including charts, multi-period performances and overall trends (as measured by Smart Investing & Trading Score). One can sort MidCap stocks (click link to choose) by Daily, Weekly and by Year-to-Date performances. Also, one can sort by size of the company or by market capitalization. |
| Select Your Default Chart Type: | |||||
| |||||
| Click on stock symbol or name for detailed view. Click on to add stock symbol to your watchlist and to view watchlist. Quick View: Move mouse or cursor over "Daily" to quickly view daily technical stock chart and over "Weekly" to view weekly technical stock chart. | |||||

 | HCP HashiCorp, Inc. |
| Sector: Technology | |
| SubSector: Software - Infrastructure | |
| MarketCap: 5070 Millions | |
| Recent Price: 24.57 Smart Investing & Trading Score: 63 | |
| Day Percent Change: 2.50% Day Change: 0.60 | |
| Week Change: 2.5% Year-to-date Change: 1.9% | |
| HCP Links: Profile News Message Board | |
| Charts:- Daily , Weekly | |
| Add HCP to Watchlist: View: Get Complete HCP Trend Analysis ➞ | |
 | HOG Harley-Davidson, Inc. |
| Sector: Consumer Staples | |
| SubSector: Recreational Vehicles | |
| MarketCap: 2808.49 Millions | |
| Recent Price: 38.99 Smart Investing & Trading Score: 68 | |
| Day Percent Change: 2.50% Day Change: 0.95 | |
| Week Change: 2.5% Year-to-date Change: 5.8% | |
| HOG Links: Profile News Message Board | |
| Charts:- Daily , Weekly | |
| Add HOG to Watchlist: View: Get Complete HOG Trend Analysis ➞ | |
 | ARE Alexandria Real Estate Equities, Inc. |
| Sector: Financials | |
| SubSector: REIT - Office | |
| MarketCap: 16793.6 Millions | |
| Recent Price: 118.57 Smart Investing & Trading Score: 42 | |
| Day Percent Change: 2.49% Day Change: 2.88 | |
| Week Change: 2.49% Year-to-date Change: -6.5% | |
| ARE Links: Profile News Message Board | |
| Charts:- Daily , Weekly | |
| Add ARE to Watchlist: View: Get Complete ARE Trend Analysis ➞ | |
 | TDOC Teladoc Health, Inc. |
| Sector: Technology | |
| SubSector: Healthcare Information Services | |
| MarketCap: 11968.5 Millions | |
| Recent Price: 13.30 Smart Investing & Trading Score: 47 | |
| Day Percent Change: 2.47% Day Change: 0.32 | |
| Week Change: 2.47% Year-to-date Change: -38.3% | |
| TDOC Links: Profile News Message Board | |
| Charts:- Daily , Weekly | |
| Add TDOC to Watchlist: View: Get Complete TDOC Trend Analysis ➞ | |
 | BPOP Popular, Inc. |
| Sector: Financials | |
| SubSector: Foreign Regional Banks | |
| MarketCap: 2671.99 Millions | |
| Recent Price: 85.25 Smart Investing & Trading Score: 75 | |
| Day Percent Change: 2.46% Day Change: 2.05 | |
| Week Change: 2.46% Year-to-date Change: 3.9% | |
| BPOP Links: Profile News Message Board | |
| Charts:- Daily , Weekly | |
| Add BPOP to Watchlist: View: Get Complete BPOP Trend Analysis ➞ | |
 | TOST Toast, Inc. |
| Sector: Technology | |
| SubSector: Software - Infrastructure | |
| MarketCap: 11680 Millions | |
| Recent Price: 22.15 Smart Investing & Trading Score: 41 | |
| Day Percent Change: 2.45% Day Change: 0.53 | |
| Week Change: 2.45% Year-to-date Change: 21.0% | |
| TOST Links: Profile News Message Board | |
| Charts:- Daily , Weekly | |
| Add TOST to Watchlist: View: Get Complete TOST Trend Analysis ➞ | |
 | PNFP Pinnacle Financial Partners, Inc. |
| Sector: Financials | |
| SubSector: Regional - Southeast Banks | |
| MarketCap: 2771.75 Millions | |
| Recent Price: 81.42 Smart Investing & Trading Score: 54 | |
| Day Percent Change: 2.42% Day Change: 1.92 | |
| Week Change: 2.42% Year-to-date Change: -6.7% | |
| PNFP Links: Profile News Message Board | |
| Charts:- Daily , Weekly | |
| Add PNFP to Watchlist: View: Get Complete PNFP Trend Analysis ➞ | |
 | WSO Watsco, Inc. |
| Sector: Services & Goods | |
| SubSector: Electronics Wholesale | |
| MarketCap: 6000.33 Millions | |
| Recent Price: 406.50 Smart Investing & Trading Score: 51 | |
| Day Percent Change: 2.41% Day Change: 9.58 | |
| Week Change: 2.41% Year-to-date Change: -5.1% | |
| WSO Links: Profile News Message Board | |
| Charts:- Daily , Weekly | |
| Add WSO to Watchlist: View: Get Complete WSO Trend Analysis ➞ | |
 | ILMN Illumina, Inc. |
| Sector: Health Care | |
| SubSector: Biotechnology | |
| MarketCap: 39194.3 Millions | |
| Recent Price: 120.25 Smart Investing & Trading Score: 42 | |
| Day Percent Change: 2.40% Day Change: 2.82 | |
| Week Change: 2.4% Year-to-date Change: -13.6% | |
| ILMN Links: Profile News Message Board | |
| Charts:- Daily , Weekly | |
| Add ILMN to Watchlist: View: Get Complete ILMN Trend Analysis ➞ | |
 | WEN The Wendy s Company |
| Sector: Services & Goods | |
| SubSector: Restaurants | |
| MarketCap: 2814.9 Millions | |
| Recent Price: 19.71 Smart Investing & Trading Score: 100 | |
| Day Percent Change: 2.39% Day Change: 0.46 | |
| Week Change: 2.39% Year-to-date Change: 1.2% | |
| WEN Links: Profile News Message Board | |
| Charts:- Daily , Weekly | |
| Add WEN to Watchlist: View: Get Complete WEN Trend Analysis ➞ | |
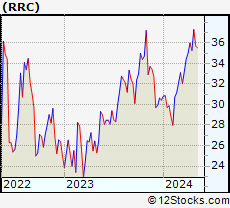 | RRC Range Resources Corporation |
| Sector: Energy | |
| SubSector: Independent Oil & Gas | |
| MarketCap: 728.093 Millions | |
| Recent Price: 36.11 Smart Investing & Trading Score: 95 | |
| Day Percent Change: 2.38% Day Change: 0.84 | |
| Week Change: 2.38% Year-to-date Change: 18.6% | |
| RRC Links: Profile News Message Board | |
| Charts:- Daily , Weekly | |
| Add RRC to Watchlist: View: Get Complete RRC Trend Analysis ➞ | |
 | EXAS Exact Sciences Corporation |
| Sector: Health Care | |
| SubSector: Medical Laboratories & Research | |
| MarketCap: 8572 Millions | |
| Recent Price: 62.41 Smart Investing & Trading Score: 10 | |
| Day Percent Change: 2.38% Day Change: 1.45 | |
| Week Change: 2.38% Year-to-date Change: -15.6% | |
| EXAS Links: Profile News Message Board | |
| Charts:- Daily , Weekly | |
| Add EXAS to Watchlist: View: Get Complete EXAS Trend Analysis ➞ | |
 | PENN Penn National Gaming, Inc. |
| Sector: Services & Goods | |
| SubSector: Resorts & Casinos | |
| MarketCap: 1183.84 Millions | |
| Recent Price: 16.93 Smart Investing & Trading Score: 49 | |
| Day Percent Change: 2.36% Day Change: 0.39 | |
| Week Change: 2.36% Year-to-date Change: -34.9% | |
| PENN Links: Profile News Message Board | |
| Charts:- Daily , Weekly | |
| Add PENN to Watchlist: View: Get Complete PENN Trend Analysis ➞ | |
 | BAX Baxter International Inc. |
| Sector: Health Care | |
| SubSector: Medical Instruments & Supplies | |
| MarketCap: 39955.8 Millions | |
| Recent Price: 40.40 Smart Investing & Trading Score: 68 | |
| Day Percent Change: 2.36% Day Change: 0.93 | |
| Week Change: 2.36% Year-to-date Change: 4.5% | |
| BAX Links: Profile News Message Board | |
| Charts:- Daily , Weekly | |
| Add BAX to Watchlist: View: Get Complete BAX Trend Analysis ➞ | |
 | SJM The J. M. Smucker Company |
| Sector: Consumer Staples | |
| SubSector: Processed & Packaged Goods | |
| MarketCap: 12635.8 Millions | |
| Recent Price: 117.46 Smart Investing & Trading Score: 67 | |
| Day Percent Change: 2.35% Day Change: 2.70 | |
| Week Change: 2.35% Year-to-date Change: -7.1% | |
| SJM Links: Profile News Message Board | |
| Charts:- Daily , Weekly | |
| Add SJM to Watchlist: View: Get Complete SJM Trend Analysis ➞ | |
 | UHS Universal Health Services, Inc. |
| Sector: Health Care | |
| SubSector: Hospitals | |
| MarketCap: 7217.66 Millions | |
| Recent Price: 161.13 Smart Investing & Trading Score: 51 | |
| Day Percent Change: 2.32% Day Change: 3.66 | |
| Week Change: 2.32% Year-to-date Change: 5.7% | |
| UHS Links: Profile News Message Board | |
| Charts:- Daily , Weekly | |
| Add UHS to Watchlist: View: Get Complete UHS Trend Analysis ➞ | |
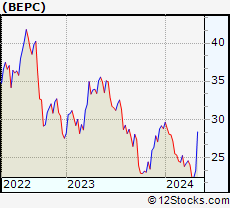 | BEPC Brookfield Renewable Corporation |
| Sector: Utilities | |
| SubSector: Utilities Renewable | |
| MarketCap: 16897 Millions | |
| Recent Price: 22.89 Smart Investing & Trading Score: 59 | |
| Day Percent Change: 2.32% Day Change: 0.52 | |
| Week Change: 2.32% Year-to-date Change: -20.5% | |
| BEPC Links: Profile News Message Board | |
| Charts:- Daily , Weekly | |
| Add BEPC to Watchlist: View: Get Complete BEPC Trend Analysis ➞ | |
 | AA Alcoa Corporation |
| Sector: Materials | |
| SubSector: Aluminum | |
| MarketCap: 1248.08 Millions | |
| Recent Price: 36.35 Smart Investing & Trading Score: 81 | |
| Day Percent Change: 2.31% Day Change: 0.82 | |
| Week Change: 2.31% Year-to-date Change: 6.9% | |
| AA Links: Profile News Message Board | |
| Charts:- Daily , Weekly | |
| Add AA to Watchlist: View: Get Complete AA Trend Analysis ➞ | |
 | BSY Bentley Systems, Incorporated |
| Sector: Technology | |
| SubSector: Software Application | |
| MarketCap: 98687 Millions | |
| Recent Price: 53.20 Smart Investing & Trading Score: 100 | |
| Day Percent Change: 2.30% Day Change: 1.20 | |
| Week Change: 2.3% Year-to-date Change: 2.0% | |
| BSY Links: Profile News Message Board | |
| Charts:- Daily , Weekly | |
| Add BSY to Watchlist: View: Get Complete BSY Trend Analysis ➞ | |
 | CRWD CrowdStrike Holdings, Inc. |
| Sector: Technology | |
| SubSector: Security Software & Services | |
| MarketCap: 11803.6 Millions | |
| Recent Price: 289.15 Smart Investing & Trading Score: 10 | |
| Day Percent Change: 2.30% Day Change: 6.50 | |
| Week Change: 2.3% Year-to-date Change: 13.3% | |
| CRWD Links: Profile News Message Board | |
| Charts:- Daily , Weekly | |
| Add CRWD to Watchlist: View: Get Complete CRWD Trend Analysis ➞ | |
 | PHM PulteGroup, Inc. |
| Sector: Industrials | |
| SubSector: Residential Construction | |
| MarketCap: 6186.46 Millions | |
| Recent Price: 107.83 Smart Investing & Trading Score: 51 | |
| Day Percent Change: 2.28% Day Change: 2.40 | |
| Week Change: 2.28% Year-to-date Change: 4.5% | |
| PHM Links: Profile News Message Board | |
| Charts:- Daily , Weekly | |
| Add PHM to Watchlist: View: Get Complete PHM Trend Analysis ➞ | |
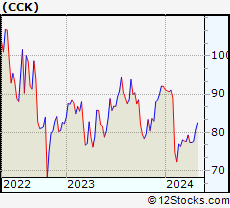 | CCK Crown Holdings, Inc. |
| Sector: Consumer Staples | |
| SubSector: Packaging & Containers | |
| MarketCap: 7198.03 Millions | |
| Recent Price: 79.43 Smart Investing & Trading Score: 74 | |
| Day Percent Change: 2.27% Day Change: 1.76 | |
| Week Change: 2.27% Year-to-date Change: -13.8% | |
| CCK Links: Profile News Message Board | |
| Charts:- Daily , Weekly | |
| Add CCK to Watchlist: View: Get Complete CCK Trend Analysis ➞ | |
 | MCHP Microchip Technology Incorporated |
| Sector: Technology | |
| SubSector: Semiconductor - Broad Line | |
| MarketCap: 16826.3 Millions | |
| Recent Price: 83.53 Smart Investing & Trading Score: 17 | |
| Day Percent Change: 2.26% Day Change: 1.85 | |
| Week Change: 2.26% Year-to-date Change: -7.4% | |
| MCHP Links: Profile News Message Board | |
| Charts:- Daily , Weekly | |
| Add MCHP to Watchlist: View: Get Complete MCHP Trend Analysis ➞ | |
 | MPW Medical Properties Trust, Inc. |
| Sector: Financials | |
| SubSector: REIT - Healthcare Facilities | |
| MarketCap: 8586.74 Millions | |
| Recent Price: 4.52 Smart Investing & Trading Score: 56 | |
| Day Percent Change: 2.26% Day Change: 0.10 | |
| Week Change: 2.26% Year-to-date Change: -7.9% | |
| MPW Links: Profile News Message Board | |
| Charts:- Daily , Weekly | |
| Add MPW to Watchlist: View: Get Complete MPW Trend Analysis ➞ | |
 | ESTC Elastic N.V. |
| Sector: Technology | |
| SubSector: Application Software | |
| MarketCap: 4420.92 Millions | |
| Recent Price: 98.36 Smart Investing & Trading Score: 64 | |
| Day Percent Change: 2.26% Day Change: 2.17 | |
| Week Change: 2.26% Year-to-date Change: -12.7% | |
| ESTC Links: Profile News Message Board | |
| Charts:- Daily , Weekly | |
| Add ESTC to Watchlist: View: Get Complete ESTC Trend Analysis ➞ | |
| For tabular summary view of above stock list: Summary View ➞ 0 - 25 , 25 - 50 , 50 - 75 , 75 - 100 , 100 - 125 , 125 - 150 , 150 - 175 , 175 - 200 , 200 - 225 , 225 - 250 , 250 - 275 , 275 - 300 , 300 - 325 , 325 - 350 , 350 - 375 , 375 - 400 , 400 - 425 , 425 - 450 , 450 - 475 , 475 - 500 , 500 - 525 , 525 - 550 , 550 - 575 , 575 - 600 , 600 - 625 , 625 - 650 , 650 - 675 , 675 - 700 , 700 - 725 , 725 - 750 , 750 - 775 | ||
| Click To Change The Sort Order: By Market Cap or Company Size Performance: Year-to-date, Week and Day | |
| Select Chart Type: | ||
|
Best Stocks Today 12Stocks.com |
© 2024 12Stocks.com Terms & Conditions Privacy Contact Us
All Information Provided Only For Education And Not To Be Used For Investing or Trading. See Terms & Conditions


One More Thing ... Get Best Stocks Delivered Daily!
Never Ever Miss A Move With Our Top Ten Stocks Lists
Find Best Stocks In Any Market - Bull or Bear Market
Take A Peek At Our Top Ten Stocks Lists: Daily, Weekly, Year-to-Date & Top Trends
Find Best Stocks In Any Market - Bull or Bear Market
Take A Peek At Our Top Ten Stocks Lists: Daily, Weekly, Year-to-Date & Top Trends
Midcap Stocks With Best Up Trends [0-bearish to 100-bullish]: United Airlines[100], EQT [100], Wendy s[100], Bentley [100], Campbell Soup[100], Commerce Bancshares[100], Grocery Outlet[100], Ally Financial[100], Hanover Insurance[100], UDR [100], M&T Bank[100]
Best Midcap Stocks Year-to-Date:
Vistra Energy[73.21%], ShockWave Medical[72.44%], AppLovin [70.55%], Constellation Energy[56.45%], EMCOR [54.38%], Spotify [44.88%], Pure Storage[41.64%], Natera [41.46%], Williams-Sonoma [38.87%], Coupang [38.64%], Kinsale Capital[38.31%] Best Midcap Stocks This Week:
AMC Entertainment[8.23%], Coinbase Global[7.07%], Kohl s[6.51%], New York[5.76%], United Airlines[4.98%], Tandem Diabetes[4.37%], Crocs [4.02%], Ardagh Metal[4.01%], MongoDB [3.92%], Natera [3.9%], Enphase Energy[3.78%] Best Midcap Stocks Daily:
AMC Entertainment[8.23%], Coinbase Global[7.07%], Kohl s[6.51%], New York[5.76%], United Airlines[4.98%], Tandem Diabetes[4.37%], Crocs [4.02%], Ardagh Metal[4.01%], MongoDB [3.92%], Natera [3.90%], Enphase Energy[3.78%]