
 Login Sign Up


| |||||
 |  | ||||

| 12Stocks.com Market Intelligence |
Best MidCap Stocks
|
| In a hurry? Mid Cap Stocks Lists: Performance Trends Table, Stock Charts
Sort midcap stocks: Daily, Weekly, Year-to-Date, Market Cap & Trends. Filter midcap stocks list by sector: Show all, Tech, Finance, Energy, Staples, Retail, Industrial, Materials, Utilities and HealthCare Filter midcap stocks list by size:All MidCap Large Mid-Range Small |
| 12Stocks.com Mid Cap Stocks Performances & Trends Daily | |||||||||
|
|  The overall Smart Investing & Trading Score is 70 (0-bearish to 100-bullish) which puts Mid Cap index in short term neutral to bullish trend. The Smart Investing & Trading Score from previous trading session is 56 and hence an improvement of trend.
| ||||||||
Here are the Smart Investing & Trading Scores of the most requested mid cap stocks at 12Stocks.com (click stock name for detailed review):
|


| 12Stocks.com: Top Performing Mid Cap Index Stocks | ||||||||||||||||||||||||||||||||||||||||||||||||
 The top performing Mid Cap Index stocks year to date are
Now, more recently, over last week, the top performing Mid Cap Index stocks on the move are


|
||||||||||||||||||||||||||||||||||||||||||||||||
| 12Stocks.com: Investing in Midcap Index with Stocks | |
|
The following table helps investors and traders sort through current performance and trends (as measured by Smart Investing & Trading Score) of various
stocks in the Midcap Index. Quick View: Move mouse or cursor over stock symbol (ticker) to view short-term technical chart and over stock name to view long term chart. Click on  to add stock symbol to your watchlist and to add stock symbol to your watchlist and  to view watchlist. Click on any ticker or stock name for detailed market intelligence report for that stock. to view watchlist. Click on any ticker or stock name for detailed market intelligence report for that stock. |
12Stocks.com Performance of Stocks in Midcap Index
| Ticker | Stock Name | Watchlist | Category | Recent Price | Smart Investing & Trading Score | Change % | Weekly Change% |
| VRSK | Verisk Analytics |   | Services & Goods | 221.83 | 42 | 0.31% | 0.31% |
| ZI | ZoomInfo Technologies | | Technology | 16.42 | 100 | 0.31% | 0.31% |
| ALK | Alaska Air | | Transports | 44.09 | 71 | 0.30% | 0.30% |
| ELS | Equity LifeStyle | | Financials | 60.71 | 42 | 0.30% | 0.30% |
| WU | Western Union | | Financials | 13.51 | 76 | 0.30% | 0.30% |
| EVR | Evercore | | Financials | 184.85 | 43 | 0.30% | 0.30% |
| TRGP | Targa Resources | | Energy | 117.20 | 83 | 0.29% | 0.29% |
| USFD | US Foods | | Consumer Staples | 51.50 | 85 | 0.29% | 0.29% |
| AFG | American Financial | | Financials | 127.70 | 68 | 0.28% | 0.28% |
| HRL | Hormel Foods | | Consumer Staples | 35.42 | 81 | 0.28% | 0.28% |
| ARMK | Aramark | | Services & Goods | 32.44 | 83 | 0.28% | 0.28% |
| FITB | Fifth Third | | Financials | 37.00 | 81 | 0.27% | 0.27% |
| RYAN | Ryan Specialty | | Financials | 49.07 | 26 | 0.27% | 0.27% |
| MPWR | Monolithic Power | | Technology | 679.05 | 95 | 0.27% | 0.27% |
| IPGP | IPG Photonics | | Technology | 88.64 | 64 | 0.27% | 0.27% |
| WWD | Woodward | | Industrials | 150.98 | 85 | 0.27% | 0.27% |
| PWR | Quanta Services | | Industrials | 262.34 | 90 | 0.26% | 0.26% |
| DD | DuPont de | | Materials | 73.90 | 68 | 0.26% | 0.26% |
| RF | Regions Financial | | Financials | 19.67 | 83 | 0.25% | 0.25% |
| EQR | Equity Residential | | Financials | 65.30 | 86 | 0.25% | 0.25% |
| SEE | Sealed Air | | Consumer Staples | 31.82 | 52 | 0.25% | 0.25% |
| LKQ | LKQ | | Consumer Staples | 43.75 | 32 | 0.25% | 0.25% |
| DFS | Discover Financial | | Financials | 128.00 | 75 | 0.23% | 0.23% |
| FWONK | Formula One | | Services & Goods | 69.58 | 76 | 0.22% | 0.22% |
| DNB | Dun & Bradstreet | | Technology | 9.37 | 50 | 0.21% | 0.21% |
| For chart view version of above stock list: Chart View ➞ 0 - 25 , 25 - 50 , 50 - 75 , 75 - 100 , 100 - 125 , 125 - 150 , 150 - 175 , 175 - 200 , 200 - 225 , 225 - 250 , 250 - 275 , 275 - 300 , 300 - 325 , 325 - 350 , 350 - 375 , 375 - 400 , 400 - 425 , 425 - 450 , 450 - 475 , 475 - 500 , 500 - 525 , 525 - 550 , 550 - 575 , 575 - 600 , 600 - 625 , 625 - 650 , 650 - 675 , 675 - 700 , 700 - 725 , 725 - 750 , 750 - 775 | ||
 | Click To Change The Sort Order: By Market Cap or Company Size Performance: Year-to-date, Week and Day |  |
|
Get the most comprehensive stock market coverage daily at 12Stocks.com ➞ Best Stocks Today ➞ Best Stocks Weekly ➞ Best Stocks Year-to-Date ➞ Best Stocks Trends ➞  Best Stocks Today 12Stocks.com Best Nasdaq Stocks ➞ Best S&P 500 Stocks ➞ Best Tech Stocks ➞ Best Biotech Stocks ➞ |
| Detailed Overview of Midcap Stocks |
| Midcap Technical Overview, Leaders & Laggards, Top Midcap ETF Funds & Detailed Midcap Stocks List, Charts, Trends & More |
| Midcap: Technical Analysis, Trends & YTD Performance | |
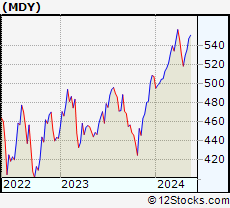
| MidCap segment as represented by
MDY, an exchange-traded fund [ETF], holds basket of about four hundred midcap stocks from across all major sectors of the US stock market. The midcap index (contains stocks like Green Mountain Coffee Roasters and Tractor Supply Company) is up by 4.91% and is currently underperforming the overall market by -1.65% year-to-date. Below is a quick view of technical charts and trends: | |
 MDY Weekly Chart |
|
| Long Term Trend: Very Good | |
| Medium Term Trend: Good | |
 MDY Daily Chart |
|
| Short Term Trend: Very Good | |
| Overall Trend Score: 70 | |
| YTD Performance: 4.91% | |
| **Trend Scores & Views Are Only For Educational Purposes And Not For Investing | |
| 12Stocks.com: Investing in Midcap Index using Exchange Traded Funds | |
|
The following table shows list of key exchange traded funds (ETF) that
help investors track Midcap index. The following list also includes leveraged ETF funds that track twice or thrice the daily returns of Midcap indices. Short or inverse ETF funds move in the opposite direction to the index they track and are useful during market pullbacks or during bear markets. Quick View: Move mouse or cursor over ETF symbol (ticker) to view short-term technical chart and over ETF name to view long term chart. Click on ticker or stock name for detailed view. Click on to add stock symbol to your watchlist and to view watchlist. |
12Stocks.com List of ETFs that track Midcap Index
| Ticker | ETF Name | Watchlist | Recent Price | Smart Investing & Trading Score | Change % | Week % | Year-to-date % |
| IJH | iShares Core S&P Mid-Cap | | 58.17 | 75 | 0.61 | 0.61 | 4.94% |
| IWR | iShares Russell Mid-Cap | | 80.98 | 75 | 0.57 | 0.57 | 4.18% |
| IWP | iShares Russell Mid-Cap Growth | | 109.47 | 78 | 0.45 | 0.45 | 4.8% |
| MDY | SPDR S&P MidCap 400 ETF | | 532.28 | 70 | 0.55 | 0.55 | 4.91% |
| IWS | iShares Russell Mid-Cap Value | | 120.76 | 75 | 0.64 | 0.64 | 3.84% |
| IJK | iShares S&P Mid-Cap 400 Growth | | 87.51 | 70 | 0.59 | 0.59 | 10.46% |
| IJJ | iShares S&P Mid-Cap 400 Value | | 112.85 | 88 | 0.55 | 0.55 | -1.04% |
| XMLV | PowerShares S&P MidCap Low Volatil ETF | | 54.94 | 83 | 0.53 | 0.53 | 3.31% |
| UMDD | ProShares UltraPro MidCap400 | | 24.32 | 78 | 1.50 | 1.5 | 8.96% |
| SMDD | ProShares UltraPro Short MidCap400 | | 11.65 | 10 | -1.52 | -1.52 | -13.47% |
| MYY | ProShares Short MidCap400 | | 20.71 | 25 | -0.38 | -0.38 | -3.47% |
| MZZ | ProShares UltraShort MidCap400 | | 11.58 | 20 | -0.86 | -0.86 | -7.88% |
| MVV | ProShares Ultra MidCap400 | | 61.81 | 83 | 0.61 | 0.61 | 6.76% |
| 12Stocks.com: Charts, Trends, Fundamental Data and Performances of MidCap Stocks | |
|
We now take in-depth look at all MidCap stocks including charts, multi-period performances and overall trends (as measured by Smart Investing & Trading Score). One can sort MidCap stocks (click link to choose) by Daily, Weekly and by Year-to-Date performances. Also, one can sort by size of the company or by market capitalization. |
| Select Your Default Chart Type: | |||||
| |||||
| Click on stock symbol or name for detailed view. Click on to add stock symbol to your watchlist and to view watchlist. Quick View: Move mouse or cursor over "Daily" to quickly view daily technical stock chart and over "Weekly" to view weekly technical stock chart. | |||||

 | VRSK Verisk Analytics, Inc. |
| Sector: Services & Goods | |
| SubSector: Business Services | |
| MarketCap: 22033.2 Millions | |
| Recent Price: 221.83 Smart Investing & Trading Score: 42 | |
| Day Percent Change: 0.31% Day Change: 0.69 | |
| Week Change: 0.31% Year-to-date Change: -7.1% | |
| VRSK Links: Profile News Message Board | |
| Charts:- Daily , Weekly | |
| Add VRSK to Watchlist: View: Get Complete VRSK Trend Analysis ➞ | |
 | ZI ZoomInfo Technologies Inc. |
| Sector: Technology | |
| SubSector: Software Application | |
| MarketCap: 15937 Millions | |
| Recent Price: 16.42 Smart Investing & Trading Score: 100 | |
| Day Percent Change: 0.31% Day Change: 0.05 | |
| Week Change: 0.31% Year-to-date Change: -11.2% | |
| ZI Links: Profile News Message Board | |
| Charts:- Daily , Weekly | |
| Add ZI to Watchlist: View: Get Complete ZI Trend Analysis ➞ | |
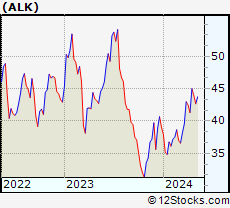 | ALK Alaska Air Group, Inc. |
| Sector: Transports | |
| SubSector: Regional Airlines | |
| MarketCap: 3772.5 Millions | |
| Recent Price: 44.09 Smart Investing & Trading Score: 71 | |
| Day Percent Change: 0.30% Day Change: 0.13 | |
| Week Change: 0.3% Year-to-date Change: 12.9% | |
| ALK Links: Profile News Message Board | |
| Charts:- Daily , Weekly | |
| Add ALK to Watchlist: View: Get Complete ALK Trend Analysis ➞ | |
 | ELS Equity LifeStyle Properties, Inc. |
| Sector: Financials | |
| SubSector: REIT - Residential | |
| MarketCap: 9570.61 Millions | |
| Recent Price: 60.71 Smart Investing & Trading Score: 42 | |
| Day Percent Change: 0.30% Day Change: 0.18 | |
| Week Change: 0.3% Year-to-date Change: -13.9% | |
| ELS Links: Profile News Message Board | |
| Charts:- Daily , Weekly | |
| Add ELS to Watchlist: View: Get Complete ELS Trend Analysis ➞ | |
 | WU The Western Union Company |
| Sector: Financials | |
| SubSector: Credit Services | |
| MarketCap: 7974.48 Millions | |
| Recent Price: 13.51 Smart Investing & Trading Score: 76 | |
| Day Percent Change: 0.30% Day Change: 0.04 | |
| Week Change: 0.3% Year-to-date Change: 13.3% | |
| WU Links: Profile News Message Board | |
| Charts:- Daily , Weekly | |
| Add WU to Watchlist: View: Get Complete WU Trend Analysis ➞ | |
 | EVR Evercore Inc. |
| Sector: Financials | |
| SubSector: Asset Management | |
| MarketCap: 1989.83 Millions | |
| Recent Price: 184.85 Smart Investing & Trading Score: 43 | |
| Day Percent Change: 0.30% Day Change: 0.56 | |
| Week Change: 0.3% Year-to-date Change: 8.1% | |
| EVR Links: Profile News Message Board | |
| Charts:- Daily , Weekly | |
| Add EVR to Watchlist: View: Get Complete EVR Trend Analysis ➞ | |
 | TRGP Targa Resources Corp. |
| Sector: Energy | |
| SubSector: Oil & Gas Pipelines | |
| MarketCap: 2210.65 Millions | |
| Recent Price: 117.20 Smart Investing & Trading Score: 83 | |
| Day Percent Change: 0.29% Day Change: 0.34 | |
| Week Change: 0.29% Year-to-date Change: 34.9% | |
| TRGP Links: Profile News Message Board | |
| Charts:- Daily , Weekly | |
| Add TRGP to Watchlist: View: Get Complete TRGP Trend Analysis ➞ | |
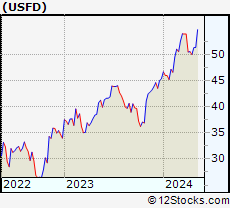 | USFD US Foods Holding Corp. |
| Sector: Consumer Staples | |
| SubSector: Food Wholesale | |
| MarketCap: 3740.99 Millions | |
| Recent Price: 51.50 Smart Investing & Trading Score: 85 | |
| Day Percent Change: 0.29% Day Change: 0.15 | |
| Week Change: 0.29% Year-to-date Change: 13.4% | |
| USFD Links: Profile News Message Board | |
| Charts:- Daily , Weekly | |
| Add USFD to Watchlist: View: Get Complete USFD Trend Analysis ➞ | |
 | AFG American Financial Group, Inc. |
| Sector: Financials | |
| SubSector: Property & Casualty Insurance | |
| MarketCap: 5353.82 Millions | |
| Recent Price: 127.70 Smart Investing & Trading Score: 68 | |
| Day Percent Change: 0.28% Day Change: 0.36 | |
| Week Change: 0.28% Year-to-date Change: 7.4% | |
| AFG Links: Profile News Message Board | |
| Charts:- Daily , Weekly | |
| Add AFG to Watchlist: View: Get Complete AFG Trend Analysis ➞ | |
 | HRL Hormel Foods Corporation |
| Sector: Consumer Staples | |
| SubSector: Meat Products | |
| MarketCap: 25590.2 Millions | |
| Recent Price: 35.42 Smart Investing & Trading Score: 81 | |
| Day Percent Change: 0.28% Day Change: 0.10 | |
| Week Change: 0.28% Year-to-date Change: 10.3% | |
| HRL Links: Profile News Message Board | |
| Charts:- Daily , Weekly | |
| Add HRL to Watchlist: View: Get Complete HRL Trend Analysis ➞ | |
 | ARMK Aramark |
| Sector: Services & Goods | |
| SubSector: Specialty Eateries | |
| MarketCap: 5242.27 Millions | |
| Recent Price: 32.44 Smart Investing & Trading Score: 83 | |
| Day Percent Change: 0.28% Day Change: 0.09 | |
| Week Change: 0.28% Year-to-date Change: 15.4% | |
| ARMK Links: Profile News Message Board | |
| Charts:- Daily , Weekly | |
| Add ARMK to Watchlist: View: Get Complete ARMK Trend Analysis ➞ | |
 | FITB Fifth Third Bancorp |
| Sector: Financials | |
| SubSector: Regional - Midwest Banks | |
| MarketCap: 10197 Millions | |
| Recent Price: 37.00 Smart Investing & Trading Score: 81 | |
| Day Percent Change: 0.27% Day Change: 0.10 | |
| Week Change: 0.27% Year-to-date Change: 7.3% | |
| FITB Links: Profile News Message Board | |
| Charts:- Daily , Weekly | |
| Add FITB to Watchlist: View: Get Complete FITB Trend Analysis ➞ | |
 | RYAN Ryan Specialty Holdings, Inc. |
| Sector: Financials | |
| SubSector: Insurance - Specialty | |
| MarketCap: 11630 Millions | |
| Recent Price: 49.07 Smart Investing & Trading Score: 26 | |
| Day Percent Change: 0.27% Day Change: 0.13 | |
| Week Change: 0.27% Year-to-date Change: 14.0% | |
| RYAN Links: Profile News Message Board | |
| Charts:- Daily , Weekly | |
| Add RYAN to Watchlist: View: Get Complete RYAN Trend Analysis ➞ | |
 | MPWR Monolithic Power Systems, Inc. |
| Sector: Technology | |
| SubSector: Semiconductor - Specialized | |
| MarketCap: 6436.4 Millions | |
| Recent Price: 679.05 Smart Investing & Trading Score: 95 | |
| Day Percent Change: 0.27% Day Change: 1.82 | |
| Week Change: 0.27% Year-to-date Change: 7.7% | |
| MPWR Links: Profile News Message Board | |
| Charts:- Daily , Weekly | |
| Add MPWR to Watchlist: View: Get Complete MPWR Trend Analysis ➞ | |
 | IPGP IPG Photonics Corporation |
| Sector: Technology | |
| SubSector: Semiconductor Equipment & Materials | |
| MarketCap: 6059.38 Millions | |
| Recent Price: 88.64 Smart Investing & Trading Score: 64 | |
| Day Percent Change: 0.27% Day Change: 0.24 | |
| Week Change: 0.27% Year-to-date Change: -18.3% | |
| IPGP Links: Profile News Message Board | |
| Charts:- Daily , Weekly | |
| Add IPGP to Watchlist: View: Get Complete IPGP Trend Analysis ➞ | |
 | WWD Woodward, Inc. |
| Sector: Industrials | |
| SubSector: Aerospace/Defense Products & Services | |
| MarketCap: 3764.01 Millions | |
| Recent Price: 150.98 Smart Investing & Trading Score: 85 | |
| Day Percent Change: 0.27% Day Change: 0.40 | |
| Week Change: 0.27% Year-to-date Change: 10.9% | |
| WWD Links: Profile News Message Board | |
| Charts:- Daily , Weekly | |
| Add WWD to Watchlist: View: Get Complete WWD Trend Analysis ➞ | |
 | PWR Quanta Services, Inc. |
| Sector: Industrials | |
| SubSector: General Contractors | |
| MarketCap: 3936.63 Millions | |
| Recent Price: 262.34 Smart Investing & Trading Score: 90 | |
| Day Percent Change: 0.26% Day Change: 0.68 | |
| Week Change: 0.26% Year-to-date Change: 21.6% | |
| PWR Links: Profile News Message Board | |
| Charts:- Daily , Weekly | |
| Add PWR to Watchlist: View: Get Complete PWR Trend Analysis ➞ | |
 | DD DuPont de Nemours, Inc. |
| Sector: Materials | |
| SubSector: Agricultural Chemicals | |
| MarketCap: 25631.6 Millions | |
| Recent Price: 73.90 Smart Investing & Trading Score: 68 | |
| Day Percent Change: 0.26% Day Change: 0.19 | |
| Week Change: 0.26% Year-to-date Change: -3.9% | |
| DD Links: Profile News Message Board | |
| Charts:- Daily , Weekly | |
| Add DD to Watchlist: View: Get Complete DD Trend Analysis ➞ | |
 | RF Regions Financial Corporation |
| Sector: Financials | |
| SubSector: Regional - Southeast Banks | |
| MarketCap: 8936.25 Millions | |
| Recent Price: 19.67 Smart Investing & Trading Score: 83 | |
| Day Percent Change: 0.25% Day Change: 0.05 | |
| Week Change: 0.25% Year-to-date Change: 1.5% | |
| RF Links: Profile News Message Board | |
| Charts:- Daily , Weekly | |
| Add RF to Watchlist: View: Get Complete RF Trend Analysis ➞ | |
 | EQR Equity Residential |
| Sector: Financials | |
| SubSector: REIT - Residential | |
| MarketCap: 22061.9 Millions | |
| Recent Price: 65.30 Smart Investing & Trading Score: 86 | |
| Day Percent Change: 0.25% Day Change: 0.16 | |
| Week Change: 0.25% Year-to-date Change: 6.8% | |
| EQR Links: Profile News Message Board | |
| Charts:- Daily , Weekly | |
| Add EQR to Watchlist: View: Get Complete EQR Trend Analysis ➞ | |
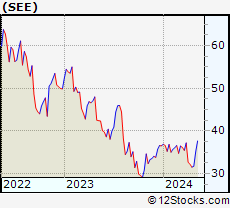 | SEE Sealed Air Corporation |
| Sector: Consumer Staples | |
| SubSector: Packaging & Containers | |
| MarketCap: 4037.23 Millions | |
| Recent Price: 31.82 Smart Investing & Trading Score: 52 | |
| Day Percent Change: 0.25% Day Change: 0.08 | |
| Week Change: 0.25% Year-to-date Change: -12.9% | |
| SEE Links: Profile News Message Board | |
| Charts:- Daily , Weekly | |
| Add SEE to Watchlist: View: Get Complete SEE Trend Analysis ➞ | |
 | LKQ LKQ Corporation |
| Sector: Consumer Staples | |
| SubSector: Auto Parts | |
| MarketCap: 5633.79 Millions | |
| Recent Price: 43.75 Smart Investing & Trading Score: 32 | |
| Day Percent Change: 0.25% Day Change: 0.11 | |
| Week Change: 0.25% Year-to-date Change: -8.5% | |
| LKQ Links: Profile News Message Board | |
| Charts:- Daily , Weekly | |
| Add LKQ to Watchlist: View: Get Complete LKQ Trend Analysis ➞ | |
 | DFS Discover Financial Services |
| Sector: Financials | |
| SubSector: Credit Services | |
| MarketCap: 9228.88 Millions | |
| Recent Price: 128.00 Smart Investing & Trading Score: 75 | |
| Day Percent Change: 0.23% Day Change: 0.30 | |
| Week Change: 0.23% Year-to-date Change: 13.9% | |
| DFS Links: Profile News Message Board | |
| Charts:- Daily , Weekly | |
| Add DFS to Watchlist: View: Get Complete DFS Trend Analysis ➞ | |
 | FWONK Formula One Group |
| Sector: Services & Goods | |
| SubSector: Broadcasting - TV | |
| MarketCap: 4677.53 Millions | |
| Recent Price: 69.58 Smart Investing & Trading Score: 76 | |
| Day Percent Change: 0.22% Day Change: 0.15 | |
| Week Change: 0.22% Year-to-date Change: 10.2% | |
| FWONK Links: Profile News Message Board | |
| Charts:- Daily , Weekly | |
| Add FWONK to Watchlist: View: Get Complete FWONK Trend Analysis ➞ | |
 | DNB Dun & Bradstreet Holdings, Inc. |
| Sector: Technology | |
| SubSector: Information Technology Services | |
| MarketCap: 10887 Millions | |
| Recent Price: 9.37 Smart Investing & Trading Score: 50 | |
| Day Percent Change: 0.21% Day Change: 0.02 | |
| Week Change: 0.21% Year-to-date Change: -19.9% | |
| DNB Links: Profile News Message Board | |
| Charts:- Daily , Weekly | |
| Add DNB to Watchlist: View: Get Complete DNB Trend Analysis ➞ | |
| For tabular summary view of above stock list: Summary View ➞ 0 - 25 , 25 - 50 , 50 - 75 , 75 - 100 , 100 - 125 , 125 - 150 , 150 - 175 , 175 - 200 , 200 - 225 , 225 - 250 , 250 - 275 , 275 - 300 , 300 - 325 , 325 - 350 , 350 - 375 , 375 - 400 , 400 - 425 , 425 - 450 , 450 - 475 , 475 - 500 , 500 - 525 , 525 - 550 , 550 - 575 , 575 - 600 , 600 - 625 , 625 - 650 , 650 - 675 , 675 - 700 , 700 - 725 , 725 - 750 , 750 - 775 | ||
| Click To Change The Sort Order: By Market Cap or Company Size Performance: Year-to-date, Week and Day | |
| Select Chart Type: | ||
|
Best Stocks Today 12Stocks.com |
© 2024 12Stocks.com Terms & Conditions Privacy Contact Us
All Information Provided Only For Education And Not To Be Used For Investing or Trading. See Terms & Conditions


One More Thing ... Get Best Stocks Delivered Daily!
Never Ever Miss A Move With Our Top Ten Stocks Lists
Find Best Stocks In Any Market - Bull or Bear Market
Take A Peek At Our Top Ten Stocks Lists: Daily, Weekly, Year-to-Date & Top Trends
Find Best Stocks In Any Market - Bull or Bear Market
Take A Peek At Our Top Ten Stocks Lists: Daily, Weekly, Year-to-Date & Top Trends
Midcap Stocks With Best Up Trends [0-bearish to 100-bullish]: Albemarle [100], Domino s[100], Tandem Diabetes[100], Quest Diagnostics[100], AES [100], Teradyne [100], Carrier Global[100], Skyworks Solutions[100], LPL Financial[100], Perrigo [100], Highwoods Properties[100]
Best Midcap Stocks Year-to-Date:
Vistra Energy[100.05%], AppLovin [83.38%], ShockWave Medical[73.32%], EMCOR [68.8%], CAVA [62.35%], Constellation Energy[60.98%], Spotify [53.34%], Antero Resources[51.23%], Natera [50.19%], Wingstop [50.09%], Pure Storage[47.03%] Best Midcap Stocks This Week:
Ginkgo Bioworks[15.08%], Hertz Global[7.81%], Albemarle [7.57%], Vistra Energy[6%], Medical Properties[5.99%], Domino s[5.62%], Liberty SiriusXM[5.49%], Liberty SiriusXM[5.32%], Sirius XM[5.3%], Tandem Diabetes[5.19%], Paper[4.4%] Best Midcap Stocks Daily:
Ginkgo Bioworks[15.08%], Hertz Global[7.81%], Albemarle [7.57%], Vistra Energy[6.00%], Medical Properties[5.99%], Domino s[5.62%], Liberty SiriusXM[5.49%], Liberty SiriusXM[5.32%], Sirius XM[5.30%], Tandem Diabetes[5.19%], Paper[4.40%]