
 Login Sign Up


| |||||
 |  | ||||

| 12Stocks.com Market Intelligence |
Best Financial Stocks
| In a hurry? Financial Stocks Lists: Performance Trends Table, Stock Charts
Sort Financial stocks: Daily, Weekly, Year-to-Date, Market Cap & Trends. Filter Financial stocks list by size:All Financial Large Mid-Range Small & MicroCap |
| 12Stocks.com Financial Stocks Performances & Trends Daily | |||||||||
|
|  The overall Smart Investing & Trading Score is 46 (0-bearish to 100-bullish) which puts Financial sector in short term neutral trend. The Smart Investing & Trading Score from previous trading session is 58 and hence a deterioration of trend.
| ||||||||
Here are the Smart Investing & Trading Scores of the most requested Financial stocks at 12Stocks.com (click stock name for detailed review):
|


| 12Stocks.com: Investing in Financial sector with Stocks | |
|
The following table helps investors and traders sort through current performance and trends (as measured by Smart Investing & Trading Score) of various
stocks in the Financial sector. Quick View: Move mouse or cursor over stock symbol (ticker) to view short-term Technical chart and over stock name to view long term chart. Click on  to add stock symbol to your watchlist and to add stock symbol to your watchlist and  to view watchlist. Click on any ticker or stock name for detailed market intelligence report for that stock. to view watchlist. Click on any ticker or stock name for detailed market intelligence report for that stock. |
12Stocks.com Performance of Stocks in Financial Sector
| Ticker | Stock Name | Watchlist | Category | Recent Price | Smart Investing & Trading Score | Change % | YTD Change% |
| CNNE | Cannae |   | Asset Mgmt | 19.45 | 18 | -2.75 | -0.31% |
| IBTX | Independent Bank | | Regional Banks | 37.22 | 0 | -2.79 | -26.85% |
| LDI | loanDepot | | Mortgage Finance | 2.08 | 0 | -2.80 | -42.86% |
| RWT | Redwood Trust | | Mortgage | 5.53 | 28 | -2.81 | -25.37% |
| PLD | Prologis | | REIT - Industrial | 102.05 | 18 | -2.82 | -23.44% |
| AJX | Great Ajax | | Mortgage | 3.45 | 30 | -2.82 | -34.91% |
| CACC | Credit Acceptance | | Credit Services | 513.95 | 25 | -2.84 | -3.53% |
| MSBI | Midland States | | Regional Banks | 21.86 | 0 | -2.84 | -20.68% |
| MOON | Direxion Moonshot | | Exchange Traded Fund | 9.14 | 42 | -2.87 | -19.68% |
| DCOM | Dime Community | | S&L | 18.21 | 35 | -2.88 | -32.38% |
| CIB | Bancolombia S.A | | Foreign Banks | 32.72 | 58 | -2.88 | 6.34% |
| ITUB | Itau Unibanco | | Foreign Banks | 6.05 | 15 | -2.89 | -12.95% |
| CMTG | Claros Mortgage | | REIT - Mortgage | 8.70 | 57 | -2.90 | -37.30% |
| BHLB | Berkshire Hills | | S&L | 21.32 | 35 | -2.91 | -14.14% |
| JBGS | JBG SMITH | | Property Mgmt | 15.01 | 62 | -2.91 | -11.76% |
| INTR | Inter & Co | | Banks - Regional | 5.01 | 51 | -2.91 | -10.62% |
| BLX | Banco Latinoamericano | | Foreign Banks | 28.41 | 31 | -2.94 | 14.83% |
| GPMT | Granite Point | | Mortgage | 4.29 | 28 | -2.94 | -27.78% |
| SPG | Simon Property | | REIT - Retail | 140.53 | 33 | -2.97 | -1.48% |
| OPY | Oppenheimer | | Brokerage | 40.05 | 93 | -2.98 | -3.07% |
| ACRE | Ares Commercial | | Mortgage | 6.79 | 50 | -3.00 | -34.46% |
| STWD | Starwood Property | | Mortgage | 18.97 | 8 | -3.07 | -9.75% |
| FPH | Five Point | | REIT - | 2.84 | 10 | -3.07 | -7.49% |
| LU | Lufax Holding | | Credit Services | 4.39 | 51 | -3.09 | 43.00% |
| PEB | Pebblebrook Hotel | | REIT | 14.53 | 15 | -3.13 | -9.07% |
| For chart view version of above stock list: Chart View ➞ 0 - 25 , 25 - 50 , 50 - 75 , 75 - 100 , 100 - 125 , 125 - 150 , 150 - 175 , 175 - 200 , 200 - 225 , 225 - 250 , 250 - 275 , 275 - 300 , 300 - 325 , 325 - 350 , 350 - 375 , 375 - 400 , 400 - 425 , 425 - 450 , 450 - 475 , 475 - 500 , 500 - 525 , 525 - 550 , 550 - 575 , 575 - 600 , 600 - 625 , 625 - 650 , 650 - 675 , 675 - 700 , 700 - 725 , 725 - 750 , 750 - 775 , 775 - 800 , 800 - 825 , 825 - 850 , 850 - 875 , 875 - 900 , 900 - 925 , 925 - 950 , 950 - 975 , 975 - 1000 , 1000 - 1025 , 1025 - 1050 , 1050 - 1075 , 1075 - 1100 , 1100 - 1125 , 1125 - 1150 , 1150 - 1175 , 1175 - 1200 , 1200 - 1225 , 1225 - 1250 | ||
 | Click To Change The Sort Order: By Market Cap or Company Size Performance: Year-to-date, Week and Day |  |
|
Get the most comprehensive stock market coverage daily at 12Stocks.com ➞ Best Stocks Today ➞ Best Stocks Weekly ➞ Best Stocks Year-to-Date ➞ Best Stocks Trends ➞  Best Stocks Today 12Stocks.com Best Nasdaq Stocks ➞ Best S&P 500 Stocks ➞ Best Tech Stocks ➞ Best Biotech Stocks ➞ |
| Detailed Overview of Financial Stocks |
| Financial Technical Overview, Leaders & Laggards, Top Financial ETF Funds & Detailed Financial Stocks List, Charts, Trends & More |
| Financial Sector: Technical Analysis, Trends & YTD Performance | |
| Financial sector is composed of stocks
from banks, brokers, insurance, REITs
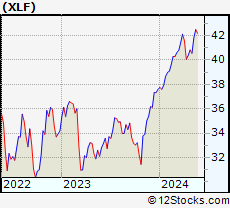
and services subsectors. Financial sector, as represented by XLF, an exchange-traded fund [ETF] that holds basket of Financial stocks (e.g, Bank of America, Goldman Sachs) is up by 7.34% and is currently outperforming the overall market by 2.54% year-to-date. Below is a quick view of Technical charts and trends: |
|
 XLF Weekly Chart |
|
| Long Term Trend: Very Good | |
| Medium Term Trend: Good | |
 XLF Daily Chart |
|
| Short Term Trend: Not Good | |
| Overall Trend Score: 46 | |
| YTD Performance: 7.34% | |
| **Trend Scores & Views Are Only For Educational Purposes And Not For Investing | |
| 12Stocks.com: Top Performing Financial Sector Stocks | ||||||||||||||||||||||||||||||||||||||||||||||||
 The top performing Financial sector stocks year to date are
Now, more recently, over last week, the top performing Financial sector stocks on the move are


|
||||||||||||||||||||||||||||||||||||||||||||||||
| 12Stocks.com: Investing in Financial Sector using Exchange Traded Funds | |
|
The following table shows list of key exchange traded funds (ETF) that
help investors track Financial Index. For detailed view, check out our ETF Funds section of our website. Quick View: Move mouse or cursor over ETF symbol (ticker) to view short-term Technical chart and over ETF name to view long term chart. Click on ticker or stock name for detailed view. Click on to add stock symbol to your watchlist and to view watchlist. |
12Stocks.com List of ETFs that track Financial Index
| Ticker | ETF Name | Watchlist | Recent Price | Smart Investing & Trading Score | Change % | Week % | Year-to-date % |
| XLF | Financial | | 40.36 | 46 | -0.98 | -1.13 | 7.34% |
| IAI | Broker-Dealers & Secs | | 111.37 | 53 | -1.36 | -1.45 | 2.62% |
| IYF | Financials | | 91.36 | 56 | -0.86 | -0.87 | 6.97% |
| IYG | Financial Services | | 63.93 | 51 | -0.64 | -1.05 | 7.02% |
| KRE | Regional Banking | | 46.99 | 35 | -1.63 | -2.49 | -10.38% |
| IXG | Global Financials | | 83.67 | 76 | -0.81 | -0.62 | 6.48% |
| VFH | Financials | | 97.75 | 51 | -1.00 | -1.19 | 5.95% |
| KBE | Bank | | 44.32 | 45 | -1.73 | -2.23 | -3.69% |
| FAS | Financial Bull 3X | | 97.42 | 46 | -2.90 | -3.19 | 17.87% |
| FAZ | Financial Bear 3X | | 11.25 | 49 | 2.93 | 3.59 | -17.7% |
| UYG | Financials | | 62.21 | 46 | -1.91 | -2.26 | 12.7% |
| IAT | Regional Banks | | 40.95 | 58 | -1.50 | -1.86 | -2.14% |
| KIE | Insurance | | 48.58 | 41 | -0.43 | 0.1 | 7.43% |
| PSCF | SmallCap Financials | | 45.90 | 40 | -0.94 | -0.99 | -6.67% |
| EUFN | Europe Financials | | 22.25 | 76 | -1.11 | -0.93 | 6.15% |
| PGF | Financial Preferred | | 14.49 | 32 | -1.02 | -0.55 | -0.62% |
| 12Stocks.com: Charts, Trends, Fundamental Data and Performances of Financial Stocks | |
|
We now take in-depth look at all Financial stocks including charts, multi-period performances and overall trends (as measured by Smart Investing & Trading Score). One can sort Financial stocks (click link to choose) by Daily, Weekly and by Year-to-Date performances. Also, one can sort by size of the company or by market capitalization. |
| Select Your Default Chart Type: | |||||
| |||||
| Click on stock symbol or name for detailed view. Click on to add stock symbol to your watchlist and to view watchlist. Quick View: Move mouse or cursor over "Daily" to quickly view daily Technical stock chart and over "Weekly" to view weekly Technical stock chart. | |||||

 | CNNE Cannae Holdings, Inc. |
| Sector: Financials | |
| SubSector: Asset Management | |
| MarketCap: 2625.53 Millions | |
| Recent Price: 19.45 Smart Investing & Trading Score: 18 | |
| Day Percent Change: -2.75% Day Change: -0.55 | |
| Week Change: -2.7% Year-to-date Change: -0.3% | |
| CNNE Links: Profile News Message Board | |
| Charts:- Daily , Weekly | |
| Add CNNE to Watchlist: View: Get Complete CNNE Trend Analysis ➞ | |
 | IBTX Independent Bank Group, Inc. |
| Sector: Financials | |
| SubSector: Regional - Southeast Banks | |
| MarketCap: 1133.35 Millions | |
| Recent Price: 37.22 Smart Investing & Trading Score: 0 | |
| Day Percent Change: -2.79% Day Change: -1.07 | |
| Week Change: -5.39% Year-to-date Change: -26.9% | |
| IBTX Links: Profile News Message Board | |
| Charts:- Daily , Weekly | |
| Add IBTX to Watchlist: View: Get Complete IBTX Trend Analysis ➞ | |
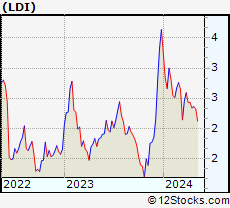 | LDI loanDepot, Inc. |
| Sector: Financials | |
| SubSector: Mortgage Finance | |
| MarketCap: 671 Millions | |
| Recent Price: 2.08 Smart Investing & Trading Score: 0 | |
| Day Percent Change: -2.80% Day Change: -0.06 | |
| Week Change: -11.86% Year-to-date Change: -42.9% | |
| LDI Links: Profile News Message Board | |
| Charts:- Daily , Weekly | |
| Add LDI to Watchlist: View: Get Complete LDI Trend Analysis ➞ | |
 | RWT Redwood Trust, Inc. |
| Sector: Financials | |
| SubSector: Mortgage Investment | |
| MarketCap: 674.739 Millions | |
| Recent Price: 5.53 Smart Investing & Trading Score: 28 | |
| Day Percent Change: -2.81% Day Change: -0.16 | |
| Week Change: -3.32% Year-to-date Change: -25.4% | |
| RWT Links: Profile News Message Board | |
| Charts:- Daily , Weekly | |
| Add RWT to Watchlist: View: Get Complete RWT Trend Analysis ➞ | |
 | PLD Prologis, Inc. |
| Sector: Financials | |
| SubSector: REIT - Industrial | |
| MarketCap: 48728.9 Millions | |
| Recent Price: 102.05 Smart Investing & Trading Score: 18 | |
| Day Percent Change: -2.82% Day Change: -2.96 | |
| Week Change: -1.93% Year-to-date Change: -23.4% | |
| PLD Links: Profile News Message Board | |
| Charts:- Daily , Weekly | |
| Add PLD to Watchlist: View: Get Complete PLD Trend Analysis ➞ | |
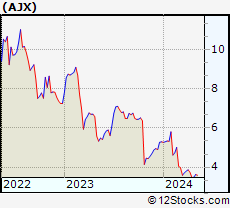 | AJX Great Ajax Corp. |
| Sector: Financials | |
| SubSector: Mortgage Investment | |
| MarketCap: 154.539 Millions | |
| Recent Price: 3.45 Smart Investing & Trading Score: 30 | |
| Day Percent Change: -2.82% Day Change: -0.10 | |
| Week Change: -1.15% Year-to-date Change: -34.9% | |
| AJX Links: Profile News Message Board | |
| Charts:- Daily , Weekly | |
| Add AJX to Watchlist: View: Get Complete AJX Trend Analysis ➞ | |
 | CACC Credit Acceptance Corporation |
| Sector: Financials | |
| SubSector: Credit Services | |
| MarketCap: 5219.28 Millions | |
| Recent Price: 513.95 Smart Investing & Trading Score: 25 | |
| Day Percent Change: -2.84% Day Change: -15.05 | |
| Week Change: -2.4% Year-to-date Change: -3.5% | |
| CACC Links: Profile News Message Board | |
| Charts:- Daily , Weekly | |
| Add CACC to Watchlist: View: Get Complete CACC Trend Analysis ➞ | |
 | MSBI Midland States Bancorp, Inc. |
| Sector: Financials | |
| SubSector: Regional - Midwest Banks | |
| MarketCap: 400.27 Millions | |
| Recent Price: 21.86 Smart Investing & Trading Score: 0 | |
| Day Percent Change: -2.84% Day Change: -0.64 | |
| Week Change: -2.24% Year-to-date Change: -20.7% | |
| MSBI Links: Profile News Message Board | |
| Charts:- Daily , Weekly | |
| Add MSBI to Watchlist: View: Get Complete MSBI Trend Analysis ➞ | |
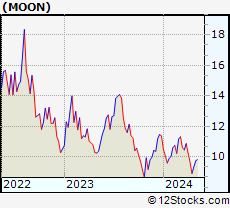 | MOON Direxion Moonshot Innovators ETF |
| Sector: Financials | |
| SubSector: Exchange Traded Fund | |
| MarketCap: 60157 Millions | |
| Recent Price: 9.14 Smart Investing & Trading Score: 42 | |
| Day Percent Change: -2.87% Day Change: -0.27 | |
| Week Change: -1.93% Year-to-date Change: -19.7% | |
| MOON Links: Profile News Message Board | |
| Charts:- Daily , Weekly | |
| Add MOON to Watchlist: View: Get Complete MOON Trend Analysis ➞ | |
 | DCOM Dime Community Bancshares, Inc. |
| Sector: Financials | |
| SubSector: Savings & Loans | |
| MarketCap: 477.83 Millions | |
| Recent Price: 18.21 Smart Investing & Trading Score: 35 | |
| Day Percent Change: -2.88% Day Change: -0.54 | |
| Week Change: -4.56% Year-to-date Change: -32.4% | |
| DCOM Links: Profile News Message Board | |
| Charts:- Daily , Weekly | |
| Add DCOM to Watchlist: View: Get Complete DCOM Trend Analysis ➞ | |
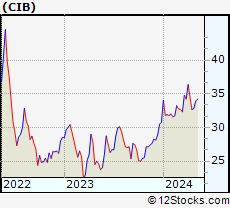 | CIB Bancolombia S.A. |
| Sector: Financials | |
| SubSector: Foreign Regional Banks | |
| MarketCap: 5031.99 Millions | |
| Recent Price: 32.72 Smart Investing & Trading Score: 58 | |
| Day Percent Change: -2.88% Day Change: -0.97 | |
| Week Change: -0.3% Year-to-date Change: 6.3% | |
| CIB Links: Profile News Message Board | |
| Charts:- Daily , Weekly | |
| Add CIB to Watchlist: View: Get Complete CIB Trend Analysis ➞ | |
 | ITUB Itau Unibanco Holding S.A. |
| Sector: Financials | |
| SubSector: Foreign Regional Banks | |
| MarketCap: 48121 Millions | |
| Recent Price: 6.05 Smart Investing & Trading Score: 15 | |
| Day Percent Change: -2.89% Day Change: -0.18 | |
| Week Change: -3.97% Year-to-date Change: -13.0% | |
| ITUB Links: Profile News Message Board | |
| Charts:- Daily , Weekly | |
| Add ITUB to Watchlist: View: Get Complete ITUB Trend Analysis ➞ | |
 | CMTG Claros Mortgage Trust, Inc. |
| Sector: Financials | |
| SubSector: REIT - Mortgage | |
| MarketCap: 1610 Millions | |
| Recent Price: 8.70 Smart Investing & Trading Score: 57 | |
| Day Percent Change: -2.90% Day Change: -0.26 | |
| Week Change: -0.11% Year-to-date Change: -37.3% | |
| CMTG Links: Profile News Message Board | |
| Charts:- Daily , Weekly | |
| Add CMTG to Watchlist: View: Get Complete CMTG Trend Analysis ➞ | |
 | BHLB Berkshire Hills Bancorp, Inc. |
| Sector: Financials | |
| SubSector: Savings & Loans | |
| MarketCap: 686.33 Millions | |
| Recent Price: 21.32 Smart Investing & Trading Score: 35 | |
| Day Percent Change: -2.91% Day Change: -0.64 | |
| Week Change: -3.53% Year-to-date Change: -14.1% | |
| BHLB Links: Profile News Message Board | |
| Charts:- Daily , Weekly | |
| Add BHLB to Watchlist: View: Get Complete BHLB Trend Analysis ➞ | |
 | JBGS JBG SMITH Properties |
| Sector: Financials | |
| SubSector: Property Management | |
| MarketCap: 4335.32 Millions | |
| Recent Price: 15.01 Smart Investing & Trading Score: 62 | |
| Day Percent Change: -2.91% Day Change: -0.45 | |
| Week Change: -0.79% Year-to-date Change: -11.8% | |
| JBGS Links: Profile News Message Board | |
| Charts:- Daily , Weekly | |
| Add JBGS to Watchlist: View: Get Complete JBGS Trend Analysis ➞ | |
 | INTR Inter & Co, Inc. |
| Sector: Financials | |
| SubSector: Banks - Regional | |
| MarketCap: 1250 Millions | |
| Recent Price: 5.01 Smart Investing & Trading Score: 51 | |
| Day Percent Change: -2.91% Day Change: -0.15 | |
| Week Change: -3.65% Year-to-date Change: -10.6% | |
| INTR Links: Profile News Message Board | |
| Charts:- Daily , Weekly | |
| Add INTR to Watchlist: View: Get Complete INTR Trend Analysis ➞ | |
 | BLX Banco Latinoamericano de Comercio Exterior, S.A |
| Sector: Financials | |
| SubSector: Foreign Money Center Banks | |
| MarketCap: 390.471 Millions | |
| Recent Price: 28.41 Smart Investing & Trading Score: 31 | |
| Day Percent Change: -2.94% Day Change: -0.86 | |
| Week Change: -3.96% Year-to-date Change: 14.8% | |
| BLX Links: Profile News Message Board | |
| Charts:- Daily , Weekly | |
| Add BLX to Watchlist: View: Get Complete BLX Trend Analysis ➞ | |
 | GPMT Granite Point Mortgage Trust Inc. |
| Sector: Financials | |
| SubSector: Mortgage Investment | |
| MarketCap: 289.739 Millions | |
| Recent Price: 4.29 Smart Investing & Trading Score: 28 | |
| Day Percent Change: -2.94% Day Change: -0.13 | |
| Week Change: -2.28% Year-to-date Change: -27.8% | |
| GPMT Links: Profile News Message Board | |
| Charts:- Daily , Weekly | |
| Add GPMT to Watchlist: View: Get Complete GPMT Trend Analysis ➞ | |
 | SPG Simon Property Group, Inc. |
| Sector: Financials | |
| SubSector: REIT - Retail | |
| MarketCap: 17959.6 Millions | |
| Recent Price: 140.53 Smart Investing & Trading Score: 33 | |
| Day Percent Change: -2.97% Day Change: -4.30 | |
| Week Change: -1.29% Year-to-date Change: -1.5% | |
| SPG Links: Profile News Message Board | |
| Charts:- Daily , Weekly | |
| Add SPG to Watchlist: View: Get Complete SPG Trend Analysis ➞ | |
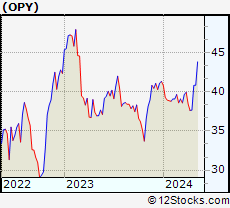 | OPY Oppenheimer Holdings Inc. |
| Sector: Financials | |
| SubSector: Investment Brokerage - Regional | |
| MarketCap: 243.565 Millions | |
| Recent Price: 40.05 Smart Investing & Trading Score: 93 | |
| Day Percent Change: -2.98% Day Change: -1.23 | |
| Week Change: -1.84% Year-to-date Change: -3.1% | |
| OPY Links: Profile News Message Board | |
| Charts:- Daily , Weekly | |
| Add OPY to Watchlist: View: Get Complete OPY Trend Analysis ➞ | |
 | ACRE Ares Commercial Real Estate Corporation |
| Sector: Financials | |
| SubSector: Mortgage Investment | |
| MarketCap: 242.339 Millions | |
| Recent Price: 6.79 Smart Investing & Trading Score: 50 | |
| Day Percent Change: -3.00% Day Change: -0.21 | |
| Week Change: -0.88% Year-to-date Change: -34.5% | |
| ACRE Links: Profile News Message Board | |
| Charts:- Daily , Weekly | |
| Add ACRE to Watchlist: View: Get Complete ACRE Trend Analysis ➞ | |
 | STWD Starwood Property Trust, Inc. |
| Sector: Financials | |
| SubSector: Mortgage Investment | |
| MarketCap: 3447.09 Millions | |
| Recent Price: 18.97 Smart Investing & Trading Score: 8 | |
| Day Percent Change: -3.07% Day Change: -0.60 | |
| Week Change: -2.72% Year-to-date Change: -9.8% | |
| STWD Links: Profile News Message Board | |
| Charts:- Daily , Weekly | |
| Add STWD to Watchlist: View: Get Complete STWD Trend Analysis ➞ | |
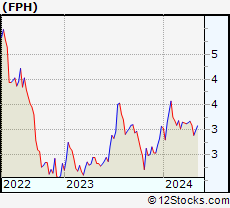 | FPH Five Point Holdings, LLC |
| Sector: Financials | |
| SubSector: REIT - Diversified | |
| MarketCap: 339.953 Millions | |
| Recent Price: 2.84 Smart Investing & Trading Score: 10 | |
| Day Percent Change: -3.07% Day Change: -0.09 | |
| Week Change: -1.73% Year-to-date Change: -7.5% | |
| FPH Links: Profile News Message Board | |
| Charts:- Daily , Weekly | |
| Add FPH to Watchlist: View: Get Complete FPH Trend Analysis ➞ | |
 | LU Lufax Holding Ltd |
| Sector: Financials | |
| SubSector: Credit Services | |
| MarketCap: 33457 Millions | |
| Recent Price: 4.39 Smart Investing & Trading Score: 51 | |
| Day Percent Change: -3.09% Day Change: -0.14 | |
| Week Change: -6.2% Year-to-date Change: 43.0% | |
| LU Links: Profile News Message Board | |
| Charts:- Daily , Weekly | |
| Add LU to Watchlist: View: Get Complete LU Trend Analysis ➞ | |
 | PEB Pebblebrook Hotel Trust |
| Sector: Financials | |
| SubSector: REIT - Hotel/Motel | |
| MarketCap: 1472.84 Millions | |
| Recent Price: 14.53 Smart Investing & Trading Score: 15 | |
| Day Percent Change: -3.13% Day Change: -0.47 | |
| Week Change: -2.87% Year-to-date Change: -9.1% | |
| PEB Links: Profile News Message Board | |
| Charts:- Daily , Weekly | |
| Add PEB to Watchlist: View: Get Complete PEB Trend Analysis ➞ | |
| For tabular summary view of above stock list: Summary View ➞ 0 - 25 , 25 - 50 , 50 - 75 , 75 - 100 , 100 - 125 , 125 - 150 , 150 - 175 , 175 - 200 , 200 - 225 , 225 - 250 , 250 - 275 , 275 - 300 , 300 - 325 , 325 - 350 , 350 - 375 , 375 - 400 , 400 - 425 , 425 - 450 , 450 - 475 , 475 - 500 , 500 - 525 , 525 - 550 , 550 - 575 , 575 - 600 , 600 - 625 , 625 - 650 , 650 - 675 , 675 - 700 , 700 - 725 , 725 - 750 , 750 - 775 , 775 - 800 , 800 - 825 , 825 - 850 , 850 - 875 , 875 - 900 , 900 - 925 , 925 - 950 , 950 - 975 , 975 - 1000 , 1000 - 1025 , 1025 - 1050 , 1050 - 1075 , 1075 - 1100 , 1100 - 1125 , 1125 - 1150 , 1150 - 1175 , 1175 - 1200 , 1200 - 1225 , 1225 - 1250 | ||
| Click To Change The Sort Order: By Market Cap or Company Size Performance: Year-to-date, Week and Day | |
| Select Chart Type: | ||
|
Best Stocks Today 12Stocks.com |
© 2024 12Stocks.com Terms & Conditions Privacy Contact Us
All Information Provided Only For Education And Not To Be Used For Investing or Trading. See Terms & Conditions


One More Thing ... Get Best Stocks Delivered Daily!
Never Ever Miss A Move With Our Top Ten Stocks Lists
Find Best Stocks In Any Market - Bull or Bear Market
Take A Peek At Our Top Ten Stocks Lists: Daily, Weekly, Year-to-Date & Top Trends
Find Best Stocks In Any Market - Bull or Bear Market
Take A Peek At Our Top Ten Stocks Lists: Daily, Weekly, Year-to-Date & Top Trends
Financial Stocks With Best Up Trends [0-bearish to 100-bullish]: Grupo Financiero[100], HSBC [100], Heartland [100], LTC Properties[100], PayPal [100], Federal Realty[100], First Horizon[100], Lamar Advertising[100], INSU Acquisition[100], CareTrust REIT[100], Consolidated-Tomoka Land[100]
Best Financial Stocks Year-to-Date:
Root [568.29%], Hippo [134.8%], Gladstone Capital[100.19%], Banco Macro[88.71%], Grupo Financiero[87.84%], Banco BBVA[75.74%], EverQuote [64.71%], B. Riley[64.36%], Yiren Digital[61.54%], AdvisorShares Pure[60.86%], LendingTree [59.07%] Best Financial Stocks This Week:
AdvisorShares Pure[28.25%], LendingTree [27.26%], Heartland [17.92%], Douglas Elliman[14.29%], Root [8.65%], Territorial Bancorp[7.5%], AltC Acquisition[7.26%], Citizens [7.21%], Fathom [6.54%], First Guaranty[6.41%], Fulton [5.92%] Best Financial Stocks Daily:
LendingTree [29.13%], AdvisorShares Pure[24.83%], First Guaranty[8.77%], Root [4.73%], Fathom [4.49%], Territorial Bancorp[4.25%], SLM [4.10%], Grupo Financiero[3.74%], Camden National[3.55%], HSBC [3.32%], Douglas Elliman[3.03%]