
 Login Sign Up


| |||||
 |  | ||||

| 12Stocks.com Market Intelligence |
Best Financial Stocks
| In a hurry? Financial Stocks Lists: Performance Trends Table, Stock Charts
Sort Financial stocks: Daily, Weekly, Year-to-Date, Market Cap & Trends. Filter Financial stocks list by size:All Financial Large Mid-Range Small & MicroCap |
| 12Stocks.com Financial Stocks Performances & Trends Daily | |||||||||
|
|  The overall Smart Investing & Trading Score is 39 (0-bearish to 100-bullish) which puts Financial sector in short term bearish to neutral trend. The Smart Investing & Trading Score from previous trading session is 58 and hence a deterioration of trend.
| ||||||||
Here are the Smart Investing & Trading Scores of the most requested Financial stocks at 12Stocks.com (click stock name for detailed review):
|


| 12Stocks.com: Investing in Financial sector with Stocks | |
|
The following table helps investors and traders sort through current performance and trends (as measured by Smart Investing & Trading Score) of various
stocks in the Financial sector. Quick View: Move mouse or cursor over stock symbol (ticker) to view short-term Technical chart and over stock name to view long term chart. Click on  to add stock symbol to your watchlist and to add stock symbol to your watchlist and  to view watchlist. Click on any ticker or stock name for detailed market intelligence report for that stock. to view watchlist. Click on any ticker or stock name for detailed market intelligence report for that stock. |
12Stocks.com Performance of Stocks in Financial Sector
| Ticker | Stock Name | Watchlist | Category | Recent Price | Smart Investing & Trading Score | Change % | YTD Change% |
| CFG | Citizens |   | Regional Banks | 34.11 | 58 | -2.49 | 2.93% |
| HWC | Hancock Whitney | | Regional Banks | 45.39 | 48 | -2.49 | -6.59% |
| DLR | Digital Realty | | REIT - Office | 138.78 | 7 | -2.50 | 3.12% |
| OVLY | Oak Valley | | Regional Banks | 23.95 | 40 | -2.50 | -20.05% |
| PGRE | Paramount | | Property Mgmt | 4.64 | 42 | -2.52 | -10.25% |
| SVC | Service Properties | | REIT | 6.13 | 10 | -2.54 | -28.22% |
| NMRK | Newmark | | Property Mgmt | 9.57 | 25 | -2.55 | -12.68% |
| HIPO | Hippo | | Insurance - Specialty | 21.39 | 68 | -2.55 | 134.80% |
| EWBC | East West | | Foreign Banks | 74.49 | 58 | -2.56 | 3.53% |
| COOP | Mr. Cooper | | S&L | 77.20 | 51 | -2.57 | 18.55% |
| WHG | Westwood | | Asset Mgmt | 12.44 | 31 | -2.58 | -1.03% |
| CWK | Cushman & Wakefield | | Property Mgmt | 9.65 | 42 | -2.62 | -10.65% |
| OZK | Bank OZK | | Regional Banks | 44.65 | 35 | -2.62 | -10.40% |
| GNW | Genworth | | Life Insurance | 5.93 | 15 | -2.63 | -11.23% |
| SBR | Sabine Royalty | | Investments | 61.53 | 23 | -2.63 | -9.33% |
| LNC | Loln National | | Life Insurance | 27.27 | 18 | -2.64 | 1.11% |
| MSBI | Midland States | | Regional Banks | 21.90 | 0 | -2.67 | -20.54% |
| SAFE | Safehold | | REIT - | 18.24 | 18 | -2.67 | -22.05% |
| AOMR | Angel Oak | | REIT - Mortgage | 10.53 | 0 | -2.68 | -0.75% |
| BHFAP | Brighthouse | | Life Insurance | 22.22 | 0 | -2.69 | 2.63% |
| BANC | Banc of California | | Regional Banks | 13.69 | 30 | -2.70 | 1.94% |
| BSAC | Banco Santander-Chile | | Banks | 17.98 | 17 | -2.71 | -7.75% |
| EBTC | Enterprise Bancorp | | S&L | 24.30 | 39 | -2.72 | -24.67% |
| IBTX | Independent Bank | | Regional Banks | 37.24 | 0 | -2.74 | -26.81% |
| ARE | Alexandria Real | | REIT - Office | 115.87 | 10 | -2.75 | -8.60% |
| For chart view version of above stock list: Chart View ➞ 0 - 25 , 25 - 50 , 50 - 75 , 75 - 100 , 100 - 125 , 125 - 150 , 150 - 175 , 175 - 200 , 200 - 225 , 225 - 250 , 250 - 275 , 275 - 300 , 300 - 325 , 325 - 350 , 350 - 375 , 375 - 400 , 400 - 425 , 425 - 450 , 450 - 475 , 475 - 500 , 500 - 525 , 525 - 550 , 550 - 575 , 575 - 600 , 600 - 625 , 625 - 650 , 650 - 675 , 675 - 700 , 700 - 725 , 725 - 750 , 750 - 775 , 775 - 800 , 800 - 825 , 825 - 850 , 850 - 875 , 875 - 900 , 900 - 925 , 925 - 950 , 950 - 975 , 975 - 1000 , 1000 - 1025 , 1025 - 1050 , 1050 - 1075 , 1075 - 1100 , 1100 - 1125 , 1125 - 1150 , 1150 - 1175 , 1175 - 1200 , 1200 - 1225 , 1225 - 1250 | ||
 | Click To Change The Sort Order: By Market Cap or Company Size Performance: Year-to-date, Week and Day |  |
|
Get the most comprehensive stock market coverage daily at 12Stocks.com ➞ Best Stocks Today ➞ Best Stocks Weekly ➞ Best Stocks Year-to-Date ➞ Best Stocks Trends ➞  Best Stocks Today 12Stocks.com Best Nasdaq Stocks ➞ Best S&P 500 Stocks ➞ Best Tech Stocks ➞ Best Biotech Stocks ➞ |
| Detailed Overview of Financial Stocks |
| Financial Technical Overview, Leaders & Laggards, Top Financial ETF Funds & Detailed Financial Stocks List, Charts, Trends & More |
| Financial Sector: Technical Analysis, Trends & YTD Performance | |
| Financial sector is composed of stocks
from banks, brokers, insurance, REITs
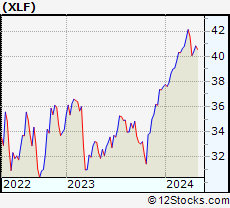
and services subsectors. Financial sector, as represented by XLF, an exchange-traded fund [ETF] that holds basket of Financial stocks (e.g, Bank of America, Goldman Sachs) is up by 7.34% and is currently outperforming the overall market by 2.54% year-to-date. Below is a quick view of Technical charts and trends: |
|
 XLF Weekly Chart |
|
| Long Term Trend: Very Good | |
| Medium Term Trend: Good | |
 XLF Daily Chart |
|
| Short Term Trend: Not Good | |
| Overall Trend Score: 39 | |
| YTD Performance: 7.34% | |
| **Trend Scores & Views Are Only For Educational Purposes And Not For Investing | |
| 12Stocks.com: Top Performing Financial Sector Stocks | ||||||||||||||||||||||||||||||||||||||||||||||||
 The top performing Financial sector stocks year to date are
Now, more recently, over last week, the top performing Financial sector stocks on the move are


|
||||||||||||||||||||||||||||||||||||||||||||||||
| 12Stocks.com: Investing in Financial Sector using Exchange Traded Funds | |
|
The following table shows list of key exchange traded funds (ETF) that
help investors track Financial Index. For detailed view, check out our ETF Funds section of our website. Quick View: Move mouse or cursor over ETF symbol (ticker) to view short-term Technical chart and over ETF name to view long term chart. Click on ticker or stock name for detailed view. Click on to add stock symbol to your watchlist and to view watchlist. |
12Stocks.com List of ETFs that track Financial Index
| Ticker | ETF Name | Watchlist | Recent Price | Smart Investing & Trading Score | Change % | Week % | Year-to-date % |
| XLF | Financial | | 40.36 | 39 | -0.98 | -1.13 | 7.34% |
| IAI | Broker-Dealers & Secs | | 111.37 | 53 | -1.36 | -1.45 | 2.62% |
| IYF | Financials | | 91.15 | 39 | -1.10 | -1.11 | 6.72% |
| IYG | Financial Services | | 63.49 | 39 | -1.32 | -1.73 | 6.28% |
| KRE | Regional Banking | | 47.02 | 25 | -1.57 | -2.43 | -10.32% |
| IXG | Global Financials | | 83.81 | 53 | -0.65 | -0.46 | 6.65% |
| VFH | Financials | | 97.66 | 39 | -1.09 | -1.28 | 5.85% |
| KBE | Bank | | 44.32 | 32 | -1.73 | -2.23 | -3.69% |
| FAS | Financial Bull 3X | | 97.42 | 46 | -2.90 | -3.19 | 17.87% |
| FAZ | Financial Bear 3X | | 11.25 | 49 | 2.93 | 3.59 | -17.7% |
| UYG | Financials | | 62.21 | 46 | -1.91 | -2.26 | 12.7% |
| IAT | Regional Banks | | 40.89 | 45 | -1.64 | -1.99 | -2.27% |
| KIE | Insurance | | 48.58 | 41 | -0.43 | 0.1 | 7.43% |
| PSCF | SmallCap Financials | | 45.79 | 25 | -1.17 | -1.23 | -6.89% |
| EUFN | Europe Financials | | 22.25 | 61 | -1.11 | -0.93 | 6.15% |
| PGF | Financial Preferred | | 14.49 | 15 | -1.02 | -0.55 | -0.62% |
| 12Stocks.com: Charts, Trends, Fundamental Data and Performances of Financial Stocks | |
|
We now take in-depth look at all Financial stocks including charts, multi-period performances and overall trends (as measured by Smart Investing & Trading Score). One can sort Financial stocks (click link to choose) by Daily, Weekly and by Year-to-Date performances. Also, one can sort by size of the company or by market capitalization. |
| Select Your Default Chart Type: | |||||
| |||||
| Click on stock symbol or name for detailed view. Click on to add stock symbol to your watchlist and to view watchlist. Quick View: Move mouse or cursor over "Daily" to quickly view daily Technical stock chart and over "Weekly" to view weekly Technical stock chart. | |||||

 | CFG Citizens Financial Group, Inc. |
| Sector: Financials | |
| SubSector: Regional - Mid-Atlantic Banks | |
| MarketCap: 8225.19 Millions | |
| Recent Price: 34.11 Smart Investing & Trading Score: 58 | |
| Day Percent Change: -2.49% Day Change: -0.87 | |
| Week Change: -2.96% Year-to-date Change: 2.9% | |
| CFG Links: Profile News Message Board | |
| Charts:- Daily , Weekly | |
| Add CFG to Watchlist: View: Get Complete CFG Trend Analysis ➞ | |
 | HWC Hancock Whitney Corporation |
| Sector: Financials | |
| SubSector: Regional - Southeast Banks | |
| MarketCap: 1438.55 Millions | |
| Recent Price: 45.39 Smart Investing & Trading Score: 48 | |
| Day Percent Change: -2.49% Day Change: -1.16 | |
| Week Change: -2.89% Year-to-date Change: -6.6% | |
| HWC Links: Profile News Message Board | |
| Charts:- Daily , Weekly | |
| Add HWC to Watchlist: View: Get Complete HWC Trend Analysis ➞ | |
 | DLR Digital Realty Trust, Inc. |
| Sector: Financials | |
| SubSector: REIT - Office | |
| MarketCap: 27038.6 Millions | |
| Recent Price: 138.78 Smart Investing & Trading Score: 7 | |
| Day Percent Change: -2.50% Day Change: -3.56 | |
| Week Change: -2.84% Year-to-date Change: 3.1% | |
| DLR Links: Profile News Message Board | |
| Charts:- Daily , Weekly | |
| Add DLR to Watchlist: View: Get Complete DLR Trend Analysis ➞ | |
 | OVLY Oak Valley Bancorp |
| Sector: Financials | |
| SubSector: Regional - Pacific Banks | |
| MarketCap: 148.429 Millions | |
| Recent Price: 23.95 Smart Investing & Trading Score: 40 | |
| Day Percent Change: -2.50% Day Change: -0.61 | |
| Week Change: -1.62% Year-to-date Change: -20.1% | |
| OVLY Links: Profile News Message Board | |
| Charts:- Daily , Weekly | |
| Add OVLY to Watchlist: View: Get Complete OVLY Trend Analysis ➞ | |
 | PGRE Paramount Group, Inc. |
| Sector: Financials | |
| SubSector: Property Management | |
| MarketCap: 1722.72 Millions | |
| Recent Price: 4.64 Smart Investing & Trading Score: 42 | |
| Day Percent Change: -2.52% Day Change: -0.12 | |
| Week Change: -0.64% Year-to-date Change: -10.3% | |
| PGRE Links: Profile News Message Board | |
| Charts:- Daily , Weekly | |
| Add PGRE to Watchlist: View: Get Complete PGRE Trend Analysis ➞ | |
 | SVC Service Properties Trust |
| Sector: Financials | |
| SubSector: REIT - Hotel/Motel | |
| MarketCap: 1067.74 Millions | |
| Recent Price: 6.13 Smart Investing & Trading Score: 10 | |
| Day Percent Change: -2.54% Day Change: -0.16 | |
| Week Change: -1.53% Year-to-date Change: -28.2% | |
| SVC Links: Profile News Message Board | |
| Charts:- Daily , Weekly | |
| Add SVC to Watchlist: View: Get Complete SVC Trend Analysis ➞ | |
 | NMRK Newmark Group, Inc. |
| Sector: Financials | |
| SubSector: Property Management | |
| MarketCap: 767.542 Millions | |
| Recent Price: 9.57 Smart Investing & Trading Score: 25 | |
| Day Percent Change: -2.55% Day Change: -0.25 | |
| Week Change: -1.95% Year-to-date Change: -12.7% | |
| NMRK Links: Profile News Message Board | |
| Charts:- Daily , Weekly | |
| Add NMRK to Watchlist: View: Get Complete NMRK Trend Analysis ➞ | |
 | HIPO Hippo Holdings Inc. |
| Sector: Financials | |
| SubSector: Insurance - Specialty | |
| MarketCap: 377 Millions | |
| Recent Price: 21.39 Smart Investing & Trading Score: 68 | |
| Day Percent Change: -2.55% Day Change: -0.56 | |
| Week Change: -1.97% Year-to-date Change: 134.8% | |
| HIPO Links: Profile News Message Board | |
| Charts:- Daily , Weekly | |
| Add HIPO to Watchlist: View: Get Complete HIPO Trend Analysis ➞ | |
 | EWBC East West Bancorp, Inc. |
| Sector: Financials | |
| SubSector: Foreign Money Center Banks | |
| MarketCap: 4618.31 Millions | |
| Recent Price: 74.49 Smart Investing & Trading Score: 58 | |
| Day Percent Change: -2.56% Day Change: -1.96 | |
| Week Change: -1.96% Year-to-date Change: 3.5% | |
| EWBC Links: Profile News Message Board | |
| Charts:- Daily , Weekly | |
| Add EWBC to Watchlist: View: Get Complete EWBC Trend Analysis ➞ | |
 | COOP Mr. Cooper Group Inc. |
| Sector: Financials | |
| SubSector: Savings & Loans | |
| MarketCap: 648.33 Millions | |
| Recent Price: 77.20 Smart Investing & Trading Score: 51 | |
| Day Percent Change: -2.57% Day Change: -2.04 | |
| Week Change: -1.94% Year-to-date Change: 18.6% | |
| COOP Links: Profile News Message Board | |
| Charts:- Daily , Weekly | |
| Add COOP to Watchlist: View: Get Complete COOP Trend Analysis ➞ | |
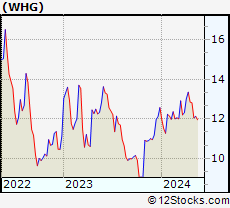 | WHG Westwood Holdings Group, Inc. |
| Sector: Financials | |
| SubSector: Asset Management | |
| MarketCap: 172.103 Millions | |
| Recent Price: 12.44 Smart Investing & Trading Score: 31 | |
| Day Percent Change: -2.58% Day Change: -0.33 | |
| Week Change: -2.89% Year-to-date Change: -1.0% | |
| WHG Links: Profile News Message Board | |
| Charts:- Daily , Weekly | |
| Add WHG to Watchlist: View: Get Complete WHG Trend Analysis ➞ | |
 | CWK Cushman & Wakefield plc |
| Sector: Financials | |
| SubSector: Property Management | |
| MarketCap: 2651.62 Millions | |
| Recent Price: 9.65 Smart Investing & Trading Score: 42 | |
| Day Percent Change: -2.62% Day Change: -0.26 | |
| Week Change: -0.72% Year-to-date Change: -10.7% | |
| CWK Links: Profile News Message Board | |
| Charts:- Daily , Weekly | |
| Add CWK to Watchlist: View: Get Complete CWK Trend Analysis ➞ | |
 | OZK Bank OZK |
| Sector: Financials | |
| SubSector: Regional - Southeast Banks | |
| MarketCap: 2518.35 Millions | |
| Recent Price: 44.65 Smart Investing & Trading Score: 35 | |
| Day Percent Change: -2.62% Day Change: -1.20 | |
| Week Change: -2.98% Year-to-date Change: -10.4% | |
| OZK Links: Profile News Message Board | |
| Charts:- Daily , Weekly | |
| Add OZK to Watchlist: View: Get Complete OZK Trend Analysis ➞ | |
 | GNW Genworth Financial, Inc. |
| Sector: Financials | |
| SubSector: Life Insurance | |
| MarketCap: 1719.76 Millions | |
| Recent Price: 5.93 Smart Investing & Trading Score: 15 | |
| Day Percent Change: -2.63% Day Change: -0.16 | |
| Week Change: -1% Year-to-date Change: -11.2% | |
| GNW Links: Profile News Message Board | |
| Charts:- Daily , Weekly | |
| Add GNW to Watchlist: View: Get Complete GNW Trend Analysis ➞ | |
 | SBR Sabine Royalty Trust |
| Sector: Financials | |
| SubSector: Diversified Investments | |
| MarketCap: 381.27 Millions | |
| Recent Price: 61.53 Smart Investing & Trading Score: 23 | |
| Day Percent Change: -2.63% Day Change: -1.66 | |
| Week Change: -1.79% Year-to-date Change: -9.3% | |
| SBR Links: Profile News Message Board | |
| Charts:- Daily , Weekly | |
| Add SBR to Watchlist: View: Get Complete SBR Trend Analysis ➞ | |
 | LNC Lincoln National Corporation |
| Sector: Financials | |
| SubSector: Life Insurance | |
| MarketCap: 4545.26 Millions | |
| Recent Price: 27.27 Smart Investing & Trading Score: 18 | |
| Day Percent Change: -2.64% Day Change: -0.74 | |
| Week Change: -1.94% Year-to-date Change: 1.1% | |
| LNC Links: Profile News Message Board | |
| Charts:- Daily , Weekly | |
| Add LNC to Watchlist: View: Get Complete LNC Trend Analysis ➞ | |
 | MSBI Midland States Bancorp, Inc. |
| Sector: Financials | |
| SubSector: Regional - Midwest Banks | |
| MarketCap: 400.27 Millions | |
| Recent Price: 21.90 Smart Investing & Trading Score: 0 | |
| Day Percent Change: -2.67% Day Change: -0.60 | |
| Week Change: -2.06% Year-to-date Change: -20.5% | |
| MSBI Links: Profile News Message Board | |
| Charts:- Daily , Weekly | |
| Add MSBI to Watchlist: View: Get Complete MSBI Trend Analysis ➞ | |
 | SAFE Safehold Inc. |
| Sector: Financials | |
| SubSector: REIT - Diversified | |
| MarketCap: 2994.63 Millions | |
| Recent Price: 18.24 Smart Investing & Trading Score: 18 | |
| Day Percent Change: -2.67% Day Change: -0.50 | |
| Week Change: 0.16% Year-to-date Change: -22.1% | |
| SAFE Links: Profile News Message Board | |
| Charts:- Daily , Weekly | |
| Add SAFE to Watchlist: View: Get Complete SAFE Trend Analysis ➞ | |
 | AOMR Angel Oak Mortgage REIT, Inc. |
| Sector: Financials | |
| SubSector: REIT - Mortgage | |
| MarketCap: 202 Millions | |
| Recent Price: 10.53 Smart Investing & Trading Score: 0 | |
| Day Percent Change: -2.68% Day Change: -0.29 | |
| Week Change: -3.31% Year-to-date Change: -0.8% | |
| AOMR Links: Profile News Message Board | |
| Charts:- Daily , Weekly | |
| Add AOMR to Watchlist: View: Get Complete AOMR Trend Analysis ➞ | |
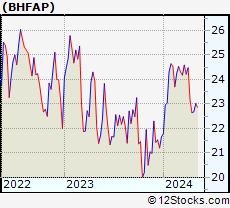 | BHFAP Brighthouse Financial, Inc. |
| Sector: Financials | |
| SubSector: Life Insurance | |
| MarketCap: 1936.76 Millions | |
| Recent Price: 22.22 Smart Investing & Trading Score: 0 | |
| Day Percent Change: -2.69% Day Change: -0.62 | |
| Week Change: -2.03% Year-to-date Change: 2.6% | |
| BHFAP Links: Profile News Message Board | |
| Charts:- Daily , Weekly | |
| Add BHFAP to Watchlist: View: Get Complete BHFAP Trend Analysis ➞ | |
 | BANC Banc of California, Inc. |
| Sector: Financials | |
| SubSector: Regional - Pacific Banks | |
| MarketCap: 459.929 Millions | |
| Recent Price: 13.69 Smart Investing & Trading Score: 30 | |
| Day Percent Change: -2.70% Day Change: -0.38 | |
| Week Change: -4.4% Year-to-date Change: 1.9% | |
| BANC Links: Profile News Message Board | |
| Charts:- Daily , Weekly | |
| Add BANC to Watchlist: View: Get Complete BANC Trend Analysis ➞ | |
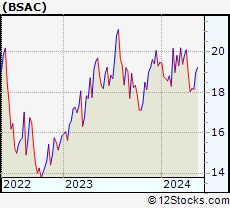 | BSAC Banco Santander-Chile |
| Sector: Financials | |
| SubSector: Money Center Banks | |
| MarketCap: 6987.59 Millions | |
| Recent Price: 17.98 Smart Investing & Trading Score: 17 | |
| Day Percent Change: -2.71% Day Change: -0.50 | |
| Week Change: -1.15% Year-to-date Change: -7.8% | |
| BSAC Links: Profile News Message Board | |
| Charts:- Daily , Weekly | |
| Add BSAC to Watchlist: View: Get Complete BSAC Trend Analysis ➞ | |
 | EBTC Enterprise Bancorp, Inc. |
| Sector: Financials | |
| SubSector: Savings & Loans | |
| MarketCap: 304.53 Millions | |
| Recent Price: 24.30 Smart Investing & Trading Score: 39 | |
| Day Percent Change: -2.72% Day Change: -0.68 | |
| Week Change: -2.41% Year-to-date Change: -24.7% | |
| EBTC Links: Profile News Message Board | |
| Charts:- Daily , Weekly | |
| Add EBTC to Watchlist: View: Get Complete EBTC Trend Analysis ➞ | |
 | IBTX Independent Bank Group, Inc. |
| Sector: Financials | |
| SubSector: Regional - Southeast Banks | |
| MarketCap: 1133.35 Millions | |
| Recent Price: 37.24 Smart Investing & Trading Score: 0 | |
| Day Percent Change: -2.74% Day Change: -1.05 | |
| Week Change: -5.34% Year-to-date Change: -26.8% | |
| IBTX Links: Profile News Message Board | |
| Charts:- Daily , Weekly | |
| Add IBTX to Watchlist: View: Get Complete IBTX Trend Analysis ➞ | |
 | ARE Alexandria Real Estate Equities, Inc. |
| Sector: Financials | |
| SubSector: REIT - Office | |
| MarketCap: 16793.6 Millions | |
| Recent Price: 115.87 Smart Investing & Trading Score: 10 | |
| Day Percent Change: -2.75% Day Change: -3.28 | |
| Week Change: -0.32% Year-to-date Change: -8.6% | |
| ARE Links: Profile News Message Board | |
| Charts:- Daily , Weekly | |
| Add ARE to Watchlist: View: Get Complete ARE Trend Analysis ➞ | |
| For tabular summary view of above stock list: Summary View ➞ 0 - 25 , 25 - 50 , 50 - 75 , 75 - 100 , 100 - 125 , 125 - 150 , 150 - 175 , 175 - 200 , 200 - 225 , 225 - 250 , 250 - 275 , 275 - 300 , 300 - 325 , 325 - 350 , 350 - 375 , 375 - 400 , 400 - 425 , 425 - 450 , 450 - 475 , 475 - 500 , 500 - 525 , 525 - 550 , 550 - 575 , 575 - 600 , 600 - 625 , 625 - 650 , 650 - 675 , 675 - 700 , 700 - 725 , 725 - 750 , 750 - 775 , 775 - 800 , 800 - 825 , 825 - 850 , 850 - 875 , 875 - 900 , 900 - 925 , 925 - 950 , 950 - 975 , 975 - 1000 , 1000 - 1025 , 1025 - 1050 , 1050 - 1075 , 1075 - 1100 , 1100 - 1125 , 1125 - 1150 , 1150 - 1175 , 1175 - 1200 , 1200 - 1225 , 1225 - 1250 | ||
| Click To Change The Sort Order: By Market Cap or Company Size Performance: Year-to-date, Week and Day | |
| Select Chart Type: | ||
|
Best Stocks Today 12Stocks.com |
© 2024 12Stocks.com Terms & Conditions Privacy Contact Us
All Information Provided Only For Education And Not To Be Used For Investing or Trading. See Terms & Conditions


One More Thing ... Get Best Stocks Delivered Daily!
Never Ever Miss A Move With Our Top Ten Stocks Lists
Find Best Stocks In Any Market - Bull or Bear Market
Take A Peek At Our Top Ten Stocks Lists: Daily, Weekly, Year-to-Date & Top Trends
Find Best Stocks In Any Market - Bull or Bear Market
Take A Peek At Our Top Ten Stocks Lists: Daily, Weekly, Year-to-Date & Top Trends
Financial Stocks With Best Up Trends [0-bearish to 100-bullish]: LendingTree [100], AdvisorShares Pure[100], SLM [100], Innovative Industrial[100], Grupo Financiero[100], HSBC [100], NexPoint Residential[100], OneMain [100], Heartland [100], LTC Properties[100], PayPal [100]
Best Financial Stocks Year-to-Date:
Root [565.23%], Hippo [134.8%], Gladstone Capital[100.19%], Banco Macro[88.71%], Grupo Financiero[87.84%], Banco BBVA[75.74%], EverQuote [64.79%], B. Riley[63.89%], Yiren Digital[61.54%], AdvisorShares Pure[60.86%], LendingTree [59.2%] Best Financial Stocks This Week:
AdvisorShares Pure[28.25%], LendingTree [27.36%], Heartland [17.89%], Douglas Elliman[14.29%], First Guaranty[8.24%], Root [8.15%], AltC Acquisition[7.26%], Citizens [7.21%], Territorial Bancorp[6.51%], Fulton [5.95%], Innovative Industrial[5.82%] Best Financial Stocks Daily:
LendingTree [29.24%], AdvisorShares Pure[24.83%], First Guaranty[10.64%], SLM [5.06%], Innovative Industrial[4.75%], Root [4.25%], Grupo Financiero[3.74%], Camden National[3.55%], HSBC [3.32%], Territorial Bancorp[3.29%], Douglas Elliman[3.03%]