
 Login Sign Up


| |||||
 |  | ||||

| 12Stocks.com Market Intelligence |
Best Financial Stocks
| In a hurry? Financial Stocks Lists: Performance Trends Table, Stock Charts
Sort Financial stocks: Daily, Weekly, Year-to-Date, Market Cap & Trends. Filter Financial stocks list by size:All Financial Large Mid-Range Small & MicroCap |
| 12Stocks.com Financial Stocks Performances & Trends Daily | |||||||||
|
|  The overall Smart Investing & Trading Score is 39 (0-bearish to 100-bullish) which puts Financial sector in short term bearish to neutral trend. The Smart Investing & Trading Score from previous trading session is 58 and hence a deterioration of trend.
| ||||||||
Here are the Smart Investing & Trading Scores of the most requested Financial stocks at 12Stocks.com (click stock name for detailed review):
|


| 12Stocks.com: Investing in Financial sector with Stocks | |
|
The following table helps investors and traders sort through current performance and trends (as measured by Smart Investing & Trading Score) of various
stocks in the Financial sector. Quick View: Move mouse or cursor over stock symbol (ticker) to view short-term Technical chart and over stock name to view long term chart. Click on  to add stock symbol to your watchlist and to add stock symbol to your watchlist and  to view watchlist. Click on any ticker or stock name for detailed market intelligence report for that stock. to view watchlist. Click on any ticker or stock name for detailed market intelligence report for that stock. |
12Stocks.com Performance of Stocks in Financial Sector
| Ticker | Stock Name | Watchlist | Category | Recent Price | Smart Investing & Trading Score | Change % | YTD Change% |
| UVSP | Univest |   | Regional Banks | 20.87 | 80 | -2.20 | -5.27% |
| DRH | DiamondRock Hospitality | | REIT | 8.90 | 33 | -2.20 | -5.22% |
| OPFI | OppFi | | Credit Services | 2.67 | 10 | -2.20 | -47.75% |
| HONE | HarborOne Bancorp | | S&L | 10.13 | 60 | -2.22 | -15.44% |
| TCBX | Third Coast | | Banks - Regional | 19.42 | 81 | -2.22 | -2.95% |
| AGO | Assured Guaranty | | Insurance | 76.70 | 0 | -2.23 | 2.50% |
| PGC | Peapack-Gladstone | | Regional Banks | 22.38 | 20 | -2.23 | -24.95% |
| PPBI | Pacific Premier | | Regional Banks | 21.50 | 28 | -2.23 | -26.14% |
| MOFG | MidWestOne | | Regional - Southwest Banks | 20.17 | 18 | -2.23 | -25.05% |
| JXN | Jackson | | Insurance - Life | 68.32 | 51 | -2.23 | 32.92% |
| TROW | T. Rowe | | Asset Mgmt | 109.57 | 39 | -2.24 | 1.75% |
| CBL | CBL & Associates Properties | | REIT - Retail | 21.75 | 42 | -2.25 | -10.93% |
| SASR | Sandy Spring | | Regional Banks | 20.45 | 35 | -2.25 | -24.93% |
| CASH | Meta | | S&L | 50.37 | 63 | -2.25 | -4.84% |
| EXR | Extra Space | | REIT - Industrial | 134.28 | 35 | -2.26 | -16.25% |
| BKU | BankUnited | | Regional Banks | 26.73 | 42 | -2.27 | -17.58% |
| PHYS | Sprott Physical | | Exchange Traded Fund | 17.69 | 61 | -2.27 | 11.05% |
| LAZ | Lazard | | Asset Mgmt | 38.50 | 20 | -2.28 | 10.63% |
| APO | Apollo Global | | Investments | 108.38 | 34 | -2.28 | 16.30% |
| FR | First Industrial | | REIT - Industrial | 45.42 | 25 | -2.30 | -13.76% |
| CADE | Cadence Ban | | Regional Banks | 27.67 | 61 | -2.30 | -6.49% |
| BEN | Franklin Resources | | Asset Mgmt | 22.84 | 0 | -2.31 | -23.33% |
| ECPG | Encore Capital | | Asset Mgmt | 41.09 | 20 | -2.31 | -19.03% |
| AROW | Arrow | | Regional Banks | 22.27 | 35 | -2.32 | -20.29% |
| PEO | Adams Natural | | Closed-End Fund - Equity | 23.12 | 61 | -2.32 | 12.07% |
| For chart view version of above stock list: Chart View ➞ 0 - 25 , 25 - 50 , 50 - 75 , 75 - 100 , 100 - 125 , 125 - 150 , 150 - 175 , 175 - 200 , 200 - 225 , 225 - 250 , 250 - 275 , 275 - 300 , 300 - 325 , 325 - 350 , 350 - 375 , 375 - 400 , 400 - 425 , 425 - 450 , 450 - 475 , 475 - 500 , 500 - 525 , 525 - 550 , 550 - 575 , 575 - 600 , 600 - 625 , 625 - 650 , 650 - 675 , 675 - 700 , 700 - 725 , 725 - 750 , 750 - 775 , 775 - 800 , 800 - 825 , 825 - 850 , 850 - 875 , 875 - 900 , 900 - 925 , 925 - 950 , 950 - 975 , 975 - 1000 , 1000 - 1025 , 1025 - 1050 , 1050 - 1075 , 1075 - 1100 , 1100 - 1125 , 1125 - 1150 , 1150 - 1175 , 1175 - 1200 , 1200 - 1225 , 1225 - 1250 | ||
 | Click To Change The Sort Order: By Market Cap or Company Size Performance: Year-to-date, Week and Day |  |
|
Get the most comprehensive stock market coverage daily at 12Stocks.com ➞ Best Stocks Today ➞ Best Stocks Weekly ➞ Best Stocks Year-to-Date ➞ Best Stocks Trends ➞  Best Stocks Today 12Stocks.com Best Nasdaq Stocks ➞ Best S&P 500 Stocks ➞ Best Tech Stocks ➞ Best Biotech Stocks ➞ |
| Detailed Overview of Financial Stocks |
| Financial Technical Overview, Leaders & Laggards, Top Financial ETF Funds & Detailed Financial Stocks List, Charts, Trends & More |
| Financial Sector: Technical Analysis, Trends & YTD Performance | |
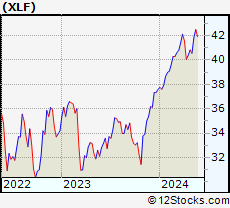
| Financial sector is composed of stocks
from banks, brokers, insurance, REITs
and services subsectors. Financial sector, as represented by XLF, an exchange-traded fund [ETF] that holds basket of Financial stocks (e.g, Bank of America, Goldman Sachs) is up by 7.34% and is currently outperforming the overall market by 2.54% year-to-date. Below is a quick view of Technical charts and trends: |
|
 XLF Weekly Chart |
|
| Long Term Trend: Very Good | |
| Medium Term Trend: Good | |
 XLF Daily Chart |
|
| Short Term Trend: Not Good | |
| Overall Trend Score: 39 | |
| YTD Performance: 7.34% | |
| **Trend Scores & Views Are Only For Educational Purposes And Not For Investing | |
| 12Stocks.com: Top Performing Financial Sector Stocks | ||||||||||||||||||||||||||||||||||||||||||||||||
 The top performing Financial sector stocks year to date are
Now, more recently, over last week, the top performing Financial sector stocks on the move are


|
||||||||||||||||||||||||||||||||||||||||||||||||
| 12Stocks.com: Investing in Financial Sector using Exchange Traded Funds | |
|
The following table shows list of key exchange traded funds (ETF) that
help investors track Financial Index. For detailed view, check out our ETF Funds section of our website. Quick View: Move mouse or cursor over ETF symbol (ticker) to view short-term Technical chart and over ETF name to view long term chart. Click on ticker or stock name for detailed view. Click on to add stock symbol to your watchlist and to view watchlist. |
12Stocks.com List of ETFs that track Financial Index
| Ticker | ETF Name | Watchlist | Recent Price | Smart Investing & Trading Score | Change % | Week % | Year-to-date % |
| XLF | Financial | | 40.36 | 39 | -0.98 | -1.13 | 7.34% |
| IAI | Broker-Dealers & Secs | | 111.37 | 53 | -1.36 | -1.45 | 2.62% |
| IYF | Financials | | 91.15 | 56 | -1.10 | -1.11 | 6.72% |
| IYG | Financial Services | | 63.49 | 51 | -1.32 | -1.73 | 6.28% |
| KRE | Regional Banking | | 47.02 | 35 | -1.57 | -2.43 | -10.32% |
| IXG | Global Financials | | 83.81 | 76 | -0.65 | -0.46 | 6.65% |
| VFH | Financials | | 97.66 | 51 | -1.09 | -1.28 | 5.85% |
| KBE | Bank | | 44.32 | 32 | -1.73 | -2.23 | -3.69% |
| FAS | Financial Bull 3X | | 97.42 | 46 | -2.90 | -3.19 | 17.87% |
| FAZ | Financial Bear 3X | | 11.25 | 49 | 2.93 | 3.59 | -17.7% |
| UYG | Financials | | 62.21 | 46 | -1.91 | -2.26 | 12.7% |
| IAT | Regional Banks | | 40.89 | 58 | -1.64 | -1.99 | -2.27% |
| KIE | Insurance | | 48.58 | 41 | -0.43 | 0.1 | 7.43% |
| PSCF | SmallCap Financials | | 45.79 | 40 | -1.17 | -1.23 | -6.89% |
| EUFN | Europe Financials | | 22.25 | 76 | -1.11 | -0.93 | 6.15% |
| PGF | Financial Preferred | | 14.49 | 32 | -1.02 | -0.55 | -0.62% |
| 12Stocks.com: Charts, Trends, Fundamental Data and Performances of Financial Stocks | |
|
We now take in-depth look at all Financial stocks including charts, multi-period performances and overall trends (as measured by Smart Investing & Trading Score). One can sort Financial stocks (click link to choose) by Daily, Weekly and by Year-to-Date performances. Also, one can sort by size of the company or by market capitalization. |
| Select Your Default Chart Type: | |||||
| |||||
| Click on stock symbol or name for detailed view. Click on to add stock symbol to your watchlist and to view watchlist. Quick View: Move mouse or cursor over "Daily" to quickly view daily Technical stock chart and over "Weekly" to view weekly Technical stock chart. | |||||

 | UVSP Univest Financial Corporation |
| Sector: Financials | |
| SubSector: Regional - Northeast Banks | |
| MarketCap: 467.999 Millions | |
| Recent Price: 20.87 Smart Investing & Trading Score: 80 | |
| Day Percent Change: -2.20% Day Change: -0.47 | |
| Week Change: -1.7% Year-to-date Change: -5.3% | |
| UVSP Links: Profile News Message Board | |
| Charts:- Daily , Weekly | |
| Add UVSP to Watchlist: View: Get Complete UVSP Trend Analysis ➞ | |
 | DRH DiamondRock Hospitality Company |
| Sector: Financials | |
| SubSector: REIT - Hotel/Motel | |
| MarketCap: 964 Millions | |
| Recent Price: 8.90 Smart Investing & Trading Score: 33 | |
| Day Percent Change: -2.20% Day Change: -0.20 | |
| Week Change: -1.66% Year-to-date Change: -5.2% | |
| DRH Links: Profile News Message Board | |
| Charts:- Daily , Weekly | |
| Add DRH to Watchlist: View: Get Complete DRH Trend Analysis ➞ | |
 | OPFI OppFi Inc. |
| Sector: Financials | |
| SubSector: Credit Services | |
| MarketCap: 226 Millions | |
| Recent Price: 2.67 Smart Investing & Trading Score: 10 | |
| Day Percent Change: -2.20% Day Change: -0.06 | |
| Week Change: 0.38% Year-to-date Change: -47.8% | |
| OPFI Links: Profile News Message Board | |
| Charts:- Daily , Weekly | |
| Add OPFI to Watchlist: View: Get Complete OPFI Trend Analysis ➞ | |
 | HONE HarborOne Bancorp, Inc. |
| Sector: Financials | |
| SubSector: Savings & Loans | |
| MarketCap: 456.03 Millions | |
| Recent Price: 10.13 Smart Investing & Trading Score: 60 | |
| Day Percent Change: -2.22% Day Change: -0.23 | |
| Week Change: -1.27% Year-to-date Change: -15.4% | |
| HONE Links: Profile News Message Board | |
| Charts:- Daily , Weekly | |
| Add HONE to Watchlist: View: Get Complete HONE Trend Analysis ➞ | |
 | TCBX Third Coast Bancshares, Inc. |
| Sector: Financials | |
| SubSector: Banks - Regional | |
| MarketCap: 212 Millions | |
| Recent Price: 19.42 Smart Investing & Trading Score: 81 | |
| Day Percent Change: -2.22% Day Change: -0.44 | |
| Week Change: -2.41% Year-to-date Change: -3.0% | |
| TCBX Links: Profile News Message Board | |
| Charts:- Daily , Weekly | |
| Add TCBX to Watchlist: View: Get Complete TCBX Trend Analysis ➞ | |
 | AGO Assured Guaranty Ltd. |
| Sector: Financials | |
| SubSector: Surety & Title Insurance | |
| MarketCap: 2133.18 Millions | |
| Recent Price: 76.70 Smart Investing & Trading Score: 0 | |
| Day Percent Change: -2.23% Day Change: -1.75 | |
| Week Change: -2.24% Year-to-date Change: 2.5% | |
| AGO Links: Profile News Message Board | |
| Charts:- Daily , Weekly | |
| Add AGO to Watchlist: View: Get Complete AGO Trend Analysis ➞ | |
 | PGC Peapack-Gladstone Financial Corporation |
| Sector: Financials | |
| SubSector: Regional - Northeast Banks | |
| MarketCap: 284.399 Millions | |
| Recent Price: 22.38 Smart Investing & Trading Score: 20 | |
| Day Percent Change: -2.23% Day Change: -0.51 | |
| Week Change: -1.58% Year-to-date Change: -25.0% | |
| PGC Links: Profile News Message Board | |
| Charts:- Daily , Weekly | |
| Add PGC to Watchlist: View: Get Complete PGC Trend Analysis ➞ | |
 | PPBI Pacific Premier Bancorp, Inc. |
| Sector: Financials | |
| SubSector: Regional - Pacific Banks | |
| MarketCap: 978.029 Millions | |
| Recent Price: 21.50 Smart Investing & Trading Score: 28 | |
| Day Percent Change: -2.23% Day Change: -0.49 | |
| Week Change: -2.18% Year-to-date Change: -26.1% | |
| PPBI Links: Profile News Message Board | |
| Charts:- Daily , Weekly | |
| Add PPBI to Watchlist: View: Get Complete PPBI Trend Analysis ➞ | |
 | MOFG MidWestOne Financial Group, Inc. |
| Sector: Financials | |
| SubSector: Regional - Southwest Banks | |
| MarketCap: 345.265 Millions | |
| Recent Price: 20.17 Smart Investing & Trading Score: 18 | |
| Day Percent Change: -2.23% Day Change: -0.46 | |
| Week Change: -1.18% Year-to-date Change: -25.1% | |
| MOFG Links: Profile News Message Board | |
| Charts:- Daily , Weekly | |
| Add MOFG to Watchlist: View: Get Complete MOFG Trend Analysis ➞ | |
 | JXN Jackson Financial Inc. |
| Sector: Financials | |
| SubSector: Insurance - Life | |
| MarketCap: 2460 Millions | |
| Recent Price: 68.32 Smart Investing & Trading Score: 51 | |
| Day Percent Change: -2.23% Day Change: -1.56 | |
| Week Change: -1.78% Year-to-date Change: 32.9% | |
| JXN Links: Profile News Message Board | |
| Charts:- Daily , Weekly | |
| Add JXN to Watchlist: View: Get Complete JXN Trend Analysis ➞ | |
 | TROW T. Rowe Price Group, Inc. |
| Sector: Financials | |
| SubSector: Asset Management | |
| MarketCap: 24530 Millions | |
| Recent Price: 109.57 Smart Investing & Trading Score: 39 | |
| Day Percent Change: -2.24% Day Change: -2.51 | |
| Week Change: -3.9% Year-to-date Change: 1.8% | |
| TROW Links: Profile News Message Board | |
| Charts:- Daily , Weekly | |
| Add TROW to Watchlist: View: Get Complete TROW Trend Analysis ➞ | |
 | CBL CBL & Associates Properties, Inc. |
| Sector: Financials | |
| SubSector: REIT - Retail | |
| MarketCap: 690 Millions | |
| Recent Price: 21.75 Smart Investing & Trading Score: 42 | |
| Day Percent Change: -2.25% Day Change: -0.50 | |
| Week Change: -0.78% Year-to-date Change: -10.9% | |
| CBL Links: Profile News Message Board | |
| Charts:- Daily , Weekly | |
| Add CBL to Watchlist: View: Get Complete CBL Trend Analysis ➞ | |
 | SASR Sandy Spring Bancorp, Inc. |
| Sector: Financials | |
| SubSector: Regional - Mid-Atlantic Banks | |
| MarketCap: 764.659 Millions | |
| Recent Price: 20.45 Smart Investing & Trading Score: 35 | |
| Day Percent Change: -2.25% Day Change: -0.47 | |
| Week Change: -4.84% Year-to-date Change: -24.9% | |
| SASR Links: Profile News Message Board | |
| Charts:- Daily , Weekly | |
| Add SASR to Watchlist: View: Get Complete SASR Trend Analysis ➞ | |
 | CASH Meta Financial Group, Inc. |
| Sector: Financials | |
| SubSector: Savings & Loans | |
| MarketCap: 849.33 Millions | |
| Recent Price: 50.37 Smart Investing & Trading Score: 63 | |
| Day Percent Change: -2.25% Day Change: -1.16 | |
| Week Change: -3.39% Year-to-date Change: -4.8% | |
| CASH Links: Profile News Message Board | |
| Charts:- Daily , Weekly | |
| Add CASH to Watchlist: View: Get Complete CASH Trend Analysis ➞ | |
 | EXR Extra Space Storage Inc. |
| Sector: Financials | |
| SubSector: REIT - Industrial | |
| MarketCap: 11203.9 Millions | |
| Recent Price: 134.28 Smart Investing & Trading Score: 35 | |
| Day Percent Change: -2.26% Day Change: -3.10 | |
| Week Change: 0.61% Year-to-date Change: -16.3% | |
| EXR Links: Profile News Message Board | |
| Charts:- Daily , Weekly | |
| Add EXR to Watchlist: View: Get Complete EXR Trend Analysis ➞ | |
 | BKU BankUnited, Inc. |
| Sector: Financials | |
| SubSector: Regional - Mid-Atlantic Banks | |
| MarketCap: 1905.99 Millions | |
| Recent Price: 26.73 Smart Investing & Trading Score: 42 | |
| Day Percent Change: -2.27% Day Change: -0.62 | |
| Week Change: -1.94% Year-to-date Change: -17.6% | |
| BKU Links: Profile News Message Board | |
| Charts:- Daily , Weekly | |
| Add BKU to Watchlist: View: Get Complete BKU Trend Analysis ➞ | |
 | PHYS Sprott Physical Gold Trust |
| Sector: Financials | |
| SubSector: Exchange Traded Fund | |
| MarketCap: 2365.21 Millions | |
| Recent Price: 17.69 Smart Investing & Trading Score: 61 | |
| Day Percent Change: -2.27% Day Change: -0.41 | |
| Week Change: -2.48% Year-to-date Change: 11.1% | |
| PHYS Links: Profile News Message Board | |
| Charts:- Daily , Weekly | |
| Add PHYS to Watchlist: View: Get Complete PHYS Trend Analysis ➞ | |
 | LAZ Lazard Ltd |
| Sector: Financials | |
| SubSector: Asset Management | |
| MarketCap: 3061.13 Millions | |
| Recent Price: 38.50 Smart Investing & Trading Score: 20 | |
| Day Percent Change: -2.28% Day Change: -0.90 | |
| Week Change: -1.26% Year-to-date Change: 10.6% | |
| LAZ Links: Profile News Message Board | |
| Charts:- Daily , Weekly | |
| Add LAZ to Watchlist: View: Get Complete LAZ Trend Analysis ➞ | |
 | APO Apollo Global Management, Inc. |
| Sector: Financials | |
| SubSector: Diversified Investments | |
| MarketCap: 12706 Millions | |
| Recent Price: 108.38 Smart Investing & Trading Score: 34 | |
| Day Percent Change: -2.28% Day Change: -2.53 | |
| Week Change: -3.42% Year-to-date Change: 16.3% | |
| APO Links: Profile News Message Board | |
| Charts:- Daily , Weekly | |
| Add APO to Watchlist: View: Get Complete APO Trend Analysis ➞ | |
 | FR First Industrial Realty Trust, Inc. |
| Sector: Financials | |
| SubSector: REIT - Industrial | |
| MarketCap: 3883.39 Millions | |
| Recent Price: 45.42 Smart Investing & Trading Score: 25 | |
| Day Percent Change: -2.30% Day Change: -1.07 | |
| Week Change: -1.26% Year-to-date Change: -13.8% | |
| FR Links: Profile News Message Board | |
| Charts:- Daily , Weekly | |
| Add FR to Watchlist: View: Get Complete FR Trend Analysis ➞ | |
 | CADE Cadence Bancorporation |
| Sector: Financials | |
| SubSector: Regional - Southeast Banks | |
| MarketCap: 756.335 Millions | |
| Recent Price: 27.67 Smart Investing & Trading Score: 61 | |
| Day Percent Change: -2.30% Day Change: -0.65 | |
| Week Change: -4.65% Year-to-date Change: -6.5% | |
| CADE Links: Profile News Message Board | |
| Charts:- Daily , Weekly | |
| Add CADE to Watchlist: View: Get Complete CADE Trend Analysis ➞ | |
 | BEN Franklin Resources, Inc. |
| Sector: Financials | |
| SubSector: Asset Management | |
| MarketCap: 9419.73 Millions | |
| Recent Price: 22.84 Smart Investing & Trading Score: 0 | |
| Day Percent Change: -2.31% Day Change: -0.54 | |
| Week Change: -8.6% Year-to-date Change: -23.3% | |
| BEN Links: Profile News Message Board | |
| Charts:- Daily , Weekly | |
| Add BEN to Watchlist: View: Get Complete BEN Trend Analysis ➞ | |
 | ECPG Encore Capital Group, Inc. |
| Sector: Financials | |
| SubSector: Asset Management | |
| MarketCap: 661.503 Millions | |
| Recent Price: 41.09 Smart Investing & Trading Score: 20 | |
| Day Percent Change: -2.31% Day Change: -0.97 | |
| Week Change: -1.3% Year-to-date Change: -19.0% | |
| ECPG Links: Profile News Message Board | |
| Charts:- Daily , Weekly | |
| Add ECPG to Watchlist: View: Get Complete ECPG Trend Analysis ➞ | |
 | AROW Arrow Financial Corporation |
| Sector: Financials | |
| SubSector: Regional - Northeast Banks | |
| MarketCap: 413.999 Millions | |
| Recent Price: 22.27 Smart Investing & Trading Score: 35 | |
| Day Percent Change: -2.32% Day Change: -0.53 | |
| Week Change: -3.01% Year-to-date Change: -20.3% | |
| AROW Links: Profile News Message Board | |
| Charts:- Daily , Weekly | |
| Add AROW to Watchlist: View: Get Complete AROW Trend Analysis ➞ | |
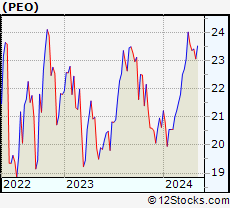 | PEO Adams Natural Resources Fund, Inc. |
| Sector: Financials | |
| SubSector: Closed-End Fund - Equity | |
| MarketCap: 222.247 Millions | |
| Recent Price: 23.12 Smart Investing & Trading Score: 61 | |
| Day Percent Change: -2.32% Day Change: -0.55 | |
| Week Change: -1.28% Year-to-date Change: 12.1% | |
| PEO Links: Profile News Message Board | |
| Charts:- Daily , Weekly | |
| Add PEO to Watchlist: View: Get Complete PEO Trend Analysis ➞ | |
| For tabular summary view of above stock list: Summary View ➞ 0 - 25 , 25 - 50 , 50 - 75 , 75 - 100 , 100 - 125 , 125 - 150 , 150 - 175 , 175 - 200 , 200 - 225 , 225 - 250 , 250 - 275 , 275 - 300 , 300 - 325 , 325 - 350 , 350 - 375 , 375 - 400 , 400 - 425 , 425 - 450 , 450 - 475 , 475 - 500 , 500 - 525 , 525 - 550 , 550 - 575 , 575 - 600 , 600 - 625 , 625 - 650 , 650 - 675 , 675 - 700 , 700 - 725 , 725 - 750 , 750 - 775 , 775 - 800 , 800 - 825 , 825 - 850 , 850 - 875 , 875 - 900 , 900 - 925 , 925 - 950 , 950 - 975 , 975 - 1000 , 1000 - 1025 , 1025 - 1050 , 1050 - 1075 , 1075 - 1100 , 1100 - 1125 , 1125 - 1150 , 1150 - 1175 , 1175 - 1200 , 1200 - 1225 , 1225 - 1250 | ||
| Click To Change The Sort Order: By Market Cap or Company Size Performance: Year-to-date, Week and Day | |
| Select Chart Type: | ||
|
Best Stocks Today 12Stocks.com |
© 2024 12Stocks.com Terms & Conditions Privacy Contact Us
All Information Provided Only For Education And Not To Be Used For Investing or Trading. See Terms & Conditions


One More Thing ... Get Best Stocks Delivered Daily!
Never Ever Miss A Move With Our Top Ten Stocks Lists
Find Best Stocks In Any Market - Bull or Bear Market
Take A Peek At Our Top Ten Stocks Lists: Daily, Weekly, Year-to-Date & Top Trends
Find Best Stocks In Any Market - Bull or Bear Market
Take A Peek At Our Top Ten Stocks Lists: Daily, Weekly, Year-to-Date & Top Trends
Financial Stocks With Best Up Trends [0-bearish to 100-bullish]: Grupo Financiero[100], HSBC [100], Heartland [100], LTC Properties[100], PayPal [100], Federal Realty[100], INSU Acquisition[100], Lamar Advertising[100], CareTrust REIT[100], Consolidated-Tomoka Land[100], Welltower [100]
Best Financial Stocks Year-to-Date:
Root [565.23%], Hippo [134.8%], Gladstone Capital[100.19%], Banco Macro[88.71%], Grupo Financiero[87.84%], Banco BBVA[75.74%], EverQuote [64.79%], B. Riley[63.89%], Yiren Digital[61.54%], AdvisorShares Pure[60.86%], LendingTree [59.2%] Best Financial Stocks This Week:
AdvisorShares Pure[28.25%], LendingTree [27.36%], Heartland [17.89%], Douglas Elliman[14.29%], First Guaranty[8.24%], Root [8.15%], AltC Acquisition[7.26%], Citizens [7.21%], Territorial Bancorp[6.51%], Fulton [5.95%], Innovative Industrial[5.82%] Best Financial Stocks Daily:
LendingTree [29.24%], AdvisorShares Pure[24.83%], First Guaranty[10.64%], SLM [5.06%], Innovative Industrial[4.75%], Root [4.25%], Grupo Financiero[3.74%], Camden National[3.55%], HSBC [3.32%], Territorial Bancorp[3.29%], Douglas Elliman[3.03%]