
 Login Sign Up


| |||||
 |  | ||||

| 12Stocks.com Market Intelligence |
Best Financial Stocks
| In a hurry? Financial Stocks Lists: Performance Trends Table, Stock Charts
Sort Financial stocks: Daily, Weekly, Year-to-Date, Market Cap & Trends. Filter Financial stocks list by size:All Financial Large Mid-Range Small & MicroCap |
| 12Stocks.com Financial Stocks Performances & Trends Daily | |||||||||
|
|  The overall Smart Investing & Trading Score is 39 (0-bearish to 100-bullish) which puts Financial sector in short term bearish to neutral trend. The Smart Investing & Trading Score from previous trading session is 58 and hence a deterioration of trend.
| ||||||||
Here are the Smart Investing & Trading Scores of the most requested Financial stocks at 12Stocks.com (click stock name for detailed review):
|


| 12Stocks.com: Investing in Financial sector with Stocks | |
|
The following table helps investors and traders sort through current performance and trends (as measured by Smart Investing & Trading Score) of various
stocks in the Financial sector. Quick View: Move mouse or cursor over stock symbol (ticker) to view short-term Technical chart and over stock name to view long term chart. Click on  to add stock symbol to your watchlist and to add stock symbol to your watchlist and  to view watchlist. Click on any ticker or stock name for detailed market intelligence report for that stock. to view watchlist. Click on any ticker or stock name for detailed market intelligence report for that stock. |
12Stocks.com Performance of Stocks in Financial Sector
| Ticker | Stock Name | Watchlist | Category | Recent Price | Smart Investing & Trading Score | Change % | YTD Change% |
| BGR | BlackRock Energy |   | Closed-End Fund - Equity | 13.10 | 68 | -2.02 | 5.22% |
| RF | Regions | | Regional Banks | 19.27 | 51 | -2.03 | -0.57% |
| STT | State Street | | Asset Mgmt | 72.49 | 0 | -2.03 | -6.42% |
| SLM | SLM | | Credit Services | 21.19 | 58 | -2.03 | 10.83% |
| EBC | Eastern Bankshares | | Banks Regional | 12.56 | 18 | -2.03 | -11.55% |
| ATLO | Ames National | | Regional Banks | 19.25 | 67 | -2.04 | -9.79% |
| AXP | American Express | | Credit Services | 234.03 | 58 | -2.05 | 24.92% |
| FCFS | FirstCash | | Credit Services | 112.98 | 13 | -2.05 | 4.23% |
| ESRT | Empire State | | REIT - | 9.10 | 50 | -2.05 | -6.09% |
| CCBG | Capital City | | Regional Banks | 26.52 | 48 | -2.07 | -9.89% |
| ALLY | Ally | | Mortgage | 38.35 | 51 | -2.07 | 9.82% |
| CNO | CNO | | Insurance | 26.33 | 35 | -2.08 | -5.63% |
| SBCF | Seacoast Banking | | Regional Banks | 23.07 | 47 | -2.08 | -18.94% |
| KREF | KKR Real | | Mortgage | 9.41 | 18 | -2.08 | -28.87% |
| FNF | Fidelity National | | Insurance | 49.50 | 22 | -2.10 | -2.98% |
| ABCB | Ameris Bancorp | | Regional Banks | 47.48 | 60 | -2.10 | -10.50% |
| EQIX | Equinix . | | REIT - | 711.11 | 0 | -2.10 | -11.71% |
| AMBC | Ambac | | Insurance | 14.45 | 42 | -2.10 | -12.32% |
| BTEK | BlackRock Future | | Exchange Traded Fund | 24.24 | 68 | -2.10 | 3.72% |
| VBTX | Veritex | | Regional - Southwest Banks | 19.48 | 35 | -2.11 | -16.29% |
| APLE | Apple Hospitality | | REIT | 14.76 | 20 | -2.12 | -11.14% |
| BHFAN | Brighthouse | | Insurance Life | 18.47 | 25 | -2.12 | -0.11% |
| CNS | Cohen & Steers | | Asset Mgmt | 68.78 | 43 | -2.15 | -9.18% |
| WAL | Western Alliance | | Regional Banks | 56.83 | 30 | -2.19 | -13.62% |
| HPP | Hudson Pacific | | REIT - Office | 5.80 | 20 | -2.19 | -37.70% |
| For chart view version of above stock list: Chart View ➞ 0 - 25 , 25 - 50 , 50 - 75 , 75 - 100 , 100 - 125 , 125 - 150 , 150 - 175 , 175 - 200 , 200 - 225 , 225 - 250 , 250 - 275 , 275 - 300 , 300 - 325 , 325 - 350 , 350 - 375 , 375 - 400 , 400 - 425 , 425 - 450 , 450 - 475 , 475 - 500 , 500 - 525 , 525 - 550 , 550 - 575 , 575 - 600 , 600 - 625 , 625 - 650 , 650 - 675 , 675 - 700 , 700 - 725 , 725 - 750 , 750 - 775 , 775 - 800 , 800 - 825 , 825 - 850 , 850 - 875 , 875 - 900 , 900 - 925 , 925 - 950 , 950 - 975 , 975 - 1000 , 1000 - 1025 , 1025 - 1050 , 1050 - 1075 , 1075 - 1100 , 1100 - 1125 , 1125 - 1150 , 1150 - 1175 , 1175 - 1200 , 1200 - 1225 , 1225 - 1250 | ||
 | Click To Change The Sort Order: By Market Cap or Company Size Performance: Year-to-date, Week and Day |  |
|
Get the most comprehensive stock market coverage daily at 12Stocks.com ➞ Best Stocks Today ➞ Best Stocks Weekly ➞ Best Stocks Year-to-Date ➞ Best Stocks Trends ➞  Best Stocks Today 12Stocks.com Best Nasdaq Stocks ➞ Best S&P 500 Stocks ➞ Best Tech Stocks ➞ Best Biotech Stocks ➞ |
| Detailed Overview of Financial Stocks |
| Financial Technical Overview, Leaders & Laggards, Top Financial ETF Funds & Detailed Financial Stocks List, Charts, Trends & More |
| Financial Sector: Technical Analysis, Trends & YTD Performance | |
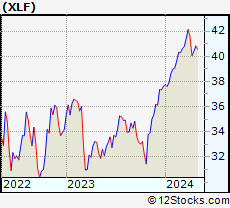
| Financial sector is composed of stocks
from banks, brokers, insurance, REITs
and services subsectors. Financial sector, as represented by XLF, an exchange-traded fund [ETF] that holds basket of Financial stocks (e.g, Bank of America, Goldman Sachs) is up by 7.34% and is currently outperforming the overall market by 2.54% year-to-date. Below is a quick view of Technical charts and trends: |
|
 XLF Weekly Chart |
|
| Long Term Trend: Very Good | |
| Medium Term Trend: Good | |
 XLF Daily Chart |
|
| Short Term Trend: Not Good | |
| Overall Trend Score: 39 | |
| YTD Performance: 7.34% | |
| **Trend Scores & Views Are Only For Educational Purposes And Not For Investing | |
| 12Stocks.com: Top Performing Financial Sector Stocks | ||||||||||||||||||||||||||||||||||||||||||||||||
 The top performing Financial sector stocks year to date are
Now, more recently, over last week, the top performing Financial sector stocks on the move are


|
||||||||||||||||||||||||||||||||||||||||||||||||
| 12Stocks.com: Investing in Financial Sector using Exchange Traded Funds | |
|
The following table shows list of key exchange traded funds (ETF) that
help investors track Financial Index. For detailed view, check out our ETF Funds section of our website. Quick View: Move mouse or cursor over ETF symbol (ticker) to view short-term Technical chart and over ETF name to view long term chart. Click on ticker or stock name for detailed view. Click on to add stock symbol to your watchlist and to view watchlist. |
12Stocks.com List of ETFs that track Financial Index
| Ticker | ETF Name | Watchlist | Recent Price | Smart Investing & Trading Score | Change % | Week % | Year-to-date % |
| XLF | Financial | | 40.36 | 39 | -0.98 | -1.13 | 7.34% |
| IAI | Broker-Dealers & Secs | | 111.37 | 53 | -1.36 | -1.45 | 2.62% |
| IYF | Financials | | 91.15 | 56 | -1.10 | -1.11 | 6.72% |
| IYG | Financial Services | | 63.49 | 51 | -1.32 | -1.73 | 6.28% |
| KRE | Regional Banking | | 47.02 | 35 | -1.57 | -2.43 | -10.32% |
| IXG | Global Financials | | 83.81 | 76 | -0.65 | -0.46 | 6.65% |
| VFH | Financials | | 97.66 | 51 | -1.09 | -1.28 | 5.85% |
| KBE | Bank | | 44.32 | 32 | -1.73 | -2.23 | -3.69% |
| FAS | Financial Bull 3X | | 97.42 | 46 | -2.90 | -3.19 | 17.87% |
| FAZ | Financial Bear 3X | | 11.25 | 49 | 2.93 | 3.59 | -17.7% |
| UYG | Financials | | 62.21 | 46 | -1.91 | -2.26 | 12.7% |
| IAT | Regional Banks | | 40.89 | 58 | -1.64 | -1.99 | -2.27% |
| KIE | Insurance | | 48.58 | 41 | -0.43 | 0.1 | 7.43% |
| PSCF | SmallCap Financials | | 45.79 | 40 | -1.17 | -1.23 | -6.89% |
| EUFN | Europe Financials | | 22.25 | 76 | -1.11 | -0.93 | 6.15% |
| PGF | Financial Preferred | | 14.49 | 32 | -1.02 | -0.55 | -0.62% |
| 12Stocks.com: Charts, Trends, Fundamental Data and Performances of Financial Stocks | |
|
We now take in-depth look at all Financial stocks including charts, multi-period performances and overall trends (as measured by Smart Investing & Trading Score). One can sort Financial stocks (click link to choose) by Daily, Weekly and by Year-to-Date performances. Also, one can sort by size of the company or by market capitalization. |
| Select Your Default Chart Type: | |||||
| |||||
| Click on stock symbol or name for detailed view. Click on to add stock symbol to your watchlist and to view watchlist. Quick View: Move mouse or cursor over "Daily" to quickly view daily Technical stock chart and over "Weekly" to view weekly Technical stock chart. | |||||

 | BGR BlackRock Energy and Resources Trust |
| Sector: Financials | |
| SubSector: Closed-End Fund - Equity | |
| MarketCap: 150.947 Millions | |
| Recent Price: 13.10 Smart Investing & Trading Score: 68 | |
| Day Percent Change: -2.02% Day Change: -0.27 | |
| Week Change: -2.02% Year-to-date Change: 5.2% | |
| BGR Links: Profile News Message Board | |
| Charts:- Daily , Weekly | |
| Add BGR to Watchlist: View: Get Complete BGR Trend Analysis ➞ | |
 | RF Regions Financial Corporation |
| Sector: Financials | |
| SubSector: Regional - Southeast Banks | |
| MarketCap: 8936.25 Millions | |
| Recent Price: 19.27 Smart Investing & Trading Score: 51 | |
| Day Percent Change: -2.03% Day Change: -0.40 | |
| Week Change: -1.78% Year-to-date Change: -0.6% | |
| RF Links: Profile News Message Board | |
| Charts:- Daily , Weekly | |
| Add RF to Watchlist: View: Get Complete RF Trend Analysis ➞ | |
 | STT State Street Corporation |
| Sector: Financials | |
| SubSector: Asset Management | |
| MarketCap: 18623 Millions | |
| Recent Price: 72.49 Smart Investing & Trading Score: 0 | |
| Day Percent Change: -2.03% Day Change: -1.50 | |
| Week Change: -1.23% Year-to-date Change: -6.4% | |
| STT Links: Profile News Message Board | |
| Charts:- Daily , Weekly | |
| Add STT to Watchlist: View: Get Complete STT Trend Analysis ➞ | |
 | SLM SLM Corporation |
| Sector: Financials | |
| SubSector: Credit Services | |
| MarketCap: 3099.78 Millions | |
| Recent Price: 21.19 Smart Investing & Trading Score: 58 | |
| Day Percent Change: -2.03% Day Change: -0.44 | |
| Week Change: -3.24% Year-to-date Change: 10.8% | |
| SLM Links: Profile News Message Board | |
| Charts:- Daily , Weekly | |
| Add SLM to Watchlist: View: Get Complete SLM Trend Analysis ➞ | |
 | EBC Eastern Bankshares, Inc. |
| Sector: Financials | |
| SubSector: Banks Regional | |
| MarketCap: 30057 Millions | |
| Recent Price: 12.56 Smart Investing & Trading Score: 18 | |
| Day Percent Change: -2.03% Day Change: -0.26 | |
| Week Change: -3.68% Year-to-date Change: -11.6% | |
| EBC Links: Profile News Message Board | |
| Charts:- Daily , Weekly | |
| Add EBC to Watchlist: View: Get Complete EBC Trend Analysis ➞ | |
 | ATLO Ames National Corporation |
| Sector: Financials | |
| SubSector: Regional - Northeast Banks | |
| MarketCap: 195.999 Millions | |
| Recent Price: 19.25 Smart Investing & Trading Score: 67 | |
| Day Percent Change: -2.04% Day Change: -0.40 | |
| Week Change: -2.48% Year-to-date Change: -9.8% | |
| ATLO Links: Profile News Message Board | |
| Charts:- Daily , Weekly | |
| Add ATLO to Watchlist: View: Get Complete ATLO Trend Analysis ➞ | |
 | AXP American Express Company |
| Sector: Financials | |
| SubSector: Credit Services | |
| MarketCap: 68388 Millions | |
| Recent Price: 234.03 Smart Investing & Trading Score: 58 | |
| Day Percent Change: -2.05% Day Change: -4.89 | |
| Week Change: -0.68% Year-to-date Change: 24.9% | |
| AXP Links: Profile News Message Board | |
| Charts:- Daily , Weekly | |
| Add AXP to Watchlist: View: Get Complete AXP Trend Analysis ➞ | |
 | FCFS FirstCash, Inc. |
| Sector: Financials | |
| SubSector: Credit Services | |
| MarketCap: 2795.48 Millions | |
| Recent Price: 112.98 Smart Investing & Trading Score: 13 | |
| Day Percent Change: -2.05% Day Change: -2.37 | |
| Week Change: -2.36% Year-to-date Change: 4.2% | |
| FCFS Links: Profile News Message Board | |
| Charts:- Daily , Weekly | |
| Add FCFS to Watchlist: View: Get Complete FCFS Trend Analysis ➞ | |
 | ESRT Empire State Realty Trust, Inc. |
| Sector: Financials | |
| SubSector: REIT - Diversified | |
| MarketCap: 1632.13 Millions | |
| Recent Price: 9.10 Smart Investing & Trading Score: 50 | |
| Day Percent Change: -2.05% Day Change: -0.19 | |
| Week Change: -1.19% Year-to-date Change: -6.1% | |
| ESRT Links: Profile News Message Board | |
| Charts:- Daily , Weekly | |
| Add ESRT to Watchlist: View: Get Complete ESRT Trend Analysis ➞ | |
 | CCBG Capital City Bank Group, Inc. |
| Sector: Financials | |
| SubSector: Regional - Mid-Atlantic Banks | |
| MarketCap: 314.459 Millions | |
| Recent Price: 26.52 Smart Investing & Trading Score: 48 | |
| Day Percent Change: -2.07% Day Change: -0.56 | |
| Week Change: -1.85% Year-to-date Change: -9.9% | |
| CCBG Links: Profile News Message Board | |
| Charts:- Daily , Weekly | |
| Add CCBG to Watchlist: View: Get Complete CCBG Trend Analysis ➞ | |
 | ALLY Ally Financial Inc. |
| Sector: Financials | |
| SubSector: Mortgage Investment | |
| MarketCap: 4643.99 Millions | |
| Recent Price: 38.35 Smart Investing & Trading Score: 51 | |
| Day Percent Change: -2.07% Day Change: -0.81 | |
| Week Change: -2.42% Year-to-date Change: 9.8% | |
| ALLY Links: Profile News Message Board | |
| Charts:- Daily , Weekly | |
| Add ALLY to Watchlist: View: Get Complete ALLY Trend Analysis ➞ | |
 | CNO CNO Financial Group, Inc. |
| Sector: Financials | |
| SubSector: Accident & Health Insurance | |
| MarketCap: 1746.9 Millions | |
| Recent Price: 26.33 Smart Investing & Trading Score: 35 | |
| Day Percent Change: -2.08% Day Change: -0.56 | |
| Week Change: -0.27% Year-to-date Change: -5.6% | |
| CNO Links: Profile News Message Board | |
| Charts:- Daily , Weekly | |
| Add CNO to Watchlist: View: Get Complete CNO Trend Analysis ➞ | |
 | SBCF Seacoast Banking Corporation of Florida |
| Sector: Financials | |
| SubSector: Regional - Mid-Atlantic Banks | |
| MarketCap: 881.559 Millions | |
| Recent Price: 23.07 Smart Investing & Trading Score: 47 | |
| Day Percent Change: -2.08% Day Change: -0.49 | |
| Week Change: -1.33% Year-to-date Change: -18.9% | |
| SBCF Links: Profile News Message Board | |
| Charts:- Daily , Weekly | |
| Add SBCF to Watchlist: View: Get Complete SBCF Trend Analysis ➞ | |
 | KREF KKR Real Estate Finance Trust Inc. |
| Sector: Financials | |
| SubSector: Mortgage Investment | |
| MarketCap: 645.939 Millions | |
| Recent Price: 9.41 Smart Investing & Trading Score: 18 | |
| Day Percent Change: -2.08% Day Change: -0.20 | |
| Week Change: -2.18% Year-to-date Change: -28.9% | |
| KREF Links: Profile News Message Board | |
| Charts:- Daily , Weekly | |
| Add KREF to Watchlist: View: Get Complete KREF Trend Analysis ➞ | |
 | FNF Fidelity National Financial, Inc. |
| Sector: Financials | |
| SubSector: Surety & Title Insurance | |
| MarketCap: 6532.18 Millions | |
| Recent Price: 49.50 Smart Investing & Trading Score: 22 | |
| Day Percent Change: -2.10% Day Change: -1.06 | |
| Week Change: -1.77% Year-to-date Change: -3.0% | |
| FNF Links: Profile News Message Board | |
| Charts:- Daily , Weekly | |
| Add FNF to Watchlist: View: Get Complete FNF Trend Analysis ➞ | |
 | ABCB Ameris Bancorp |
| Sector: Financials | |
| SubSector: Regional - Mid-Atlantic Banks | |
| MarketCap: 1537.79 Millions | |
| Recent Price: 47.48 Smart Investing & Trading Score: 60 | |
| Day Percent Change: -2.10% Day Change: -1.02 | |
| Week Change: -0.84% Year-to-date Change: -10.5% | |
| ABCB Links: Profile News Message Board | |
| Charts:- Daily , Weekly | |
| Add ABCB to Watchlist: View: Get Complete ABCB Trend Analysis ➞ | |
 | EQIX Equinix, Inc. (REIT) |
| Sector: Financials | |
| SubSector: REIT - Diversified | |
| MarketCap: 45855.3 Millions | |
| Recent Price: 711.11 Smart Investing & Trading Score: 0 | |
| Day Percent Change: -2.10% Day Change: -15.23 | |
| Week Change: -2.8% Year-to-date Change: -11.7% | |
| EQIX Links: Profile News Message Board | |
| Charts:- Daily , Weekly | |
| Add EQIX to Watchlist: View: Get Complete EQIX Trend Analysis ➞ | |
 | AMBC Ambac Financial Group, Inc. |
| Sector: Financials | |
| SubSector: Surety & Title Insurance | |
| MarketCap: 587.818 Millions | |
| Recent Price: 14.45 Smart Investing & Trading Score: 42 | |
| Day Percent Change: -2.10% Day Change: -0.31 | |
| Week Change: -0.96% Year-to-date Change: -12.3% | |
| AMBC Links: Profile News Message Board | |
| Charts:- Daily , Weekly | |
| Add AMBC to Watchlist: View: Get Complete AMBC Trend Analysis ➞ | |
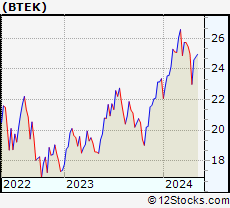 | BTEK BlackRock Future Tech ETF |
| Sector: Financials | |
| SubSector: Exchange Traded Fund | |
| MarketCap: 60157 Millions | |
| Recent Price: 24.24 Smart Investing & Trading Score: 68 | |
| Day Percent Change: -2.10% Day Change: -0.52 | |
| Week Change: -1.42% Year-to-date Change: 3.7% | |
| BTEK Links: Profile News Message Board | |
| Charts:- Daily , Weekly | |
| Add BTEK to Watchlist: View: Get Complete BTEK Trend Analysis ➞ | |
 | VBTX Veritex Holdings, Inc. |
| Sector: Financials | |
| SubSector: Regional - Southwest Banks | |
| MarketCap: 625.165 Millions | |
| Recent Price: 19.48 Smart Investing & Trading Score: 35 | |
| Day Percent Change: -2.11% Day Change: -0.42 | |
| Week Change: -3.42% Year-to-date Change: -16.3% | |
| VBTX Links: Profile News Message Board | |
| Charts:- Daily , Weekly | |
| Add VBTX to Watchlist: View: Get Complete VBTX Trend Analysis ➞ | |
 | APLE Apple Hospitality REIT, Inc. |
| Sector: Financials | |
| SubSector: REIT - Hotel/Motel | |
| MarketCap: 1515.74 Millions | |
| Recent Price: 14.76 Smart Investing & Trading Score: 20 | |
| Day Percent Change: -2.12% Day Change: -0.32 | |
| Week Change: -1.6% Year-to-date Change: -11.1% | |
| APLE Links: Profile News Message Board | |
| Charts:- Daily , Weekly | |
| Add APLE to Watchlist: View: Get Complete APLE Trend Analysis ➞ | |
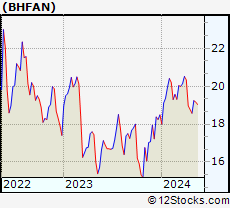 | BHFAN Brighthouse Financial, Inc. |
| Sector: Financials | |
| SubSector: Insurance Life | |
| MarketCap: 60157 Millions | |
| Recent Price: 18.47 Smart Investing & Trading Score: 25 | |
| Day Percent Change: -2.12% Day Change: -0.40 | |
| Week Change: -0.59% Year-to-date Change: -0.1% | |
| BHFAN Links: Profile News Message Board | |
| Charts:- Daily , Weekly | |
| Add BHFAN to Watchlist: View: Get Complete BHFAN Trend Analysis ➞ | |
 | CNS Cohen & Steers, Inc. |
| Sector: Financials | |
| SubSector: Asset Management | |
| MarketCap: 2082.43 Millions | |
| Recent Price: 68.78 Smart Investing & Trading Score: 43 | |
| Day Percent Change: -2.15% Day Change: -1.51 | |
| Week Change: -2.26% Year-to-date Change: -9.2% | |
| CNS Links: Profile News Message Board | |
| Charts:- Daily , Weekly | |
| Add CNS to Watchlist: View: Get Complete CNS Trend Analysis ➞ | |
 | WAL Western Alliance Bancorporation |
| Sector: Financials | |
| SubSector: Regional - Pacific Banks | |
| MarketCap: 2980.09 Millions | |
| Recent Price: 56.83 Smart Investing & Trading Score: 30 | |
| Day Percent Change: -2.19% Day Change: -1.27 | |
| Week Change: -3.15% Year-to-date Change: -13.6% | |
| WAL Links: Profile News Message Board | |
| Charts:- Daily , Weekly | |
| Add WAL to Watchlist: View: Get Complete WAL Trend Analysis ➞ | |
 | HPP Hudson Pacific Properties, Inc. |
| Sector: Financials | |
| SubSector: REIT - Office | |
| MarketCap: 3267.16 Millions | |
| Recent Price: 5.80 Smart Investing & Trading Score: 20 | |
| Day Percent Change: -2.19% Day Change: -0.13 | |
| Week Change: 1.4% Year-to-date Change: -37.7% | |
| HPP Links: Profile News Message Board | |
| Charts:- Daily , Weekly | |
| Add HPP to Watchlist: View: Get Complete HPP Trend Analysis ➞ | |
| For tabular summary view of above stock list: Summary View ➞ 0 - 25 , 25 - 50 , 50 - 75 , 75 - 100 , 100 - 125 , 125 - 150 , 150 - 175 , 175 - 200 , 200 - 225 , 225 - 250 , 250 - 275 , 275 - 300 , 300 - 325 , 325 - 350 , 350 - 375 , 375 - 400 , 400 - 425 , 425 - 450 , 450 - 475 , 475 - 500 , 500 - 525 , 525 - 550 , 550 - 575 , 575 - 600 , 600 - 625 , 625 - 650 , 650 - 675 , 675 - 700 , 700 - 725 , 725 - 750 , 750 - 775 , 775 - 800 , 800 - 825 , 825 - 850 , 850 - 875 , 875 - 900 , 900 - 925 , 925 - 950 , 950 - 975 , 975 - 1000 , 1000 - 1025 , 1025 - 1050 , 1050 - 1075 , 1075 - 1100 , 1100 - 1125 , 1125 - 1150 , 1150 - 1175 , 1175 - 1200 , 1200 - 1225 , 1225 - 1250 | ||
| Click To Change The Sort Order: By Market Cap or Company Size Performance: Year-to-date, Week and Day | |
| Select Chart Type: | ||
|
Best Stocks Today 12Stocks.com |
© 2024 12Stocks.com Terms & Conditions Privacy Contact Us
All Information Provided Only For Education And Not To Be Used For Investing or Trading. See Terms & Conditions


One More Thing ... Get Best Stocks Delivered Daily!
Never Ever Miss A Move With Our Top Ten Stocks Lists
Find Best Stocks In Any Market - Bull or Bear Market
Take A Peek At Our Top Ten Stocks Lists: Daily, Weekly, Year-to-Date & Top Trends
Find Best Stocks In Any Market - Bull or Bear Market
Take A Peek At Our Top Ten Stocks Lists: Daily, Weekly, Year-to-Date & Top Trends
Financial Stocks With Best Up Trends [0-bearish to 100-bullish]: Grupo Financiero[100], HSBC [100], Heartland [100], LTC Properties[100], PayPal [100], Federal Realty[100], Lamar Advertising[100], INSU Acquisition[100], CareTrust REIT[100], Consolidated-Tomoka Land[100], iShares ESG[100]
Best Financial Stocks Year-to-Date:
Root [565.23%], Hippo [134.8%], Gladstone Capital[100.19%], Banco Macro[88.71%], Grupo Financiero[87.84%], Banco BBVA[75.74%], EverQuote [64.79%], B. Riley[63.89%], Yiren Digital[61.54%], AdvisorShares Pure[60.86%], LendingTree [59.2%] Best Financial Stocks This Week:
AdvisorShares Pure[28.25%], LendingTree [27.36%], Heartland [17.89%], Douglas Elliman[14.29%], First Guaranty[8.24%], Root [8.15%], AltC Acquisition[7.26%], Citizens [7.21%], Fathom [6.54%], Territorial Bancorp[6.51%], Fulton [5.95%] Best Financial Stocks Daily:
LendingTree [29.24%], AdvisorShares Pure[24.83%], First Guaranty[10.64%], SLM [5.06%], Innovative Industrial[4.75%], Fathom [4.49%], Root [4.25%], Grupo Financiero[3.74%], Camden National[3.55%], HSBC [3.32%], Territorial Bancorp[3.29%]