
 Login Sign Up


| |||||
 |  | ||||

| 12Stocks.com Market Intelligence |
Best Financial Stocks
| In a hurry? Financial Stocks Lists: Performance Trends Table, Stock Charts
Sort Financial stocks: Daily, Weekly, Year-to-Date, Market Cap & Trends. Filter Financial stocks list by size:All Financial Large Mid-Range Small & MicroCap |
| 12Stocks.com Financial Stocks Performances & Trends Daily | |||||||||
|
|  The overall Smart Investing & Trading Score is 63 (0-bearish to 100-bullish) which puts Financial sector in short term neutral to bullish trend. The Smart Investing & Trading Score from previous trading session is 56 and hence an improvement of trend.
| ||||||||
Here are the Smart Investing & Trading Scores of the most requested Financial stocks at 12Stocks.com (click stock name for detailed review):
|


| 12Stocks.com: Investing in Financial sector with Stocks | |
|
The following table helps investors and traders sort through current performance and trends (as measured by Smart Investing & Trading Score) of various
stocks in the Financial sector. Quick View: Move mouse or cursor over stock symbol (ticker) to view short-term Technical chart and over stock name to view long term chart. Click on  to add stock symbol to your watchlist and to add stock symbol to your watchlist and  to view watchlist. Click on any ticker or stock name for detailed market intelligence report for that stock. to view watchlist. Click on any ticker or stock name for detailed market intelligence report for that stock. |
12Stocks.com Performance of Stocks in Financial Sector
| Ticker | Stock Name | Watchlist | Category | Recent Price | Smart Investing & Trading Score | Change % | YTD Change% |
| PRK | Park National |   | Regional Banks | 127.31 | 35 | 1.63 | -4.18% |
| CVBF | CVB | | Regional Banks | 16.24 | 27 | 1.63 | -19.56% |
| NTST | NetSTREIT | | REIT Retail | 16.82 | 35 | 1.63 | -5.82% |
| SKWD | Skyward Specialty | | Insurance - Property & Casualty | 35.75 | 43 | 1.62 | 5.30% |
| SHBI | Shore Bancshares | | Regional Banks | 10.32 | 17 | 1.62 | -27.54% |
| MOFG | MidWestOne | | Regional - Southwest Banks | 20.04 | 10 | 1.62 | -25.53% |
| FBNC | First Bancorp | | Regional Banks | 31.77 | 17 | 1.62 | -14.17% |
| BMA | Banco Macro | | Foreign Banks | 49.09 | 83 | 1.62 | 71.06% |
| FSP | Franklin Street | | REIT - Office | 1.89 | 0 | 1.61 | -26.17% |
| ALL | Allstate | | Insurance | 171.84 | 76 | 1.61 | 22.76% |
| CADE | Cadence Ban | | Regional Banks | 26.80 | 10 | 1.61 | -9.45% |
| GCBC | Greene County | | S&L | 27.84 | 71 | 1.61 | -1.28% |
| INBK | First Internet | | Regional Banks | 31.53 | 30 | 1.61 | 30.34% |
| GRBK | Green Brick | | Real Estatet | 52.79 | 13 | 1.58 | 1.64% |
| HOPE | Hope Bancorp | | Regional Banks | 10.59 | 27 | 1.58 | -12.38% |
| SAMG | Silvercrest Asset | | Asset Mgmt | 14.36 | 0 | 1.56 | -15.53% |
| FIBK | First Interstate | | Regional Banks | 25.09 | 35 | 1.56 | -18.42% |
| CFFN | Capitol Federal | | S&L | 5.24 | 25 | 1.55 | -18.76% |
| AKR | Acadia Realty | | Property Mgmt | 17.01 | 24 | 1.55 | 0.12% |
| BOH | Bank of Hawaii | | Regional Banks | 57.26 | 32 | 1.55 | -20.98% |
| CPF | Central Pacific | | Regional Banks | 18.99 | 27 | 1.55 | -3.51% |
| WAFD | Washington Federal | | S&L | 27.45 | 52 | 1.54 | -16.73% |
| PIPR | Piper Sandler | | Asset Mgmt | 186.65 | 36 | 1.53 | 6.73% |
| FG | F&G Annuities | | Insurance - Life | 36.13 | 25 | 1.53 | -21.62% |
| BHF | Brighthouse | | Life Insurance | 48.31 | 32 | 1.53 | -8.71% |
| For chart view version of above stock list: Chart View ➞ 0 - 25 , 25 - 50 , 50 - 75 , 75 - 100 , 100 - 125 , 125 - 150 , 150 - 175 , 175 - 200 , 200 - 225 , 225 - 250 , 250 - 275 , 275 - 300 , 300 - 325 , 325 - 350 , 350 - 375 , 375 - 400 , 400 - 425 , 425 - 450 , 450 - 475 , 475 - 500 , 500 - 525 , 525 - 550 , 550 - 575 , 575 - 600 , 600 - 625 , 625 - 650 , 650 - 675 , 675 - 700 , 700 - 725 , 725 - 750 , 750 - 775 , 775 - 800 , 800 - 825 , 825 - 850 , 850 - 875 , 875 - 900 , 900 - 925 , 925 - 950 , 950 - 975 , 975 - 1000 , 1000 - 1025 , 1025 - 1050 , 1050 - 1075 , 1075 - 1100 , 1100 - 1125 , 1125 - 1150 , 1150 - 1175 , 1175 - 1200 | ||
 | Click To Change The Sort Order: By Market Cap or Company Size Performance: Year-to-date, Week and Day |  |
|
Get the most comprehensive stock market coverage daily at 12Stocks.com ➞ Best Stocks Today ➞ Best Stocks Weekly ➞ Best Stocks Year-to-Date ➞ Best Stocks Trends ➞  Best Stocks Today 12Stocks.com Best Nasdaq Stocks ➞ Best S&P 500 Stocks ➞ Best Tech Stocks ➞ Best Biotech Stocks ➞ |
| Detailed Overview of Financial Stocks |
| Financial Technical Overview, Leaders & Laggards, Top Financial ETF Funds & Detailed Financial Stocks List, Charts, Trends & More |
| Financial Sector: Technical Analysis, Trends & YTD Performance | |
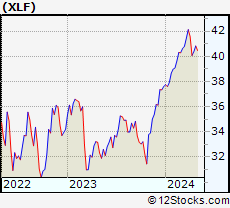
| Financial sector is composed of stocks
from banks, brokers, insurance, REITs
and services subsectors. Financial sector, as represented by XLF, an exchange-traded fund [ETF] that holds basket of Financial stocks (e.g, Bank of America, Goldman Sachs) is up by 6.95% and is currently outperforming the overall market by 2.6% year-to-date. Below is a quick view of Technical charts and trends: |
|
 XLF Weekly Chart |
|
| Long Term Trend: Good | |
| Medium Term Trend: Not Good | |
 XLF Daily Chart |
|
| Short Term Trend: Very Good | |
| Overall Trend Score: 63 | |
| YTD Performance: 6.95% | |
| **Trend Scores & Views Are Only For Educational Purposes And Not For Investing | |
| 12Stocks.com: Top Performing Financial Sector Stocks | ||||||||||||||||||||||||||||||||||||||||||||||||
 The top performing Financial sector stocks year to date are
Now, more recently, over last week, the top performing Financial sector stocks on the move are


|
||||||||||||||||||||||||||||||||||||||||||||||||
| 12Stocks.com: Investing in Financial Sector using Exchange Traded Funds | |
|
The following table shows list of key exchange traded funds (ETF) that
help investors track Financial Index. For detailed view, check out our ETF Funds section of our website. Quick View: Move mouse or cursor over ETF symbol (ticker) to view short-term Technical chart and over ETF name to view long term chart. Click on ticker or stock name for detailed view. Click on to add stock symbol to your watchlist and to view watchlist. |
12Stocks.com List of ETFs that track Financial Index
| Ticker | ETF Name | Watchlist | Recent Price | Smart Investing & Trading Score | Change % | Week % | Year-to-date % |
| XLF | Financial | | 40.22 | 63 | 0.97 | 0.39 | 6.95% |
| IAI | Broker-Dealers & Secs | | 111.48 | 63 | 0.88 | 0.59 | 2.72% |
| KBE | Bank | | 43.93 | 37 | 1.22 | 0.32 | -4.54% |
| FAS | Financial Bull 3X | | 96.64 | 63 | 2.66 | 0.44 | 16.93% |
| FAZ | Financial Bear 3X | | 11.36 | 32 | -2.62 | -0.48 | -16.93% |
| UYG | Financials | | 61.88 | 63 | 1.85 | 0.66 | 12.09% |
| KIE | Insurance | | 48.62 | 58 | 0.70 | 0.62 | 7.52% |
| 12Stocks.com: Charts, Trends, Fundamental Data and Performances of Financial Stocks | |
|
We now take in-depth look at all Financial stocks including charts, multi-period performances and overall trends (as measured by Smart Investing & Trading Score). One can sort Financial stocks (click link to choose) by Daily, Weekly and by Year-to-Date performances. Also, one can sort by size of the company or by market capitalization. |
| Select Your Default Chart Type: | |||||
| |||||
| Click on stock symbol or name for detailed view. Click on to add stock symbol to your watchlist and to view watchlist. Quick View: Move mouse or cursor over "Daily" to quickly view daily Technical stock chart and over "Weekly" to view weekly Technical stock chart. | |||||

 | PRK Park National Corporation |
| Sector: Financials | |
| SubSector: Regional - Midwest Banks | |
| MarketCap: 1416.6 Millions | |
| Recent Price: 127.31 Smart Investing & Trading Score: 35 | |
| Day Percent Change: 1.63% Day Change: 2.04 | |
| Week Change: 1.66% Year-to-date Change: -4.2% | |
| PRK Links: Profile News Message Board | |
| Charts:- Daily , Weekly | |
| Add PRK to Watchlist: View: Get Complete PRK Trend Analysis ➞ | |
 | CVBF CVB Financial Corp. |
| Sector: Financials | |
| SubSector: Regional - Pacific Banks | |
| MarketCap: 2699.99 Millions | |
| Recent Price: 16.24 Smart Investing & Trading Score: 27 | |
| Day Percent Change: 1.63% Day Change: 0.26 | |
| Week Change: 0.19% Year-to-date Change: -19.6% | |
| CVBF Links: Profile News Message Board | |
| Charts:- Daily , Weekly | |
| Add CVBF to Watchlist: View: Get Complete CVBF Trend Analysis ➞ | |
 | NTST NetSTREIT Corp. |
| Sector: Financials | |
| SubSector: REIT Retail | |
| MarketCap: 51267 Millions | |
| Recent Price: 16.82 Smart Investing & Trading Score: 35 | |
| Day Percent Change: 1.63% Day Change: 0.27 | |
| Week Change: -1.29% Year-to-date Change: -5.8% | |
| NTST Links: Profile News Message Board | |
| Charts:- Daily , Weekly | |
| Add NTST to Watchlist: View: Get Complete NTST Trend Analysis ➞ | |
 | SKWD Skyward Specialty Insurance Group, Inc. |
| Sector: Financials | |
| SubSector: Insurance - Property & Casualty | |
| MarketCap: 936 Millions | |
| Recent Price: 35.75 Smart Investing & Trading Score: 43 | |
| Day Percent Change: 1.62% Day Change: 0.57 | |
| Week Change: -0.22% Year-to-date Change: 5.3% | |
| SKWD Links: Profile News Message Board | |
| Charts:- Daily , Weekly | |
| Add SKWD to Watchlist: View: Get Complete SKWD Trend Analysis ➞ | |
 | SHBI Shore Bancshares, Inc. |
| Sector: Financials | |
| SubSector: Regional - Mid-Atlantic Banks | |
| MarketCap: 131.359 Millions | |
| Recent Price: 10.32 Smart Investing & Trading Score: 17 | |
| Day Percent Change: 1.62% Day Change: 0.16 | |
| Week Change: -0.34% Year-to-date Change: -27.5% | |
| SHBI Links: Profile News Message Board | |
| Charts:- Daily , Weekly | |
| Add SHBI to Watchlist: View: Get Complete SHBI Trend Analysis ➞ | |
 | MOFG MidWestOne Financial Group, Inc. |
| Sector: Financials | |
| SubSector: Regional - Southwest Banks | |
| MarketCap: 345.265 Millions | |
| Recent Price: 20.04 Smart Investing & Trading Score: 10 | |
| Day Percent Change: 1.62% Day Change: 0.32 | |
| Week Change: -2.67% Year-to-date Change: -25.5% | |
| MOFG Links: Profile News Message Board | |
| Charts:- Daily , Weekly | |
| Add MOFG to Watchlist: View: Get Complete MOFG Trend Analysis ➞ | |
 | FBNC First Bancorp |
| Sector: Financials | |
| SubSector: Regional - Mid-Atlantic Banks | |
| MarketCap: 664.959 Millions | |
| Recent Price: 31.77 Smart Investing & Trading Score: 17 | |
| Day Percent Change: 1.62% Day Change: 0.50 | |
| Week Change: -2.8% Year-to-date Change: -14.2% | |
| FBNC Links: Profile News Message Board | |
| Charts:- Daily , Weekly | |
| Add FBNC to Watchlist: View: Get Complete FBNC Trend Analysis ➞ | |
 | BMA Banco Macro S.A. |
| Sector: Financials | |
| SubSector: Foreign Regional Banks | |
| MarketCap: 1769.99 Millions | |
| Recent Price: 49.09 Smart Investing & Trading Score: 83 | |
| Day Percent Change: 1.62% Day Change: 0.78 | |
| Week Change: -4.6% Year-to-date Change: 71.1% | |
| BMA Links: Profile News Message Board | |
| Charts:- Daily , Weekly | |
| Add BMA to Watchlist: View: Get Complete BMA Trend Analysis ➞ | |
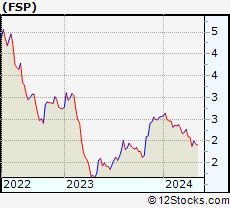 | FSP Franklin Street Properties Corp. |
| Sector: Financials | |
| SubSector: REIT - Office | |
| MarketCap: 636.366 Millions | |
| Recent Price: 1.89 Smart Investing & Trading Score: 0 | |
| Day Percent Change: 1.61% Day Change: 0.03 | |
| Week Change: -9.57% Year-to-date Change: -26.2% | |
| FSP Links: Profile News Message Board | |
| Charts:- Daily , Weekly | |
| Add FSP to Watchlist: View: Get Complete FSP Trend Analysis ➞ | |
 | ALL The Allstate Corporation |
| Sector: Financials | |
| SubSector: Property & Casualty Insurance | |
| MarketCap: 25916.6 Millions | |
| Recent Price: 171.84 Smart Investing & Trading Score: 76 | |
| Day Percent Change: 1.61% Day Change: 2.73 | |
| Week Change: 3.02% Year-to-date Change: 22.8% | |
| ALL Links: Profile News Message Board | |
| Charts:- Daily , Weekly | |
| Add ALL to Watchlist: View: Get Complete ALL Trend Analysis ➞ | |
 | CADE Cadence Bancorporation |
| Sector: Financials | |
| SubSector: Regional - Southeast Banks | |
| MarketCap: 756.335 Millions | |
| Recent Price: 26.80 Smart Investing & Trading Score: 10 | |
| Day Percent Change: 1.61% Day Change: 0.43 | |
| Week Change: -0.13% Year-to-date Change: -9.5% | |
| CADE Links: Profile News Message Board | |
| Charts:- Daily , Weekly | |
| Add CADE to Watchlist: View: Get Complete CADE Trend Analysis ➞ | |
 | GCBC Greene County Bancorp, Inc. |
| Sector: Financials | |
| SubSector: Savings & Loans | |
| MarketCap: 314.83 Millions | |
| Recent Price: 27.84 Smart Investing & Trading Score: 71 | |
| Day Percent Change: 1.61% Day Change: 0.44 | |
| Week Change: 4.78% Year-to-date Change: -1.3% | |
| GCBC Links: Profile News Message Board | |
| Charts:- Daily , Weekly | |
| Add GCBC to Watchlist: View: Get Complete GCBC Trend Analysis ➞ | |
 | INBK First Internet Bancorp |
| Sector: Financials | |
| SubSector: Regional - Midwest Banks | |
| MarketCap: 149.07 Millions | |
| Recent Price: 31.53 Smart Investing & Trading Score: 30 | |
| Day Percent Change: 1.61% Day Change: 0.50 | |
| Week Change: 0.29% Year-to-date Change: 30.3% | |
| INBK Links: Profile News Message Board | |
| Charts:- Daily , Weekly | |
| Add INBK to Watchlist: View: Get Complete INBK Trend Analysis ➞ | |
 | GRBK Green Brick Partners, Inc. |
| Sector: Financials | |
| SubSector: Real Estate Development | |
| MarketCap: 341.819 Millions | |
| Recent Price: 52.79 Smart Investing & Trading Score: 13 | |
| Day Percent Change: 1.58% Day Change: 0.82 | |
| Week Change: -5.24% Year-to-date Change: 1.6% | |
| GRBK Links: Profile News Message Board | |
| Charts:- Daily , Weekly | |
| Add GRBK to Watchlist: View: Get Complete GRBK Trend Analysis ➞ | |
 | HOPE Hope Bancorp, Inc. |
| Sector: Financials | |
| SubSector: Regional - Pacific Banks | |
| MarketCap: 1099.29 Millions | |
| Recent Price: 10.59 Smart Investing & Trading Score: 27 | |
| Day Percent Change: 1.58% Day Change: 0.17 | |
| Week Change: 0.14% Year-to-date Change: -12.4% | |
| HOPE Links: Profile News Message Board | |
| Charts:- Daily , Weekly | |
| Add HOPE to Watchlist: View: Get Complete HOPE Trend Analysis ➞ | |
 | SAMG Silvercrest Asset Management Group Inc. |
| Sector: Financials | |
| SubSector: Asset Management | |
| MarketCap: 116.303 Millions | |
| Recent Price: 14.36 Smart Investing & Trading Score: 0 | |
| Day Percent Change: 1.56% Day Change: 0.22 | |
| Week Change: -2.97% Year-to-date Change: -15.5% | |
| SAMG Links: Profile News Message Board | |
| Charts:- Daily , Weekly | |
| Add SAMG to Watchlist: View: Get Complete SAMG Trend Analysis ➞ | |
 | FIBK First Interstate BancSystem, Inc. |
| Sector: Financials | |
| SubSector: Regional - Pacific Banks | |
| MarketCap: 1797.69 Millions | |
| Recent Price: 25.09 Smart Investing & Trading Score: 35 | |
| Day Percent Change: 1.56% Day Change: 0.39 | |
| Week Change: -0.02% Year-to-date Change: -18.4% | |
| FIBK Links: Profile News Message Board | |
| Charts:- Daily , Weekly | |
| Add FIBK to Watchlist: View: Get Complete FIBK Trend Analysis ➞ | |
 | CFFN Capitol Federal Financial, Inc. |
| Sector: Financials | |
| SubSector: Savings & Loans | |
| MarketCap: 1639.1 Millions | |
| Recent Price: 5.24 Smart Investing & Trading Score: 25 | |
| Day Percent Change: 1.55% Day Change: 0.08 | |
| Week Change: -0.95% Year-to-date Change: -18.8% | |
| CFFN Links: Profile News Message Board | |
| Charts:- Daily , Weekly | |
| Add CFFN to Watchlist: View: Get Complete CFFN Trend Analysis ➞ | |
 | AKR Acadia Realty Trust |
| Sector: Financials | |
| SubSector: Property Management | |
| MarketCap: 1367.42 Millions | |
| Recent Price: 17.01 Smart Investing & Trading Score: 24 | |
| Day Percent Change: 1.55% Day Change: 0.26 | |
| Week Change: -0.53% Year-to-date Change: 0.1% | |
| AKR Links: Profile News Message Board | |
| Charts:- Daily , Weekly | |
| Add AKR to Watchlist: View: Get Complete AKR Trend Analysis ➞ | |
 | BOH Bank of Hawaii Corporation |
| Sector: Financials | |
| SubSector: Regional - Pacific Banks | |
| MarketCap: 2305.19 Millions | |
| Recent Price: 57.26 Smart Investing & Trading Score: 32 | |
| Day Percent Change: 1.55% Day Change: 0.88 | |
| Week Change: -1.76% Year-to-date Change: -21.0% | |
| BOH Links: Profile News Message Board | |
| Charts:- Daily , Weekly | |
| Add BOH to Watchlist: View: Get Complete BOH Trend Analysis ➞ | |
 | CPF Central Pacific Financial Corp. |
| Sector: Financials | |
| SubSector: Regional - Pacific Banks | |
| MarketCap: 407.429 Millions | |
| Recent Price: 18.99 Smart Investing & Trading Score: 27 | |
| Day Percent Change: 1.55% Day Change: 0.29 | |
| Week Change: -0.26% Year-to-date Change: -3.5% | |
| CPF Links: Profile News Message Board | |
| Charts:- Daily , Weekly | |
| Add CPF to Watchlist: View: Get Complete CPF Trend Analysis ➞ | |
 | WAFD Washington Federal, Inc. |
| Sector: Financials | |
| SubSector: Savings & Loans | |
| MarketCap: 2219.2 Millions | |
| Recent Price: 27.45 Smart Investing & Trading Score: 52 | |
| Day Percent Change: 1.54% Day Change: 0.41 | |
| Week Change: 2.22% Year-to-date Change: -16.7% | |
| WAFD Links: Profile News Message Board | |
| Charts:- Daily , Weekly | |
| Add WAFD to Watchlist: View: Get Complete WAFD Trend Analysis ➞ | |
 | PIPR Piper Sandler Companies |
| Sector: Financials | |
| SubSector: Asset Management | |
| MarketCap: 759.603 Millions | |
| Recent Price: 186.65 Smart Investing & Trading Score: 36 | |
| Day Percent Change: 1.53% Day Change: 2.81 | |
| Week Change: -2.08% Year-to-date Change: 6.7% | |
| PIPR Links: Profile News Message Board | |
| Charts:- Daily , Weekly | |
| Add PIPR to Watchlist: View: Get Complete PIPR Trend Analysis ➞ | |
 | FG F&G Annuities & Life, Inc. |
| Sector: Financials | |
| SubSector: Insurance - Life | |
| MarketCap: 2960 Millions | |
| Recent Price: 36.13 Smart Investing & Trading Score: 25 | |
| Day Percent Change: 1.53% Day Change: 0.54 | |
| Week Change: -1.57% Year-to-date Change: -21.6% | |
| FG Links: Profile News Message Board | |
| Charts:- Daily , Weekly | |
| Add FG to Watchlist: View: Get Complete FG Trend Analysis ➞ | |
 | BHF Brighthouse Financial, Inc. |
| Sector: Financials | |
| SubSector: Life Insurance | |
| MarketCap: 2045.06 Millions | |
| Recent Price: 48.31 Smart Investing & Trading Score: 32 | |
| Day Percent Change: 1.53% Day Change: 0.73 | |
| Week Change: 0.73% Year-to-date Change: -8.7% | |
| BHF Links: Profile News Message Board | |
| Charts:- Daily , Weekly | |
| Add BHF to Watchlist: View: Get Complete BHF Trend Analysis ➞ | |
| For tabular summary view of above stock list: Summary View ➞ 0 - 25 , 25 - 50 , 50 - 75 , 75 - 100 , 100 - 125 , 125 - 150 , 150 - 175 , 175 - 200 , 200 - 225 , 225 - 250 , 250 - 275 , 275 - 300 , 300 - 325 , 325 - 350 , 350 - 375 , 375 - 400 , 400 - 425 , 425 - 450 , 450 - 475 , 475 - 500 , 500 - 525 , 525 - 550 , 550 - 575 , 575 - 600 , 600 - 625 , 625 - 650 , 650 - 675 , 675 - 700 , 700 - 725 , 725 - 750 , 750 - 775 , 775 - 800 , 800 - 825 , 825 - 850 , 850 - 875 , 875 - 900 , 900 - 925 , 925 - 950 , 950 - 975 , 975 - 1000 , 1000 - 1025 , 1025 - 1050 , 1050 - 1075 , 1075 - 1100 , 1100 - 1125 , 1125 - 1150 , 1150 - 1175 , 1175 - 1200 | ||
| Click To Change The Sort Order: By Market Cap or Company Size Performance: Year-to-date, Week and Day | |
| Select Chart Type: | ||
|
Best Stocks Today 12Stocks.com |
© 2024 12Stocks.com Terms & Conditions Privacy Contact Us
All Information Provided Only For Education And Not To Be Used For Investing or Trading. See Terms & Conditions


One More Thing ... Get Best Stocks Delivered Daily!
Never Ever Miss A Move With Our Top Ten Stocks Lists
Find Best Stocks In Any Market - Bull or Bear Market
Take A Peek At Our Top Ten Stocks Lists: Daily, Weekly, Year-to-Date & Top Trends
Find Best Stocks In Any Market - Bull or Bear Market
Take A Peek At Our Top Ten Stocks Lists: Daily, Weekly, Year-to-Date & Top Trends
Financial Stocks With Best Up Trends [0-bearish to 100-bullish]: Victory Capital[100], Mercury General[100], Wells Fargo[100], Fidus [100], Goldman Sachs[100], TCG BDC[100], Stellus Capital[100], Macatawa Bank[100], Medical Properties[100], Angel Oak[95], HDFC Bank[93]
Best Financial Stocks Year-to-Date:
Root [387.63%], Hippo [120.64%], Gladstone Capital[94.39%], Banco Macro[71.06%], Grupo Financiero[63.89%], Yiren Digital[54.81%], EverQuote [54.17%], Fidelis Insurance[52.35%], Banco BBVA[51.84%], First [51.45%], Heritage Insurance[45.86%] Best Financial Stocks This Week:
Macatawa Bank[44.42%], Medical Properties[19.05%], Metropolitan Bank[11.82%], Globe Life[10.59%], James River[9.69%], Victory Capital[9.52%], GoHealth [9.23%], Bar Harbor[7.12%], Green Dot[6.69%], Bancorp [6.59%], Mercury General[6.01%] Best Financial Stocks Daily:
Metropolitan Bank[16.45%], Offerpad [8.29%], Cohen & Steers[8.04%], Bar Harbor[7.21%], AlTi Global[5.91%], Fangdd Network[4.75%], Hilltop [4.35%], Lakeland Bancorp[4.31%], Fifth Third[4.18%], Provident [4.15%], EverQuote [4.14%]