
 Login Sign Up


| |||||
 |  | ||||

| 12Stocks.com Market Intelligence |
Best Financial Stocks
| In a hurry? Financial Stocks Lists: Performance Trends Table, Stock Charts
Sort Financial stocks: Daily, Weekly, Year-to-Date, Market Cap & Trends. Filter Financial stocks list by size:All Financial Large Mid-Range Small & MicroCap |
| 12Stocks.com Financial Stocks Performances & Trends Daily | |||||||||
|
|  The overall Smart Investing & Trading Score is 63 (0-bearish to 100-bullish) which puts Financial sector in short term neutral to bullish trend. The Smart Investing & Trading Score from previous trading session is 56 and hence an improvement of trend.
| ||||||||
Here are the Smart Investing & Trading Scores of the most requested Financial stocks at 12Stocks.com (click stock name for detailed review):
|


| 12Stocks.com: Investing in Financial sector with Stocks | |
|
The following table helps investors and traders sort through current performance and trends (as measured by Smart Investing & Trading Score) of various
stocks in the Financial sector. Quick View: Move mouse or cursor over stock symbol (ticker) to view short-term Technical chart and over stock name to view long term chart. Click on  to add stock symbol to your watchlist and to add stock symbol to your watchlist and  to view watchlist. Click on any ticker or stock name for detailed market intelligence report for that stock. to view watchlist. Click on any ticker or stock name for detailed market intelligence report for that stock. |
12Stocks.com Performance of Stocks in Financial Sector
| Ticker | Stock Name | Watchlist | Category | Recent Price | Smart Investing & Trading Score | Change % | YTD Change% |
| OCFC | OceanFirst |   | S&L | 15.21 | 42 | 4.25 | -12.38% |
| MSB | Mesabi Trust | | Investments | 17.79 | 45 | 4.22 | -13.09% |
| AMAL | Amalgamated Bank | | Regional Banks | 22.46 | 42 | 4.22 | -16.63% |
| BUSE | First Busey | | Regional Banks | 22.78 | 32 | 4.21 | -8.22% |
| FMBH | First Mid | | Regional Banks | 31.11 | 47 | 4.19 | -10.24% |
| AMTB | Amerant Bancorp | | Regional Banks | 22.18 | 52 | 4.18 | -9.73% |
| LND | BrasilAgro - | | Property Mgmt | 5.00 | 52 | 4.17 | -5.30% |
| CCBG | Capital City | | Regional Banks | 27.09 | 52 | 4.15 | -7.95% |
| SRCE | 1st Source | | Regional Banks | 49.95 | 32 | 4.15 | -9.10% |
| PWOD | Penns Woods | | Regional Banks | 18.11 | 25 | 4.14 | -19.55% |
| EQBK | Equity Bancshares | | Regional Banks | 32.42 | 22 | 4.14 | -4.37% |
| OFG | OFG Bancorp | | Banks | 34.82 | 32 | 4.13 | -7.10% |
| GABC | German American | | Regional Banks | 33.18 | 42 | 4.08 | 2.38% |
| CVBF | CVB | | Regional Banks | 16.63 | 52 | 4.07 | -17.63% |
| SASR | Sandy Spring | | Regional Banks | 20.76 | 52 | 4.06 | -23.79% |
| FFIN | First | | Regional - Southwest Banks | 29.97 | 35 | 4.06 | -1.09% |
| HONE | HarborOne Bancorp | | S&L | 9.73 | 52 | 4.06 | -18.78% |
| HAFC | Hanmi | | Regional Banks | 15.19 | 52 | 4.04 | -21.70% |
| SMBC | Southern Missouri | | S&L | 41.68 | 42 | 4.02 | -21.93% |
| FGBI | First Guaranty | | Regional Banks | 10.09 | 17 | 4.02 | -9.26% |
| HTLF | Heartland | | Regional - Southwest Banks | 34.81 | 52 | 3.97 | -7.44% |
| SFNC | Simmons First | | Banks | 18.39 | 42 | 3.96 | -7.31% |
| NBTB | NBT Bancorp | | Regional Banks | 34.60 | 42 | 3.95 | -17.43% |
| MSBI | Midland States | | Regional Banks | 23.71 | 32 | 3.95 | -13.97% |
| FFBC | First | | Regional Banks | 21.89 | 52 | 3.94 | -7.83% |
| For chart view version of above stock list: Chart View ➞ 0 - 25 , 25 - 50 , 50 - 75 , 75 - 100 , 100 - 125 , 125 - 150 , 150 - 175 , 175 - 200 , 200 - 225 , 225 - 250 , 250 - 275 , 275 - 300 , 300 - 325 , 325 - 350 , 350 - 375 , 375 - 400 , 400 - 425 , 425 - 450 , 450 - 475 , 475 - 500 , 500 - 525 , 525 - 550 , 550 - 575 , 575 - 600 , 600 - 625 , 625 - 650 , 650 - 675 , 675 - 700 , 700 - 725 , 725 - 750 , 750 - 775 , 775 - 800 , 800 - 825 , 825 - 850 , 850 - 875 , 875 - 900 , 900 - 925 , 925 - 950 , 950 - 975 , 975 - 1000 , 1000 - 1025 , 1025 - 1050 , 1050 - 1075 , 1075 - 1100 , 1100 - 1125 , 1125 - 1150 , 1150 - 1175 , 1175 - 1200 , 1200 - 1225 , 1225 - 1250 | ||
 | Click To Change The Sort Order: By Market Cap or Company Size Performance: Year-to-date, Week and Day |  |
|
Get the most comprehensive stock market coverage daily at 12Stocks.com ➞ Best Stocks Today ➞ Best Stocks Weekly ➞ Best Stocks Year-to-Date ➞ Best Stocks Trends ➞  Best Stocks Today 12Stocks.com Best Nasdaq Stocks ➞ Best S&P 500 Stocks ➞ Best Tech Stocks ➞ Best Biotech Stocks ➞ |
| Detailed Overview of Financial Stocks |
| Financial Technical Overview, Leaders & Laggards, Top Financial ETF Funds & Detailed Financial Stocks List, Charts, Trends & More |
| Financial Sector: Technical Analysis, Trends & YTD Performance | |
| Financial sector is composed of stocks
from banks, brokers, insurance, REITs
and services subsectors. Financial sector, as represented by XLF, an exchange-traded fund [ETF] that holds basket of Financial stocks (e.g, Bank of America, Goldman Sachs) is up by 7.39% and is currently outperforming the overall market by 4.01% year-to-date. Below is a quick view of Technical charts and trends: |
|
 XLF Weekly Chart |
|
| Long Term Trend: Good | |
| Medium Term Trend: Not Good | |
 XLF Daily Chart |
|
| Short Term Trend: Very Good | |
| Overall Trend Score: 63 | |
| YTD Performance: 7.39% | |
| **Trend Scores & Views Are Only For Educational Purposes And Not For Investing | |
| 12Stocks.com: Top Performing Financial Sector Stocks | ||||||||||||||||||||||||||||||||||||||||||||||||
 The top performing Financial sector stocks year to date are
Now, more recently, over last week, the top performing Financial sector stocks on the move are


|
||||||||||||||||||||||||||||||||||||||||||||||||
| 12Stocks.com: Investing in Financial Sector using Exchange Traded Funds | |
|
The following table shows list of key exchange traded funds (ETF) that
help investors track Financial Index. For detailed view, check out our ETF Funds section of our website. Quick View: Move mouse or cursor over ETF symbol (ticker) to view short-term Technical chart and over ETF name to view long term chart. Click on ticker or stock name for detailed view. Click on to add stock symbol to your watchlist and to view watchlist. |
12Stocks.com List of ETFs that track Financial Index
| Ticker | ETF Name | Watchlist | Recent Price | Smart Investing & Trading Score | Change % | Week % | Year-to-date % |
| XLF | Financial | | 40.38 | 63 | 1.38 | 0.8 | 7.39% |
| IAI | Broker-Dealers & Secs | | 111.03 | 63 | 0.47 | 0.18 | 2.3% |
| IYF | Financials | | 91.30 | 48 | 1.40 | 0.83 | 6.9% |
| IYG | Financial Services | | 63.36 | 48 | 1.10 | 0.24 | 6.07% |
| KRE | Regional Banking | | 47.32 | 27 | 2.62 | 1.72 | -9.75% |
| IXG | Global Financials | | 82.86 | 48 | 0.64 | 0.24 | 5.45% |
| VFH | Financials | | 97.75 | 48 | 1.40 | 0.59 | 5.95% |
| KBE | Bank | | 44.41 | 37 | 2.33 | 1.42 | -3.5% |
| FAS | Financial Bull 3X | | 97.93 | 63 | 4.03 | 1.78 | 18.49% |
| FAZ | Financial Bear 3X | | 11.20 | 32 | -3.95 | -1.84 | -18.07% |
| UYG | Financials | | 62.11 | 63 | 2.24 | 1.04 | 12.52% |
| IAT | Regional Banks | | 40.74 | 27 | 2.52 | 0.74 | -2.63% |
| KIE | Insurance | | 49.08 | 58 | 1.66 | 1.57 | 8.54% |
| PSCF | SmallCap Financials | | 44.76 | 15 | 0.01 | -1.42 | -8.98% |
| EUFN | Europe Financials | | 21.96 | 41 | 0.41 | 0.32 | 4.77% |
| PGF | Financial Preferred | | 14.53 | 17 | 0.55 | -1.02 | -0.34% |
| 12Stocks.com: Charts, Trends, Fundamental Data and Performances of Financial Stocks | |
|
We now take in-depth look at all Financial stocks including charts, multi-period performances and overall trends (as measured by Smart Investing & Trading Score). One can sort Financial stocks (click link to choose) by Daily, Weekly and by Year-to-Date performances. Also, one can sort by size of the company or by market capitalization. |
| Select Your Default Chart Type: | |||||
| |||||
| Click on stock symbol or name for detailed view. Click on to add stock symbol to your watchlist and to view watchlist. Quick View: Move mouse or cursor over "Daily" to quickly view daily Technical stock chart and over "Weekly" to view weekly Technical stock chart. | |||||

 | OCFC OceanFirst Financial Corp. |
| Sector: Financials | |
| SubSector: Savings & Loans | |
| MarketCap: 867.43 Millions | |
| Recent Price: 15.21 Smart Investing & Trading Score: 42 | |
| Day Percent Change: 4.25% Day Change: 0.62 | |
| Week Change: 2.98% Year-to-date Change: -12.4% | |
| OCFC Links: Profile News Message Board | |
| Charts:- Daily , Weekly | |
| Add OCFC to Watchlist: View: Get Complete OCFC Trend Analysis ➞ | |
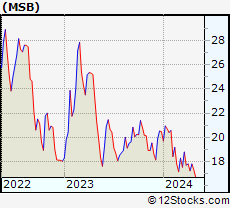 | MSB Mesabi Trust |
| Sector: Financials | |
| SubSector: Diversified Investments | |
| MarketCap: 184.57 Millions | |
| Recent Price: 17.79 Smart Investing & Trading Score: 45 | |
| Day Percent Change: 4.22% Day Change: 0.72 | |
| Week Change: 3.31% Year-to-date Change: -13.1% | |
| MSB Links: Profile News Message Board | |
| Charts:- Daily , Weekly | |
| Add MSB to Watchlist: View: Get Complete MSB Trend Analysis ➞ | |
 | AMAL Amalgamated Bank |
| Sector: Financials | |
| SubSector: Regional - Northeast Banks | |
| MarketCap: 321.899 Millions | |
| Recent Price: 22.46 Smart Investing & Trading Score: 42 | |
| Day Percent Change: 4.22% Day Change: 0.91 | |
| Week Change: 2.18% Year-to-date Change: -16.6% | |
| AMAL Links: Profile News Message Board | |
| Charts:- Daily , Weekly | |
| Add AMAL to Watchlist: View: Get Complete AMAL Trend Analysis ➞ | |
 | BUSE First Busey Corporation |
| Sector: Financials | |
| SubSector: Regional - Midwest Banks | |
| MarketCap: 876.97 Millions | |
| Recent Price: 22.78 Smart Investing & Trading Score: 32 | |
| Day Percent Change: 4.21% Day Change: 0.92 | |
| Week Change: 2.61% Year-to-date Change: -8.2% | |
| BUSE Links: Profile News Message Board | |
| Charts:- Daily , Weekly | |
| Add BUSE to Watchlist: View: Get Complete BUSE Trend Analysis ➞ | |
 | FMBH First Mid Bancshares, Inc. |
| Sector: Financials | |
| SubSector: Regional - Midwest Banks | |
| MarketCap: 373.27 Millions | |
| Recent Price: 31.11 Smart Investing & Trading Score: 47 | |
| Day Percent Change: 4.19% Day Change: 1.25 | |
| Week Change: 5.42% Year-to-date Change: -10.2% | |
| FMBH Links: Profile News Message Board | |
| Charts:- Daily , Weekly | |
| Add FMBH to Watchlist: View: Get Complete FMBH Trend Analysis ➞ | |
 | AMTB Amerant Bancorp Inc. |
| Sector: Financials | |
| SubSector: Regional - Midwest Banks | |
| MarketCap: 653.87 Millions | |
| Recent Price: 22.18 Smart Investing & Trading Score: 52 | |
| Day Percent Change: 4.18% Day Change: 0.89 | |
| Week Change: 4.87% Year-to-date Change: -9.7% | |
| AMTB Links: Profile News Message Board | |
| Charts:- Daily , Weekly | |
| Add AMTB to Watchlist: View: Get Complete AMTB Trend Analysis ➞ | |
 | LND BrasilAgro - Companhia Brasileira de Propriedades Agricolas |
| Sector: Financials | |
| SubSector: Property Management | |
| MarketCap: 157.842 Millions | |
| Recent Price: 5.00 Smart Investing & Trading Score: 52 | |
| Day Percent Change: 4.17% Day Change: 0.20 | |
| Week Change: 3.95% Year-to-date Change: -5.3% | |
| LND Links: Profile News Message Board | |
| Charts:- Daily , Weekly | |
| Add LND to Watchlist: View: Get Complete LND Trend Analysis ➞ | |
 | CCBG Capital City Bank Group, Inc. |
| Sector: Financials | |
| SubSector: Regional - Mid-Atlantic Banks | |
| MarketCap: 314.459 Millions | |
| Recent Price: 27.09 Smart Investing & Trading Score: 52 | |
| Day Percent Change: 4.15% Day Change: 1.08 | |
| Week Change: 3.99% Year-to-date Change: -8.0% | |
| CCBG Links: Profile News Message Board | |
| Charts:- Daily , Weekly | |
| Add CCBG to Watchlist: View: Get Complete CCBG Trend Analysis ➞ | |
 | SRCE 1st Source Corporation |
| Sector: Financials | |
| SubSector: Regional - Midwest Banks | |
| MarketCap: 784.77 Millions | |
| Recent Price: 49.95 Smart Investing & Trading Score: 32 | |
| Day Percent Change: 4.15% Day Change: 1.99 | |
| Week Change: 3.44% Year-to-date Change: -9.1% | |
| SRCE Links: Profile News Message Board | |
| Charts:- Daily , Weekly | |
| Add SRCE to Watchlist: View: Get Complete SRCE Trend Analysis ➞ | |
 | PWOD Penns Woods Bancorp, Inc. |
| Sector: Financials | |
| SubSector: Regional - Mid-Atlantic Banks | |
| MarketCap: 152.559 Millions | |
| Recent Price: 18.11 Smart Investing & Trading Score: 25 | |
| Day Percent Change: 4.14% Day Change: 0.72 | |
| Week Change: 1.46% Year-to-date Change: -19.6% | |
| PWOD Links: Profile News Message Board | |
| Charts:- Daily , Weekly | |
| Add PWOD to Watchlist: View: Get Complete PWOD Trend Analysis ➞ | |
 | EQBK Equity Bancshares, Inc. |
| Sector: Financials | |
| SubSector: Regional - Midwest Banks | |
| MarketCap: 272.87 Millions | |
| Recent Price: 32.42 Smart Investing & Trading Score: 22 | |
| Day Percent Change: 4.14% Day Change: 1.29 | |
| Week Change: 0.53% Year-to-date Change: -4.4% | |
| EQBK Links: Profile News Message Board | |
| Charts:- Daily , Weekly | |
| Add EQBK to Watchlist: View: Get Complete EQBK Trend Analysis ➞ | |
 | OFG OFG Bancorp |
| Sector: Financials | |
| SubSector: Money Center Banks | |
| MarketCap: 537.599 Millions | |
| Recent Price: 34.82 Smart Investing & Trading Score: 32 | |
| Day Percent Change: 4.13% Day Change: 1.38 | |
| Week Change: 1.31% Year-to-date Change: -7.1% | |
| OFG Links: Profile News Message Board | |
| Charts:- Daily , Weekly | |
| Add OFG to Watchlist: View: Get Complete OFG Trend Analysis ➞ | |
 | GABC German American Bancorp, Inc. |
| Sector: Financials | |
| SubSector: Regional - Midwest Banks | |
| MarketCap: 731.47 Millions | |
| Recent Price: 33.18 Smart Investing & Trading Score: 42 | |
| Day Percent Change: 4.08% Day Change: 1.30 | |
| Week Change: 3.46% Year-to-date Change: 2.4% | |
| GABC Links: Profile News Message Board | |
| Charts:- Daily , Weekly | |
| Add GABC to Watchlist: View: Get Complete GABC Trend Analysis ➞ | |
 | CVBF CVB Financial Corp. |
| Sector: Financials | |
| SubSector: Regional - Pacific Banks | |
| MarketCap: 2699.99 Millions | |
| Recent Price: 16.63 Smart Investing & Trading Score: 52 | |
| Day Percent Change: 4.07% Day Change: 0.65 | |
| Week Change: 2.59% Year-to-date Change: -17.6% | |
| CVBF Links: Profile News Message Board | |
| Charts:- Daily , Weekly | |
| Add CVBF to Watchlist: View: Get Complete CVBF Trend Analysis ➞ | |
 | SASR Sandy Spring Bancorp, Inc. |
| Sector: Financials | |
| SubSector: Regional - Mid-Atlantic Banks | |
| MarketCap: 764.659 Millions | |
| Recent Price: 20.76 Smart Investing & Trading Score: 52 | |
| Day Percent Change: 4.06% Day Change: 0.81 | |
| Week Change: 2.27% Year-to-date Change: -23.8% | |
| SASR Links: Profile News Message Board | |
| Charts:- Daily , Weekly | |
| Add SASR to Watchlist: View: Get Complete SASR Trend Analysis ➞ | |
 | FFIN First Financial Bankshares, Inc. |
| Sector: Financials | |
| SubSector: Regional - Southwest Banks | |
| MarketCap: 3503.75 Millions | |
| Recent Price: 29.97 Smart Investing & Trading Score: 35 | |
| Day Percent Change: 4.06% Day Change: 1.17 | |
| Week Change: -0.79% Year-to-date Change: -1.1% | |
| FFIN Links: Profile News Message Board | |
| Charts:- Daily , Weekly | |
| Add FFIN to Watchlist: View: Get Complete FFIN Trend Analysis ➞ | |
 | HONE HarborOne Bancorp, Inc. |
| Sector: Financials | |
| SubSector: Savings & Loans | |
| MarketCap: 456.03 Millions | |
| Recent Price: 9.73 Smart Investing & Trading Score: 52 | |
| Day Percent Change: 4.06% Day Change: 0.38 | |
| Week Change: 3.07% Year-to-date Change: -18.8% | |
| HONE Links: Profile News Message Board | |
| Charts:- Daily , Weekly | |
| Add HONE to Watchlist: View: Get Complete HONE Trend Analysis ➞ | |
 | HAFC Hanmi Financial Corporation |
| Sector: Financials | |
| SubSector: Regional - Pacific Banks | |
| MarketCap: 319.929 Millions | |
| Recent Price: 15.19 Smart Investing & Trading Score: 52 | |
| Day Percent Change: 4.04% Day Change: 0.59 | |
| Week Change: 2.43% Year-to-date Change: -21.7% | |
| HAFC Links: Profile News Message Board | |
| Charts:- Daily , Weekly | |
| Add HAFC to Watchlist: View: Get Complete HAFC Trend Analysis ➞ | |
 | SMBC Southern Missouri Bancorp, Inc. |
| Sector: Financials | |
| SubSector: Savings & Loans | |
| MarketCap: 272.53 Millions | |
| Recent Price: 41.68 Smart Investing & Trading Score: 42 | |
| Day Percent Change: 4.02% Day Change: 1.61 | |
| Week Change: 3.55% Year-to-date Change: -21.9% | |
| SMBC Links: Profile News Message Board | |
| Charts:- Daily , Weekly | |
| Add SMBC to Watchlist: View: Get Complete SMBC Trend Analysis ➞ | |
 | FGBI First Guaranty Bancshares, Inc. |
| Sector: Financials | |
| SubSector: Regional - Southeast Banks | |
| MarketCap: 224.035 Millions | |
| Recent Price: 10.09 Smart Investing & Trading Score: 17 | |
| Day Percent Change: 4.02% Day Change: 0.39 | |
| Week Change: 0.3% Year-to-date Change: -9.3% | |
| FGBI Links: Profile News Message Board | |
| Charts:- Daily , Weekly | |
| Add FGBI to Watchlist: View: Get Complete FGBI Trend Analysis ➞ | |
 | HTLF Heartland Financial USA, Inc. |
| Sector: Financials | |
| SubSector: Regional - Southwest Banks | |
| MarketCap: 1143.85 Millions | |
| Recent Price: 34.81 Smart Investing & Trading Score: 52 | |
| Day Percent Change: 3.97% Day Change: 1.33 | |
| Week Change: 2.87% Year-to-date Change: -7.4% | |
| HTLF Links: Profile News Message Board | |
| Charts:- Daily , Weekly | |
| Add HTLF to Watchlist: View: Get Complete HTLF Trend Analysis ➞ | |
 | SFNC Simmons First National Corporation |
| Sector: Financials | |
| SubSector: Money Center Banks | |
| MarketCap: 2125.49 Millions | |
| Recent Price: 18.39 Smart Investing & Trading Score: 42 | |
| Day Percent Change: 3.96% Day Change: 0.70 | |
| Week Change: 1.43% Year-to-date Change: -7.3% | |
| SFNC Links: Profile News Message Board | |
| Charts:- Daily , Weekly | |
| Add SFNC to Watchlist: View: Get Complete SFNC Trend Analysis ➞ | |
 | NBTB NBT Bancorp Inc. |
| Sector: Financials | |
| SubSector: Regional - Northeast Banks | |
| MarketCap: 1451.89 Millions | |
| Recent Price: 34.60 Smart Investing & Trading Score: 42 | |
| Day Percent Change: 3.95% Day Change: 1.31 | |
| Week Change: 2.2% Year-to-date Change: -17.4% | |
| NBTB Links: Profile News Message Board | |
| Charts:- Daily , Weekly | |
| Add NBTB to Watchlist: View: Get Complete NBTB Trend Analysis ➞ | |
 | MSBI Midland States Bancorp, Inc. |
| Sector: Financials | |
| SubSector: Regional - Midwest Banks | |
| MarketCap: 400.27 Millions | |
| Recent Price: 23.71 Smart Investing & Trading Score: 32 | |
| Day Percent Change: 3.95% Day Change: 0.90 | |
| Week Change: 1.24% Year-to-date Change: -14.0% | |
| MSBI Links: Profile News Message Board | |
| Charts:- Daily , Weekly | |
| Add MSBI to Watchlist: View: Get Complete MSBI Trend Analysis ➞ | |
 | FFBC First Financial Bancorp. |
| Sector: Financials | |
| SubSector: Regional - Midwest Banks | |
| MarketCap: 1363.7 Millions | |
| Recent Price: 21.89 Smart Investing & Trading Score: 52 | |
| Day Percent Change: 3.94% Day Change: 0.83 | |
| Week Change: 3.25% Year-to-date Change: -7.8% | |
| FFBC Links: Profile News Message Board | |
| Charts:- Daily , Weekly | |
| Add FFBC to Watchlist: View: Get Complete FFBC Trend Analysis ➞ | |
| For tabular summary view of above stock list: Summary View ➞ 0 - 25 , 25 - 50 , 50 - 75 , 75 - 100 , 100 - 125 , 125 - 150 , 150 - 175 , 175 - 200 , 200 - 225 , 225 - 250 , 250 - 275 , 275 - 300 , 300 - 325 , 325 - 350 , 350 - 375 , 375 - 400 , 400 - 425 , 425 - 450 , 450 - 475 , 475 - 500 , 500 - 525 , 525 - 550 , 550 - 575 , 575 - 600 , 600 - 625 , 625 - 650 , 650 - 675 , 675 - 700 , 700 - 725 , 725 - 750 , 750 - 775 , 775 - 800 , 800 - 825 , 825 - 850 , 850 - 875 , 875 - 900 , 900 - 925 , 925 - 950 , 950 - 975 , 975 - 1000 , 1000 - 1025 , 1025 - 1050 , 1050 - 1075 , 1075 - 1100 , 1100 - 1125 , 1125 - 1150 , 1150 - 1175 , 1175 - 1200 , 1200 - 1225 , 1225 - 1250 | ||
| Click To Change The Sort Order: By Market Cap or Company Size Performance: Year-to-date, Week and Day | |
| Select Chart Type: | ||
|
Best Stocks Today 12Stocks.com |
© 2024 12Stocks.com Terms & Conditions Privacy Contact Us
All Information Provided Only For Education And Not To Be Used For Investing or Trading. See Terms & Conditions


One More Thing ... Get Best Stocks Delivered Daily!
Never Ever Miss A Move With Our Top Ten Stocks Lists
Find Best Stocks In Any Market - Bull or Bear Market
Take A Peek At Our Top Ten Stocks Lists: Daily, Weekly, Year-to-Date & Top Trends
Find Best Stocks In Any Market - Bull or Bear Market
Take A Peek At Our Top Ten Stocks Lists: Daily, Weekly, Year-to-Date & Top Trends
Financial Stocks With Best Up Trends [0-bearish to 100-bullish]: Old Second[100], Tejon Ranch[100], Victory Capital[100], United Fire[100], Wells Fargo[100], ASA Gold[100], Stellus Capital[100], Fidus [100], WhiteHorse Finance[100], Goldman Sachs[100], TCG BDC[100]
Best Financial Stocks Year-to-Date:
Root [394.17%], Hippo [119.15%], Gladstone Capital[96.64%], Banco Macro[73.59%], Grupo Financiero[64.84%], Banco BBVA[57.54%], Yiren Digital[54.81%], First [51.19%], EverQuote [50.2%], Fidelis Insurance[49.98%], Heritage Insurance[46.93%] Best Financial Stocks This Week:
Macatawa Bank[46.82%], Metropolitan Bank[13.32%], Globe Life[12.95%], Medical Properties[10.78%], Victory Capital[10.59%], James River[10.28%], Southern First[8.94%], Chemung [8.49%], Summit [7.96%], Bancorp [7.85%], BancFirst [7.79%] Best Financial Stocks Daily:
Metropolitan Bank[18.01%], Hywin [17.78%], Cohen & Steers[9.50%], Clipper Realty[9.49%], BancFirst [8.80%], Chemung [8.68%], Summit [8.13%], Home Bancorp[7.86%], Bar Harbor[6.79%], Offerpad [6.59%], Iris Energy[6.30%]