
 Login Sign Up


| |||||
 |  | ||||

| 12Stocks.com Market Intelligence |
Best Consumer Services Stocks
| In a hurry? Services & Goods Stocks: Performance Trends Table, Stock Charts
Sort Consumer Services: Daily, Weekly, Year-to-Date, Market Cap & Trends. Filter Services & Goods stocks list by size: All Large Mid-Range Small |
| 12Stocks.com Consumer Services Stocks Performances & Trends Daily | |||||||||
|
|  The overall Smart Investing & Trading Score is 52 (0-bearish to 100-bullish) which puts Consumer Services sector in short term neutral trend. The Smart Investing & Trading Score from previous trading session is 64 and hence a deterioration of trend.
| ||||||||
Here are the Smart Investing & Trading Scores of the most requested Consumer Services stocks at 12Stocks.com (click stock name for detailed review):
|


| Consider signing up for our daily 12Stocks.com "Best Stocks Newsletter". You will never ever miss a big stock move again! |
| 12Stocks.com: Investing in Consumer Services sector with Stocks | |
|
The following table helps investors and traders sort through current performance and trends (as measured by Smart Investing & Trading Score) of various
stocks in the Consumer Services sector. Quick View: Move mouse or cursor over stock symbol (ticker) to view short-term Technical chart and over stock name to view long term chart. Click on  to add stock symbol to your watchlist and to add stock symbol to your watchlist and  to view watchlist. Click on any ticker or stock name for detailed market intelligence report for that stock. to view watchlist. Click on any ticker or stock name for detailed market intelligence report for that stock. |
12Stocks.com Performance of Stocks in Consumer Services Sector
| Ticker | Stock Name | Watchlist | Category | Recent Price | Smart Investing & Trading Score | Change % | Weekly Change% |
| VLGEA | Village Super |   | Grocery | 29.45 | 100 | 1.59% | 2.43% |
| GPS | Gap | | Apparel | 22.11 | 90 | -0.45% | 2.41% |
| CONN | Conn s | | Retail | 3.43 | 37 | -0.29% | 2.39% |
| WING | Wingstop | | Restaurants | 397.84 | 95 | 0.51% | 2.39% |
| TBLA | Taboola.com | | Internet Content & Information | 4.53 | 95 | 0.22% | 2.37% |
| ROL | Rollins | | Services | 47.20 | 100 | 0.21% | 2.34% |
| VSEC | VSE | | Services | 84.82 | 100 | 0.47% | 2.32% |
| DXPE | DXP Enterprises | | Equipment | 53.54 | 90 | 0.34% | 2.31% |
| TITN | Titan Machinery | | Equipment | 23.34 | 67 | 0.09% | 2.28% |
| VRRM | Verra Mobility | | Security | 26.52 | 100 | -0.15% | 2.28% |
| FWONA | Formula One | | Broadcasting | 64.31 | 57 | 2.16% | 2.26% |
| ONON | On Holding | | Footwear & Accessories | 34.01 | 69 | -0.09% | 2.24% |
| MSA | MSA Safety | | Security | 187.98 | 73 | 1.49% | 2.20% |
| MOND | Mondee | | Travel Services | 2.55 | 100 | 4.94% | 2.20% |
| FWONK | Formula One | | Broadcasting | 72.07 | 74 | 2.28% | 2.15% |
| IHG | InterContinental Hotels | | Lodging | 100.11 | 57 | 0.57% | 2.14% |
| OMC | Omnicom | | Advertising | 94.70 | 83 | 1.62% | 2.10% |
| PLTK | Playtika Holding | | Electronic Gaming & Multimedia | 7.87 | 95 | 0.51% | 2.08% |
| YSG | Yatsen Holding | | Specialty Retail | 4.43 | 78 | 1.37% | 2.07% |
| HGV | Hilton Grand | | Casinos | 44.05 | 57 | 0.23% | 2.06% |
| VAC | Marriott Vacations | | Casinos | 99.15 | 90 | 1.68% | 2.03% |
| LOCO | El Pollo | | Restaurants | 10.21 | 100 | -1.07% | 2.00% |
| EEFT | Euronet Worldwide | | Services | 112.41 | 100 | 0.00% | 1.97% |
| TRU | TransUnion | | Services | 78.59 | 100 | -1.44% | 1.97% |
| MAN | Manpower | | Staffing | 77.04 | 100 | 0.12% | 1.96% |
| For chart view version of above stock list: Chart View ➞ 0 - 25 , 25 - 50 , 50 - 75 , 75 - 100 , 100 - 125 , 125 - 150 , 150 - 175 , 175 - 200 , 200 - 225 , 225 - 250 , 250 - 275 , 275 - 300 , 300 - 325 , 325 - 350 , 350 - 375 , 375 - 400 , 400 - 425 , 425 - 450 , 450 - 475 | ||
 | Click To Change The Sort Order: By Market Cap or Company Size Performance: Year-to-date, Week and Day |  |
|
Get the most comprehensive stock market coverage daily at 12Stocks.com ➞ Best Stocks Today ➞ Best Stocks Weekly ➞ Best Stocks Year-to-Date ➞ Best Stocks Trends ➞  Best Stocks Today 12Stocks.com Best Nasdaq Stocks ➞ Best S&P 500 Stocks ➞ Best Tech Stocks ➞ Best Biotech Stocks ➞ |
| Detailed Overview of Consumer Services Stocks |
| Consumer Services Technical Overview, Leaders & Laggards, Top Consumer Services ETF Funds & Detailed Consumer Services Stocks List, Charts, Trends & More |
| Consumer Services Sector: Technical Analysis, Trends & YTD Performance | |
| Consumer Services sector is composed of stocks
from retail, entertainment, media/publishing, consumer goods
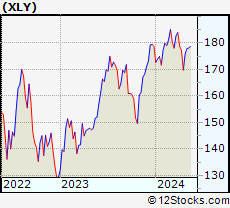
and services subsectors. Consumer Services sector, as represented by XLY, an exchange-traded fund [ETF] that holds basket of Consumer Services stocks (e.g, Walmart, Alibaba) is down by -0.16% and is currently underperforming the overall market by -8.28% year-to-date. Below is a quick view of Technical charts and trends: |
|
 XLY Weekly Chart |
|
| Long Term Trend: Not Good | |
| Medium Term Trend: Very Good | |
 XLY Daily Chart |
|
| Short Term Trend: Very Good | |
| Overall Trend Score: 52 | |
| YTD Performance: -0.16% | |
| **Trend Scores & Views Are Only For Educational Purposes And Not For Investing | |
| 12Stocks.com: Top Performing Consumer Services Sector Stocks | ||||||||||||||||||||||||||||||||||||||||||||||||
 The top performing Consumer Services sector stocks year to date are
Now, more recently, over last week, the top performing Consumer Services sector stocks on the move are


|
||||||||||||||||||||||||||||||||||||||||||||||||
| 12Stocks.com: Investing in Consumer Services Sector using Exchange Traded Funds | |
|
The following table shows list of key exchange traded funds (ETF) that
help investors track Consumer Services Index. For detailed view, check out our ETF Funds section of our website. Quick View: Move mouse or cursor over ETF symbol (ticker) to view short-term Technical chart and over ETF name to view long term chart. Click on ticker or stock name for detailed view. Click on to add stock symbol to your watchlist and to view watchlist. |
12Stocks.com List of ETFs that track Consumer Services Index
| Ticker | ETF Name | Watchlist | Recent Price | Smart Investing & Trading Score | Change % | Week % | Year-to-date % |
| XLY | Consumer Discret Sel | | 178.52 | 52 | -0.72 | 0.34 | -0.16% |
| RTH | Retail | | 202.48 | 64 | 0.80 | 0.98 | 7.57% |
| IYC | Consumer Services | | 79.65 | 64 | -0.51 | 0.71 | 5.12% |
| XRT | Retail | | 74.16 | 64 | -0.16 | 1.01 | 2.54% |
| IYK | Consumer Goods | | 67.19 | 100 | 0.90 | 0.9 | 5.14% |
| UCC | Consumer Services | | 35.22 | 64 | -0.14 | 3.39 | -1.91% |
| RETL | Retail Bull 3X | | 9.08 | 69 | -0.44 | 2.83 | -0.44% |
| RXI | Globl Consumer Discretionary | | 162.97 | 52 | -0.78 | -0.09 | 2.46% |
| SCC | Short Consumer Services | | 15.30 | 46 | 0.40 | -0.55 | -0.16% |
| UGE | Consumer Goods | | 17.61 | 95 | 2.22 | 1.99 | 11.89% |
| 12Stocks.com: Charts, Trends, Fundamental Data and Performances of Consumer Services Stocks | |
|
We now take in-depth look at all Consumer Services stocks including charts, multi-period performances and overall trends (as measured by Smart Investing & Trading Score). One can sort Consumer Services stocks (click link to choose) by Daily, Weekly and by Year-to-Date performances. Also, one can sort by size of the company or by market capitalization. |
| Select Your Default Chart Type: | |||||
| |||||
| Click on stock symbol or name for detailed view. Click on to add stock symbol to your watchlist and to view watchlist. Quick View: Move mouse or cursor over "Daily" to quickly view daily Technical stock chart and over "Weekly" to view weekly Technical stock chart. | |||||

 | VLGEA Village Super Market, Inc. |
| Sector: Services & Goods | |
| SubSector: Grocery Stores | |
| MarketCap: 222.375 Millions | |
| Recent Price: 29.45 Smart Investing & Trading Score: 100 | |
| Day Percent Change: 1.59% Day Change: 0.46 | |
| Week Change: 2.43% Year-to-date Change: 12.3% | |
| VLGEA Links: Profile News Message Board | |
| Charts:- Daily , Weekly | |
| Add VLGEA to Watchlist: View: Get Complete VLGEA Trend Analysis ➞ | |
 | GPS The Gap, Inc. |
| Sector: Services & Goods | |
| SubSector: Apparel Stores | |
| MarketCap: 2936.08 Millions | |
| Recent Price: 22.11 Smart Investing & Trading Score: 90 | |
| Day Percent Change: -0.45% Day Change: -0.10 | |
| Week Change: 2.41% Year-to-date Change: 5.7% | |
| GPS Links: Profile News Message Board | |
| Charts:- Daily , Weekly | |
| Add GPS to Watchlist: View: Get Complete GPS Trend Analysis ➞ | |
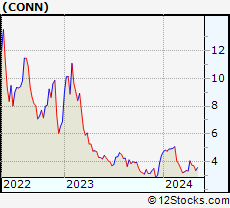 | CONN Conn s, Inc. |
| Sector: Services & Goods | |
| SubSector: Electronics Stores | |
| MarketCap: 153.2 Millions | |
| Recent Price: 3.43 Smart Investing & Trading Score: 37 | |
| Day Percent Change: -0.29% Day Change: -0.01 | |
| Week Change: 2.39% Year-to-date Change: -22.8% | |
| CONN Links: Profile News Message Board | |
| Charts:- Daily , Weekly | |
| Add CONN to Watchlist: View: Get Complete CONN Trend Analysis ➞ | |
 | WING Wingstop Inc. |
| Sector: Services & Goods | |
| SubSector: Restaurants | |
| MarketCap: 1744.7 Millions | |
| Recent Price: 397.84 Smart Investing & Trading Score: 95 | |
| Day Percent Change: 0.51% Day Change: 2.00 | |
| Week Change: 2.39% Year-to-date Change: 55.1% | |
| WING Links: Profile News Message Board | |
| Charts:- Daily , Weekly | |
| Add WING to Watchlist: View: Get Complete WING Trend Analysis ➞ | |
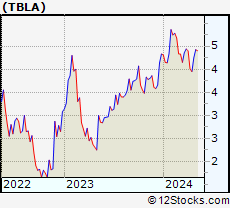 | TBLA Taboola.com Ltd. |
| Sector: Services & Goods | |
| SubSector: Internet Content & Information | |
| MarketCap: 927 Millions | |
| Recent Price: 4.53 Smart Investing & Trading Score: 95 | |
| Day Percent Change: 0.22% Day Change: 0.01 | |
| Week Change: 2.37% Year-to-date Change: 4.6% | |
| TBLA Links: Profile News Message Board | |
| Charts:- Daily , Weekly | |
| Add TBLA to Watchlist: View: Get Complete TBLA Trend Analysis ➞ | |
 | ROL Rollins, Inc. |
| Sector: Services & Goods | |
| SubSector: Business Services | |
| MarketCap: 12827.4 Millions | |
| Recent Price: 47.20 Smart Investing & Trading Score: 100 | |
| Day Percent Change: 0.21% Day Change: 0.10 | |
| Week Change: 2.34% Year-to-date Change: 8.1% | |
| ROL Links: Profile News Message Board | |
| Charts:- Daily , Weekly | |
| Add ROL to Watchlist: View: Get Complete ROL Trend Analysis ➞ | |
 | VSEC VSE Corporation |
| Sector: Services & Goods | |
| SubSector: Technical Services | |
| MarketCap: 183.61 Millions | |
| Recent Price: 84.82 Smart Investing & Trading Score: 100 | |
| Day Percent Change: 0.47% Day Change: 0.40 | |
| Week Change: 2.32% Year-to-date Change: 31.3% | |
| VSEC Links: Profile News Message Board | |
| Charts:- Daily , Weekly | |
| Add VSEC to Watchlist: View: Get Complete VSEC Trend Analysis ➞ | |
 | DXPE DXP Enterprises, Inc. |
| Sector: Services & Goods | |
| SubSector: Industrial Equipment Wholesale | |
| MarketCap: 243.758 Millions | |
| Recent Price: 53.54 Smart Investing & Trading Score: 90 | |
| Day Percent Change: 0.34% Day Change: 0.18 | |
| Week Change: 2.31% Year-to-date Change: 58.9% | |
| DXPE Links: Profile News Message Board | |
| Charts:- Daily , Weekly | |
| Add DXPE to Watchlist: View: Get Complete DXPE Trend Analysis ➞ | |
 | TITN Titan Machinery Inc. |
| Sector: Services & Goods | |
| SubSector: Industrial Equipment Wholesale | |
| MarketCap: 208.958 Millions | |
| Recent Price: 23.34 Smart Investing & Trading Score: 67 | |
| Day Percent Change: 0.09% Day Change: 0.02 | |
| Week Change: 2.28% Year-to-date Change: -19.2% | |
| TITN Links: Profile News Message Board | |
| Charts:- Daily , Weekly | |
| Add TITN to Watchlist: View: Get Complete TITN Trend Analysis ➞ | |
 | VRRM Verra Mobility Corporation |
| Sector: Services & Goods | |
| SubSector: Security & Protection Services | |
| MarketCap: 1265.03 Millions | |
| Recent Price: 26.52 Smart Investing & Trading Score: 100 | |
| Day Percent Change: -0.15% Day Change: -0.04 | |
| Week Change: 2.28% Year-to-date Change: 15.2% | |
| VRRM Links: Profile News Message Board | |
| Charts:- Daily , Weekly | |
| Add VRRM to Watchlist: View: Get Complete VRRM Trend Analysis ➞ | |
 | FWONA Formula One Group |
| Sector: Services & Goods | |
| SubSector: Broadcasting - TV | |
| MarketCap: 17485.6 Millions | |
| Recent Price: 64.31 Smart Investing & Trading Score: 57 | |
| Day Percent Change: 2.16% Day Change: 1.36 | |
| Week Change: 2.26% Year-to-date Change: 10.9% | |
| FWONA Links: Profile News Message Board | |
| Charts:- Daily , Weekly | |
| Add FWONA to Watchlist: View: Get Complete FWONA Trend Analysis ➞ | |
 | ONON On Holding AG |
| Sector: Services & Goods | |
| SubSector: Footwear & Accessories | |
| MarketCap: 10600 Millions | |
| Recent Price: 34.01 Smart Investing & Trading Score: 69 | |
| Day Percent Change: -0.09% Day Change: -0.03 | |
| Week Change: 2.24% Year-to-date Change: 24.7% | |
| ONON Links: Profile News Message Board | |
| Charts:- Daily , Weekly | |
| Add ONON to Watchlist: View: Get Complete ONON Trend Analysis ➞ | |
 | MSA MSA Safety Incorporated |
| Sector: Services & Goods | |
| SubSector: Security & Protection Services | |
| MarketCap: 4167.83 Millions | |
| Recent Price: 187.98 Smart Investing & Trading Score: 73 | |
| Day Percent Change: 1.49% Day Change: 2.76 | |
| Week Change: 2.2% Year-to-date Change: 11.3% | |
| MSA Links: Profile News Message Board | |
| Charts:- Daily , Weekly | |
| Add MSA to Watchlist: View: Get Complete MSA Trend Analysis ➞ | |
 | MOND Mondee Holdings, Inc. |
| Sector: Services & Goods | |
| SubSector: Travel Services | |
| MarketCap: 744 Millions | |
| Recent Price: 2.55 Smart Investing & Trading Score: 100 | |
| Day Percent Change: 4.94% Day Change: 0.12 | |
| Week Change: 2.2% Year-to-date Change: -8.3% | |
| MOND Links: Profile News Message Board | |
| Charts:- Daily , Weekly | |
| Add MOND to Watchlist: View: Get Complete MOND Trend Analysis ➞ | |
 | FWONK Formula One Group |
| Sector: Services & Goods | |
| SubSector: Broadcasting - TV | |
| MarketCap: 4677.53 Millions | |
| Recent Price: 72.07 Smart Investing & Trading Score: 74 | |
| Day Percent Change: 2.28% Day Change: 1.61 | |
| Week Change: 2.15% Year-to-date Change: 14.2% | |
| FWONK Links: Profile News Message Board | |
| Charts:- Daily , Weekly | |
| Add FWONK to Watchlist: View: Get Complete FWONK Trend Analysis ➞ | |
 | IHG InterContinental Hotels Group PLC |
| Sector: Services & Goods | |
| SubSector: Lodging | |
| MarketCap: 6387.46 Millions | |
| Recent Price: 100.11 Smart Investing & Trading Score: 57 | |
| Day Percent Change: 0.57% Day Change: 0.57 | |
| Week Change: 2.14% Year-to-date Change: 9.8% | |
| IHG Links: Profile News Message Board | |
| Charts:- Daily , Weekly | |
| Add IHG to Watchlist: View: Get Complete IHG Trend Analysis ➞ | |
 | OMC Omnicom Group Inc. |
| Sector: Services & Goods | |
| SubSector: Advertising Agencies | |
| MarketCap: 11813.5 Millions | |
| Recent Price: 94.70 Smart Investing & Trading Score: 83 | |
| Day Percent Change: 1.62% Day Change: 1.51 | |
| Week Change: 2.1% Year-to-date Change: 9.5% | |
| OMC Links: Profile News Message Board | |
| Charts:- Daily , Weekly | |
| Add OMC to Watchlist: View: Get Complete OMC Trend Analysis ➞ | |
 | PLTK Playtika Holding Corp. |
| Sector: Services & Goods | |
| SubSector: Electronic Gaming & Multimedia | |
| MarketCap: 4260 Millions | |
| Recent Price: 7.87 Smart Investing & Trading Score: 95 | |
| Day Percent Change: 0.51% Day Change: 0.04 | |
| Week Change: 2.08% Year-to-date Change: -8.8% | |
| PLTK Links: Profile News Message Board | |
| Charts:- Daily , Weekly | |
| Add PLTK to Watchlist: View: Get Complete PLTK Trend Analysis ➞ | |
 | YSG Yatsen Holding Limited |
| Sector: Services & Goods | |
| SubSector: Specialty Retail | |
| MarketCap: 11827 Millions | |
| Recent Price: 4.43 Smart Investing & Trading Score: 78 | |
| Day Percent Change: 1.37% Day Change: 0.06 | |
| Week Change: 2.07% Year-to-date Change: 505.5% | |
| YSG Links: Profile News Message Board | |
| Charts:- Daily , Weekly | |
| Add YSG to Watchlist: View: Get Complete YSG Trend Analysis ➞ | |
 | HGV Hilton Grand Vacations Inc. |
| Sector: Services & Goods | |
| SubSector: Resorts & Casinos | |
| MarketCap: 1333.04 Millions | |
| Recent Price: 44.05 Smart Investing & Trading Score: 57 | |
| Day Percent Change: 0.23% Day Change: 0.10 | |
| Week Change: 2.06% Year-to-date Change: 9.6% | |
| HGV Links: Profile News Message Board | |
| Charts:- Daily , Weekly | |
| Add HGV to Watchlist: View: Get Complete HGV Trend Analysis ➞ | |
 | VAC Marriott Vacations Worldwide Corporation |
| Sector: Services & Goods | |
| SubSector: Resorts & Casinos | |
| MarketCap: 2173.54 Millions | |
| Recent Price: 99.15 Smart Investing & Trading Score: 90 | |
| Day Percent Change: 1.68% Day Change: 1.64 | |
| Week Change: 2.03% Year-to-date Change: 16.8% | |
| VAC Links: Profile News Message Board | |
| Charts:- Daily , Weekly | |
| Add VAC to Watchlist: View: Get Complete VAC Trend Analysis ➞ | |
 | LOCO El Pollo Loco Holdings, Inc. |
| Sector: Services & Goods | |
| SubSector: Restaurants | |
| MarketCap: 296.97 Millions | |
| Recent Price: 10.21 Smart Investing & Trading Score: 100 | |
| Day Percent Change: -1.07% Day Change: -0.11 | |
| Week Change: 2% Year-to-date Change: 15.8% | |
| LOCO Links: Profile News Message Board | |
| Charts:- Daily , Weekly | |
| Add LOCO to Watchlist: View: Get Complete LOCO Trend Analysis ➞ | |
 | EEFT Euronet Worldwide, Inc. |
| Sector: Services & Goods | |
| SubSector: Business Services | |
| MarketCap: 4809.62 Millions | |
| Recent Price: 112.41 Smart Investing & Trading Score: 100 | |
| Day Percent Change: 0.00% Day Change: 0.00 | |
| Week Change: 1.97% Year-to-date Change: 10.8% | |
| EEFT Links: Profile News Message Board | |
| Charts:- Daily , Weekly | |
| Add EEFT to Watchlist: View: Get Complete EEFT Trend Analysis ➞ | |
 | TRU TransUnion |
| Sector: Services & Goods | |
| SubSector: Business Services | |
| MarketCap: 11457.2 Millions | |
| Recent Price: 78.59 Smart Investing & Trading Score: 100 | |
| Day Percent Change: -1.44% Day Change: -1.15 | |
| Week Change: 1.97% Year-to-date Change: 14.4% | |
| TRU Links: Profile News Message Board | |
| Charts:- Daily , Weekly | |
| Add TRU to Watchlist: View: Get Complete TRU Trend Analysis ➞ | |
 | MAN ManpowerGroup Inc. |
| Sector: Services & Goods | |
| SubSector: Staffing & Outsourcing Services | |
| MarketCap: 3436.28 Millions | |
| Recent Price: 77.04 Smart Investing & Trading Score: 100 | |
| Day Percent Change: 0.12% Day Change: 0.09 | |
| Week Change: 1.96% Year-to-date Change: -3.1% | |
| MAN Links: Profile News Message Board | |
| Charts:- Daily , Weekly | |
| Add MAN to Watchlist: View: Get Complete MAN Trend Analysis ➞ | |
| For tabular summary view of above stock list: Summary View ➞ 0 - 25 , 25 - 50 , 50 - 75 , 75 - 100 , 100 - 125 , 125 - 150 , 150 - 175 , 175 - 200 , 200 - 225 , 225 - 250 , 250 - 275 , 275 - 300 , 300 - 325 , 325 - 350 , 350 - 375 , 375 - 400 , 400 - 425 , 425 - 450 , 450 - 475 | ||
| Click To Change The Sort Order: By Market Cap or Company Size Performance: Year-to-date, Week and Day | |
| Select Chart Type: | ||
|
Best Stocks Today 12Stocks.com |
© 2024 12Stocks.com Terms & Conditions Privacy Contact Us
All Information Provided Only For Education And Not To Be Used For Investing or Trading. See Terms & Conditions


One More Thing ... Get Best Stocks Delivered Daily!
Never Ever Miss A Move With Our Top Ten Stocks Lists
Find Best Stocks In Any Market - Bull or Bear Market
Take A Peek At Our Top Ten Stocks Lists: Daily, Weekly, Year-to-Date & Top Trends
Find Best Stocks In Any Market - Bull or Bear Market
Take A Peek At Our Top Ten Stocks Lists: Daily, Weekly, Year-to-Date & Top Trends
Consumer Services Stocks With Best Up Trends [0-bearish to 100-bullish]: Jumia Technologies[100], Newtek Business[100], ATRenew [100], Boqii Holding[100], Mondee [100], WESCO [100], Nextdoor [100], Avnet [100], Daily Journal[100], GreenTree Hospitality[100], Verisk Analytics[100]
Best Consumer Services Stocks Year-to-Date:
U Power[3103.13%], Vroom [2064.76%], Yatsen Holding[505.52%], Fluent [456.72%], Research[148.88%], Codere Online[134.25%], Carvana Co[120.36%], Sweetgreen [105.75%], Smart Share[92.23%], RealReal [88.06%], Jumia Technologies[82.72%] Best Consumer Services Stocks This Week:
Jumia Technologies[27.47%], Children s[20.18%], ATRenew [16.94%], Gogoro [14.94%], Smart Share[13.79%], ThredUp [13.7%], Noodles & [12.66%], Newtek Business[10.48%], Wayfair [9.37%], MYT Netherlands[8%], CareDx [7.82%] Best Consumer Services Stocks Daily:
Jumia Technologies[17.92%], Children s[16.44%], Newtek Business[11.28%], ATRenew [8.86%], Boqii Holding[8.13%], Applied UV[7.50%], Vision Marine[7.35%], Allego N.V[6.96%], Lanvin [6.83%], Smart Share[6.45%], Gaia [6.25%]