
 Login Sign Up


| |||||
 |  | ||||

| 12Stocks.com Market Intelligence |
Best Consumer Services Stocks
| In a hurry? Services & Goods Stocks: Performance Trends Table, Stock Charts
Sort Consumer Services: Daily, Weekly, Year-to-Date, Market Cap & Trends. Filter Services & Goods stocks list by size: All Large Mid-Range Small |
| 12Stocks.com Consumer Services Stocks Performances & Trends Daily | |||||||||
|
|  The overall Smart Investing & Trading Score is 58 (0-bearish to 100-bullish) which puts Consumer Services sector in short term neutral trend. The Smart Investing & Trading Score from previous trading session is 23 and hence an improvement of trend.
| ||||||||
Here are the Smart Investing & Trading Scores of the most requested Consumer Services stocks at 12Stocks.com (click stock name for detailed review):
|


| Consider signing up for our daily 12Stocks.com "Best Stocks Newsletter". You will never ever miss a big stock move again! |
| 12Stocks.com: Investing in Consumer Services sector with Stocks | |
|
The following table helps investors and traders sort through current performance and trends (as measured by Smart Investing & Trading Score) of various
stocks in the Consumer Services sector. Quick View: Move mouse or cursor over stock symbol (ticker) to view short-term Technical chart and over stock name to view long term chart. Click on  to add stock symbol to your watchlist and to add stock symbol to your watchlist and  to view watchlist. Click on any ticker or stock name for detailed market intelligence report for that stock. to view watchlist. Click on any ticker or stock name for detailed market intelligence report for that stock. |
12Stocks.com Performance of Stocks in Consumer Services Sector
| Ticker | Stock Name | Watchlist | Category | Recent Price | Smart Investing & Trading Score | Change % | Weekly Change% |
| TSQ | Townsquare Media |   | Broadcasting | 12.60 | 93 | 2.19% | 5.79% |
| RCL | Royal Caribbean | | Casinos | 136.67 | 88 | 3.55% | 5.77% |
| TLYS | Tilly s | | Apparel | 6.08 | 49 | 2.70% | 5.74% |
| CARG | CarGurus | | Automobile | 23.47 | 83 | 3.71% | 5.70% |
| DKS | DICK S | | Retail | 206.09 | 68 | 3.73% | 5.64% |
| TBLA | Taboola.com | | Internet Content & Information | 4.17 | 49 | 4.51% | 5.57% |
| PSNYW | Polestar Automotive | | Auto Manufacturers | 0.16 | 32 | 3.33% | 5.44% |
| CUK | Carnival | | Entertainment | 13.42 | 49 | 3.71% | 5.42% |
| EDU | New Oriental | | Education | 89.59 | 90 | 1.92% | 5.41% |
| FYBR | Frontier | | Telecom Services | 22.87 | 30 | 4.91% | 5.39% |
| PENN | Penn National | | Casinos | 17.43 | 67 | 2.95% | 5.38% |
| SSP | E.W. Scripps | | Broadcasting | 3.78 | 74 | 1.61% | 5.29% |
| HVT | Haverty Furniture | | Retail | 32.80 | 74 | 4.13% | 5.26% |
| GPI | 1 | | Automobile | 279.50 | 90 | 4.13% | 5.26% |
| CIX | CompX | | Security | 32.99 | 68 | 4.63% | 5.20% |
| TCOM | Trip.com | | Lodging | 50.48 | 93 | 2.29% | 5.17% |
| DFIN | Donnelley Financial | | Services | 65.38 | 95 | 2.28% | 5.08% |
| IAS | Integral Ad | | Advertising | 9.57 | 42 | 3.91% | 5.05% |
| WING | Wingstop | | Restaurants | 364.73 | 85 | 2.81% | 5.00% |
| CSSEP | Chicken Soup | | Broadcasting | 0.42 | 30 | 6.98% | 5.00% |
| BABA | Alibaba | | Retail | 72.51 | 82 | 2.59% | 4.98% |
| CSV | Carriage Services | | Services | 25.18 | 93 | 1.00% | 4.92% |
| DESP | Despegar.com | | Lodging | 12.22 | 83 | 3.30% | 4.89% |
| GHG | GreenTree Hospitality | | Lodging | 2.97 | 42 | 0.17% | 4.80% |
| HTHT | Huazhu | | Lodging | 38.65 | 80 | 2.38% | 4.77% |
| For chart view version of above stock list: Chart View ➞ 0 - 25 , 25 - 50 , 50 - 75 , 75 - 100 , 100 - 125 , 125 - 150 , 150 - 175 , 175 - 200 , 200 - 225 , 225 - 250 , 250 - 275 , 275 - 300 , 300 - 325 , 325 - 350 , 350 - 375 , 375 - 400 , 400 - 425 , 425 - 450 , 450 - 475 | ||
 | Click To Change The Sort Order: By Market Cap or Company Size Performance: Year-to-date, Week and Day |  |
|
Get the most comprehensive stock market coverage daily at 12Stocks.com ➞ Best Stocks Today ➞ Best Stocks Weekly ➞ Best Stocks Year-to-Date ➞ Best Stocks Trends ➞  Best Stocks Today 12Stocks.com Best Nasdaq Stocks ➞ Best S&P 500 Stocks ➞ Best Tech Stocks ➞ Best Biotech Stocks ➞ |
| Detailed Overview of Consumer Services Stocks |
| Consumer Services Technical Overview, Leaders & Laggards, Top Consumer Services ETF Funds & Detailed Consumer Services Stocks List, Charts, Trends & More |
| Consumer Services Sector: Technical Analysis, Trends & YTD Performance | |
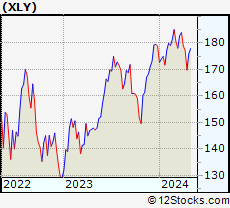
| Consumer Services sector is composed of stocks
from retail, entertainment, media/publishing, consumer goods
and services subsectors. Consumer Services sector, as represented by XLY, an exchange-traded fund [ETF] that holds basket of Consumer Services stocks (e.g, Walmart, Alibaba) is down by -3.51% and is currently underperforming the overall market by -9.15% year-to-date. Below is a quick view of Technical charts and trends: |
|
 XLY Weekly Chart |
|
| Long Term Trend: Good | |
| Medium Term Trend: Not Good | |
 XLY Daily Chart |
|
| Short Term Trend: Very Good | |
| Overall Trend Score: 58 | |
| YTD Performance: -3.51% | |
| **Trend Scores & Views Are Only For Educational Purposes And Not For Investing | |
| 12Stocks.com: Top Performing Consumer Services Sector Stocks | ||||||||||||||||||||||||||||||||||||||||||||||||
 The top performing Consumer Services sector stocks year to date are
Now, more recently, over last week, the top performing Consumer Services sector stocks on the move are


|
||||||||||||||||||||||||||||||||||||||||||||||||
| 12Stocks.com: Investing in Consumer Services Sector using Exchange Traded Funds | |
|
The following table shows list of key exchange traded funds (ETF) that
help investors track Consumer Services Index. For detailed view, check out our ETF Funds section of our website. Quick View: Move mouse or cursor over ETF symbol (ticker) to view short-term Technical chart and over ETF name to view long term chart. Click on ticker or stock name for detailed view. Click on to add stock symbol to your watchlist and to view watchlist. |
12Stocks.com List of ETFs that track Consumer Services Index
| Ticker | ETF Name | Watchlist | Recent Price | Smart Investing & Trading Score | Change % | Week % | Year-to-date % |
| XLY | Consumer Discret Sel | | 172.54 | 58 | 1.19 | 1.64 | -3.51% |
| RTH | Retail | | 200.49 | 58 | 0.15 | 0.94 | 6.51% |
| IYC | Consumer Services | | 77.59 | 51 | 1.27 | 1.73 | 2.4% |
| XRT | Retail | | 73.04 | 70 | 2.20 | 2.63 | 1% |
| IYK | Consumer Goods | | 66.54 | 100 | 0.18 | 1.11 | 4.13% |
| UCC | Consumer Services | | 32.68 | 45 | 1.64 | 3.49 | -8.99% |
| RETL | Retail Bull 3X | | 8.73 | 70 | 5.95 | 7.51 | -4.28% |
| RXI | Globl Consumer Discretionary | | 159.29 | 58 | 1.23 | 1.36 | 0.14% |
| SCC | Short Consumer Services | | 16.43 | 42 | -2.23 | -3.12 | 7.19% |
| UGE | Consumer Goods | | 17.03 | 80 | 0.29 | 2.42 | 8.19% |
| 12Stocks.com: Charts, Trends, Fundamental Data and Performances of Consumer Services Stocks | |
|
We now take in-depth look at all Consumer Services stocks including charts, multi-period performances and overall trends (as measured by Smart Investing & Trading Score). One can sort Consumer Services stocks (click link to choose) by Daily, Weekly and by Year-to-Date performances. Also, one can sort by size of the company or by market capitalization. |
| Select Your Default Chart Type: | |||||
| |||||
| Click on stock symbol or name for detailed view. Click on to add stock symbol to your watchlist and to view watchlist. Quick View: Move mouse or cursor over "Daily" to quickly view daily Technical stock chart and over "Weekly" to view weekly Technical stock chart. | |||||

 | TSQ Townsquare Media, Inc. |
| Sector: Services & Goods | |
| SubSector: Broadcasting - Radio | |
| MarketCap: 101.795 Millions | |
| Recent Price: 12.60 Smart Investing & Trading Score: 93 | |
| Day Percent Change: 2.19% Day Change: 0.27 | |
| Week Change: 5.79% Year-to-date Change: 19.3% | |
| TSQ Links: Profile News Message Board | |
| Charts:- Daily , Weekly | |
| Add TSQ to Watchlist: View: Get Complete TSQ Trend Analysis ➞ | |
 | RCL Royal Caribbean Cruises Ltd. |
| Sector: Services & Goods | |
| SubSector: Resorts & Casinos | |
| MarketCap: 7294.14 Millions | |
| Recent Price: 136.67 Smart Investing & Trading Score: 88 | |
| Day Percent Change: 3.55% Day Change: 4.68 | |
| Week Change: 5.77% Year-to-date Change: 5.5% | |
| RCL Links: Profile News Message Board | |
| Charts:- Daily , Weekly | |
| Add RCL to Watchlist: View: Get Complete RCL Trend Analysis ➞ | |
 | TLYS Tilly s, Inc. |
| Sector: Services & Goods | |
| SubSector: Apparel Stores | |
| MarketCap: 127.408 Millions | |
| Recent Price: 6.08 Smart Investing & Trading Score: 49 | |
| Day Percent Change: 2.70% Day Change: 0.16 | |
| Week Change: 5.74% Year-to-date Change: -19.4% | |
| TLYS Links: Profile News Message Board | |
| Charts:- Daily , Weekly | |
| Add TLYS to Watchlist: View: Get Complete TLYS Trend Analysis ➞ | |
 | CARG CarGurus, Inc. |
| Sector: Services & Goods | |
| SubSector: Auto Dealerships | |
| MarketCap: 2099.31 Millions | |
| Recent Price: 23.47 Smart Investing & Trading Score: 83 | |
| Day Percent Change: 3.71% Day Change: 0.84 | |
| Week Change: 5.7% Year-to-date Change: -2.9% | |
| CARG Links: Profile News Message Board | |
| Charts:- Daily , Weekly | |
| Add CARG to Watchlist: View: Get Complete CARG Trend Analysis ➞ | |
 | DKS DICK S Sporting Goods, Inc. |
| Sector: Services & Goods | |
| SubSector: Sporting Goods Stores | |
| MarketCap: 1672.04 Millions | |
| Recent Price: 206.09 Smart Investing & Trading Score: 68 | |
| Day Percent Change: 3.73% Day Change: 7.42 | |
| Week Change: 5.64% Year-to-date Change: 40.2% | |
| DKS Links: Profile News Message Board | |
| Charts:- Daily , Weekly | |
| Add DKS to Watchlist: View: Get Complete DKS Trend Analysis ➞ | |
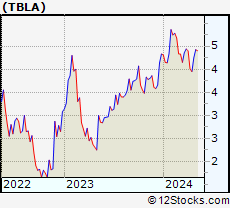 | TBLA Taboola.com Ltd. |
| Sector: Services & Goods | |
| SubSector: Internet Content & Information | |
| MarketCap: 927 Millions | |
| Recent Price: 4.17 Smart Investing & Trading Score: 49 | |
| Day Percent Change: 4.51% Day Change: 0.18 | |
| Week Change: 5.57% Year-to-date Change: -3.7% | |
| TBLA Links: Profile News Message Board | |
| Charts:- Daily , Weekly | |
| Add TBLA to Watchlist: View: Get Complete TBLA Trend Analysis ➞ | |
 | PSNYW Polestar Automotive Holding UK PLC |
| Sector: Services & Goods | |
| SubSector: Auto Manufacturers | |
| MarketCap: 1450 Millions | |
| Recent Price: 0.16 Smart Investing & Trading Score: 32 | |
| Day Percent Change: 3.33% Day Change: 0.01 | |
| Week Change: 5.44% Year-to-date Change: -36.1% | |
| PSNYW Links: Profile News Message Board | |
| Charts:- Daily , Weekly | |
| Add PSNYW to Watchlist: View: Get Complete PSNYW Trend Analysis ➞ | |
 | CUK Carnival Corporation & Plc |
| Sector: Services & Goods | |
| SubSector: General Entertainment | |
| MarketCap: 10703.9 Millions | |
| Recent Price: 13.42 Smart Investing & Trading Score: 49 | |
| Day Percent Change: 3.71% Day Change: 0.48 | |
| Week Change: 5.42% Year-to-date Change: -20.4% | |
| CUK Links: Profile News Message Board | |
| Charts:- Daily , Weekly | |
| Add CUK to Watchlist: View: Get Complete CUK Trend Analysis ➞ | |
 | EDU New Oriental Education & Technology Group Inc. |
| Sector: Services & Goods | |
| SubSector: Education & Training Services | |
| MarketCap: 18673.7 Millions | |
| Recent Price: 89.59 Smart Investing & Trading Score: 90 | |
| Day Percent Change: 1.92% Day Change: 1.69 | |
| Week Change: 5.41% Year-to-date Change: 22.3% | |
| EDU Links: Profile News Message Board | |
| Charts:- Daily , Weekly | |
| Add EDU to Watchlist: View: Get Complete EDU Trend Analysis ➞ | |
 | FYBR Frontier Communications Parent, Inc. |
| Sector: Services & Goods | |
| SubSector: Telecom Services | |
| MarketCap: 4460 Millions | |
| Recent Price: 22.87 Smart Investing & Trading Score: 30 | |
| Day Percent Change: 4.91% Day Change: 1.07 | |
| Week Change: 5.39% Year-to-date Change: -9.4% | |
| FYBR Links: Profile News Message Board | |
| Charts:- Daily , Weekly | |
| Add FYBR to Watchlist: View: Get Complete FYBR Trend Analysis ➞ | |
 | PENN Penn National Gaming, Inc. |
| Sector: Services & Goods | |
| SubSector: Resorts & Casinos | |
| MarketCap: 1183.84 Millions | |
| Recent Price: 17.43 Smart Investing & Trading Score: 67 | |
| Day Percent Change: 2.95% Day Change: 0.50 | |
| Week Change: 5.38% Year-to-date Change: -33.0% | |
| PENN Links: Profile News Message Board | |
| Charts:- Daily , Weekly | |
| Add PENN to Watchlist: View: Get Complete PENN Trend Analysis ➞ | |
 | SSP The E.W. Scripps Company |
| Sector: Services & Goods | |
| SubSector: Broadcasting - TV | |
| MarketCap: 766.163 Millions | |
| Recent Price: 3.78 Smart Investing & Trading Score: 74 | |
| Day Percent Change: 1.61% Day Change: 0.06 | |
| Week Change: 5.29% Year-to-date Change: -52.7% | |
| SSP Links: Profile News Message Board | |
| Charts:- Daily , Weekly | |
| Add SSP to Watchlist: View: Get Complete SSP Trend Analysis ➞ | |
 | HVT Haverty Furniture Companies, Inc. |
| Sector: Services & Goods | |
| SubSector: Home Furnishing Stores | |
| MarketCap: 253.125 Millions | |
| Recent Price: 32.80 Smart Investing & Trading Score: 74 | |
| Day Percent Change: 4.13% Day Change: 1.30 | |
| Week Change: 5.26% Year-to-date Change: -7.6% | |
| HVT Links: Profile News Message Board | |
| Charts:- Daily , Weekly | |
| Add HVT to Watchlist: View: Get Complete HVT Trend Analysis ➞ | |
 | GPI Group 1 Automotive, Inc. |
| Sector: Services & Goods | |
| SubSector: Auto Dealerships | |
| MarketCap: 921.021 Millions | |
| Recent Price: 279.50 Smart Investing & Trading Score: 90 | |
| Day Percent Change: 4.13% Day Change: 11.08 | |
| Week Change: 5.26% Year-to-date Change: -8.3% | |
| GPI Links: Profile News Message Board | |
| Charts:- Daily , Weekly | |
| Add GPI to Watchlist: View: Get Complete GPI Trend Analysis ➞ | |
 | CIX CompX International Inc. |
| Sector: Services & Goods | |
| SubSector: Security & Protection Services | |
| MarketCap: 189.603 Millions | |
| Recent Price: 32.99 Smart Investing & Trading Score: 68 | |
| Day Percent Change: 4.63% Day Change: 1.46 | |
| Week Change: 5.2% Year-to-date Change: 30.5% | |
| CIX Links: Profile News Message Board | |
| Charts:- Daily , Weekly | |
| Add CIX to Watchlist: View: Get Complete CIX Trend Analysis ➞ | |
 | TCOM Trip.com Group Limited |
| Sector: Services & Goods | |
| SubSector: Lodging | |
| MarketCap: 13449.6 Millions | |
| Recent Price: 50.48 Smart Investing & Trading Score: 93 | |
| Day Percent Change: 2.29% Day Change: 1.13 | |
| Week Change: 5.17% Year-to-date Change: 40.2% | |
| TCOM Links: Profile News Message Board | |
| Charts:- Daily , Weekly | |
| Add TCOM to Watchlist: View: Get Complete TCOM Trend Analysis ➞ | |
 | DFIN Donnelley Financial Solutions, Inc. |
| Sector: Services & Goods | |
| SubSector: Business Services | |
| MarketCap: 229.882 Millions | |
| Recent Price: 65.38 Smart Investing & Trading Score: 95 | |
| Day Percent Change: 2.28% Day Change: 1.46 | |
| Week Change: 5.08% Year-to-date Change: 4.8% | |
| DFIN Links: Profile News Message Board | |
| Charts:- Daily , Weekly | |
| Add DFIN to Watchlist: View: Get Complete DFIN Trend Analysis ➞ | |
 | IAS Integral Ad Science Holding Corp. |
| Sector: Services & Goods | |
| SubSector: Advertising Agencies | |
| MarketCap: 2760 Millions | |
| Recent Price: 9.57 Smart Investing & Trading Score: 42 | |
| Day Percent Change: 3.91% Day Change: 0.36 | |
| Week Change: 5.05% Year-to-date Change: -34.1% | |
| IAS Links: Profile News Message Board | |
| Charts:- Daily , Weekly | |
| Add IAS to Watchlist: View: Get Complete IAS Trend Analysis ➞ | |
 | WING Wingstop Inc. |
| Sector: Services & Goods | |
| SubSector: Restaurants | |
| MarketCap: 1744.7 Millions | |
| Recent Price: 364.73 Smart Investing & Trading Score: 85 | |
| Day Percent Change: 2.81% Day Change: 9.98 | |
| Week Change: 5% Year-to-date Change: 42.2% | |
| WING Links: Profile News Message Board | |
| Charts:- Daily , Weekly | |
| Add WING to Watchlist: View: Get Complete WING Trend Analysis ➞ | |
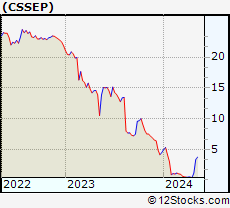 | CSSEP Chicken Soup for the Soul Entertainment, Inc. |
| Sector: Services & Goods | |
| SubSector: Broadcasting - TV | |
| MarketCap: 195.763 Millions | |
| Recent Price: 0.42 Smart Investing & Trading Score: 30 | |
| Day Percent Change: 6.98% Day Change: 0.03 | |
| Week Change: 5% Year-to-date Change: -90.7% | |
| CSSEP Links: Profile News Message Board | |
| Charts:- Daily , Weekly | |
| Add CSSEP to Watchlist: View: Get Complete CSSEP Trend Analysis ➞ | |
 | BABA Alibaba Group Holding Limited |
| Sector: Services & Goods | |
| SubSector: Specialty Retail, Other | |
| MarketCap: 522666 Millions | |
| Recent Price: 72.51 Smart Investing & Trading Score: 82 | |
| Day Percent Change: 2.59% Day Change: 1.83 | |
| Week Change: 4.98% Year-to-date Change: -6.5% | |
| BABA Links: Profile News Message Board | |
| Charts:- Daily , Weekly | |
| Add BABA to Watchlist: View: Get Complete BABA Trend Analysis ➞ | |
 | CSV Carriage Services, Inc. |
| Sector: Services & Goods | |
| SubSector: Personal Services | |
| MarketCap: 304.725 Millions | |
| Recent Price: 25.18 Smart Investing & Trading Score: 93 | |
| Day Percent Change: 1.00% Day Change: 0.25 | |
| Week Change: 4.92% Year-to-date Change: 0.7% | |
| CSV Links: Profile News Message Board | |
| Charts:- Daily , Weekly | |
| Add CSV to Watchlist: View: Get Complete CSV Trend Analysis ➞ | |
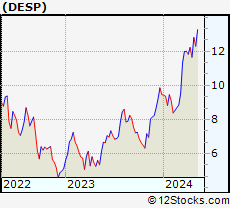 | DESP Despegar.com, Corp. |
| Sector: Services & Goods | |
| SubSector: Lodging | |
| MarketCap: 547.536 Millions | |
| Recent Price: 12.22 Smart Investing & Trading Score: 83 | |
| Day Percent Change: 3.30% Day Change: 0.39 | |
| Week Change: 4.89% Year-to-date Change: 29.2% | |
| DESP Links: Profile News Message Board | |
| Charts:- Daily , Weekly | |
| Add DESP to Watchlist: View: Get Complete DESP Trend Analysis ➞ | |
 | GHG GreenTree Hospitality Group Ltd. |
| Sector: Services & Goods | |
| SubSector: Lodging | |
| MarketCap: 1195.36 Millions | |
| Recent Price: 2.97 Smart Investing & Trading Score: 42 | |
| Day Percent Change: 0.17% Day Change: 0.01 | |
| Week Change: 4.8% Year-to-date Change: -21.0% | |
| GHG Links: Profile News Message Board | |
| Charts:- Daily , Weekly | |
| Add GHG to Watchlist: View: Get Complete GHG Trend Analysis ➞ | |
 | HTHT Huazhu Group Limited |
| Sector: Services & Goods | |
| SubSector: Lodging | |
| MarketCap: 9164.46 Millions | |
| Recent Price: 38.65 Smart Investing & Trading Score: 80 | |
| Day Percent Change: 2.38% Day Change: 0.90 | |
| Week Change: 4.77% Year-to-date Change: 15.6% | |
| HTHT Links: Profile News Message Board | |
| Charts:- Daily , Weekly | |
| Add HTHT to Watchlist: View: Get Complete HTHT Trend Analysis ➞ | |
| For tabular summary view of above stock list: Summary View ➞ 0 - 25 , 25 - 50 , 50 - 75 , 75 - 100 , 100 - 125 , 125 - 150 , 150 - 175 , 175 - 200 , 200 - 225 , 225 - 250 , 250 - 275 , 275 - 300 , 300 - 325 , 325 - 350 , 350 - 375 , 375 - 400 , 400 - 425 , 425 - 450 , 450 - 475 | ||
| Click To Change The Sort Order: By Market Cap or Company Size Performance: Year-to-date, Week and Day | |
| Select Chart Type: | ||
|
Best Stocks Today 12Stocks.com |
© 2024 12Stocks.com Terms & Conditions Privacy Contact Us
All Information Provided Only For Education And Not To Be Used For Investing or Trading. See Terms & Conditions


One More Thing ... Get Best Stocks Delivered Daily!
Never Ever Miss A Move With Our Top Ten Stocks Lists
Find Best Stocks In Any Market - Bull or Bear Market
Take A Peek At Our Top Ten Stocks Lists: Daily, Weekly, Year-to-Date & Top Trends
Find Best Stocks In Any Market - Bull or Bear Market
Take A Peek At Our Top Ten Stocks Lists: Daily, Weekly, Year-to-Date & Top Trends
Consumer Services Stocks With Best Up Trends [0-bearish to 100-bullish]: Hibbett Sports[100], Gannett Co[100], MYT Netherlands[100], Dillard s[100], Napco Security[100], Lands [100], MINISO [100], Brinker [100], Boot Barn[100], Cheesecake Factory[100], Deluxe [100]
Best Consumer Services Stocks Year-to-Date:
U Power[2801.79%], Vroom [1827.73%], Yatsen Holding[437.18%], Fluent [289.55%], Codere Online[134.25%], Research[101.58%], Sweetgreen [96.9%], RealReal [71.64%], Bright Scholar[64.8%], Spotify Technology[61.41%], PaySign [59.64%] Best Consumer Services Stocks This Week:
Hibbett Sports[21.1%], Noodles & [17.65%], Jumia Technologies[17.51%], Allbirds [15.68%], DoubleDown Interactive[15.06%], Pinduoduo [12.8%], MYT Netherlands[12.01%], China Online[11.9%], iHeartMedia [11.58%], Zumiez [11.4%], Ameresco [11.12%] Best Consumer Services Stocks Daily:
Hibbett Sports[18.84%], SES AI[12.17%], Golden Heaven[11.75%], Spotify Technology[11.41%], Jumia Technologies[11.30%], Sweetgreen [9.50%], Designer Brands[9.49%], Ameresco [9.43%], China Online[9.37%], iHeartMedia [9.00%], Noodles & [8.95%]