
 Login Sign Up


| |||||
 |  | ||||

| 12Stocks.com Market Intelligence |
Best Consumer Services Stocks
| In a hurry? Services & Goods Stocks: Performance Trends Table, Stock Charts
Sort Consumer Services: Daily, Weekly, Year-to-Date, Market Cap & Trends. Filter Services & Goods stocks list by size: All Large Mid-Range Small |
| 12Stocks.com Consumer Services Stocks Performances & Trends Daily | |||||||||
|
|  The overall Smart Investing & Trading Score is 23 (0-bearish to 100-bullish) which puts Consumer Services sector in short term bearish to neutral trend. The Smart Investing & Trading Score from previous trading session is 13 and hence an improvement of trend.
| ||||||||
Here are the Smart Investing & Trading Scores of the most requested Consumer Services stocks at 12Stocks.com (click stock name for detailed review):
|


| Consider signing up for our daily 12Stocks.com "Best Stocks Newsletter". You will never ever miss a big stock move again! |
| 12Stocks.com: Investing in Consumer Services sector with Stocks | |
|
The following table helps investors and traders sort through current performance and trends (as measured by Smart Investing & Trading Score) of various
stocks in the Consumer Services sector. Quick View: Move mouse or cursor over stock symbol (ticker) to view short-term Technical chart and over stock name to view long term chart. Click on  to add stock symbol to your watchlist and to add stock symbol to your watchlist and  to view watchlist. Click on any ticker or stock name for detailed market intelligence report for that stock. to view watchlist. Click on any ticker or stock name for detailed market intelligence report for that stock. |
12Stocks.com Performance of Stocks in Consumer Services Sector
| Ticker | Stock Name | Watchlist | Category | Recent Price | Smart Investing & Trading Score | Change % | Weekly Change% |
| PDD | Pinduoduo |   | Retail | 124.14 | 64 | 9.38% | 9.38% |
| BIRD | Allbirds | | Apparel Retail | 0.65 | 69 | 9.07% | 9.07% |
| AMC | AMC Entertainment | | Entertainment | 3.42 | 64 | 8.23% | 8.23% |
| NDLS | Noodles & | | Restaurants | 1.28 | 42 | 7.98% | 7.98% |
| DDI | DoubleDown Interactive | | Electronic Gaming & Multimedia | 10.76 | 80 | 6.64% | 6.64% |
| KSS | Kohl s | | Department | 24.70 | 54 | 6.51% | 6.51% |
| REAL | RealReal | | Retail | 3.31 | 70 | 6.43% | 6.43% |
| QRTEB | Qurate Retail | | Retail | 3.99 | 27 | 5.84% | 5.84% |
| JMIA | Jumia Technologies | | Retail | 4.16 | 63 | 5.58% | 5.58% |
| BZUN | Baozun | | Retail | 2.44 | 88 | 5.17% | 5.17% |
| YSG | Yatsen Holding | | Specialty Retail | 3.80 | 88 | 5.12% | 5.12% |
| VMAR | Vision Marine | | Leisure | 0.59 | 47 | 5.09% | 5.09% |
| SIG | Signet Jewelers | | Retail | 100.11 | 67 | 4.86% | 4.86% |
| MYTE | MYT Netherlands | | Luxury Goods | 4.01 | 100 | 4.70% | 4.70% |
| GHG | GreenTree Hospitality | | Lodging | 2.96 | 35 | 4.62% | 4.62% |
| ZUMZ | Zumiez | | Retail | 15.87 | 74 | 4.61% | 4.61% |
| TAL | TAL Education | | Education | 11.95 | 90 | 4.55% | 4.55% |
| MOGU | MOGU | | Retail | 2.08 | 100 | 4.52% | 4.52% |
| URBN | Urban Outfitters | | Apparel | 38.56 | 58 | 4.27% | 4.27% |
| ANF | Abercrombie & Fitch Co | | Apparel | 114.84 | 58 | 4.06% | 4.06% |
| AMBP | Ardagh Metal | | Packaging | 3.63 | 74 | 4.01% | 4.01% |
| YI | 111 | | Drug Stores | 1.06 | 42 | 3.92% | 3.92% |
| CSV | Carriage Services | | Services | 24.93 | 83 | 3.88% | 3.88% |
| RRGB | Red Robin | | Restaurants | 6.64 | 64 | 3.75% | 3.75% |
| LSXMB | Liberty SiriusXM | | Broadcasting | 25.69 | 35 | 3.67% | 3.67% |
| For chart view version of above stock list: Chart View ➞ 0 - 25 , 25 - 50 , 50 - 75 , 75 - 100 , 100 - 125 , 125 - 150 , 150 - 175 , 175 - 200 , 200 - 225 , 225 - 250 , 250 - 275 , 275 - 300 , 300 - 325 , 325 - 350 , 350 - 375 , 375 - 400 , 400 - 425 , 425 - 450 , 450 - 475 | ||
 | Click To Change The Sort Order: By Market Cap or Company Size Performance: Year-to-date, Week and Day |  |
|
Get the most comprehensive stock market coverage daily at 12Stocks.com ➞ Best Stocks Today ➞ Best Stocks Weekly ➞ Best Stocks Year-to-Date ➞ Best Stocks Trends ➞  Best Stocks Today 12Stocks.com Best Nasdaq Stocks ➞ Best S&P 500 Stocks ➞ Best Tech Stocks ➞ Best Biotech Stocks ➞ |
| Detailed Overview of Consumer Services Stocks |
| Consumer Services Technical Overview, Leaders & Laggards, Top Consumer Services ETF Funds & Detailed Consumer Services Stocks List, Charts, Trends & More |
| Consumer Services Sector: Technical Analysis, Trends & YTD Performance | |
| Consumer Services sector is composed of stocks
from retail, entertainment, media/publishing, consumer goods
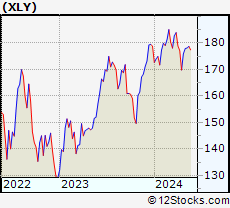
and services subsectors. Consumer Services sector, as represented by XLY, an exchange-traded fund [ETF] that holds basket of Consumer Services stocks (e.g, Walmart, Alibaba) is down by -4.64% and is currently underperforming the overall market by -9.03% year-to-date. Below is a quick view of Technical charts and trends: |
|
 XLY Weekly Chart |
|
| Long Term Trend: Not Good | |
| Medium Term Trend: Not Good | |
 XLY Daily Chart |
|
| Short Term Trend: Deteriorating | |
| Overall Trend Score: 23 | |
| YTD Performance: -4.64% | |
| **Trend Scores & Views Are Only For Educational Purposes And Not For Investing | |
| 12Stocks.com: Top Performing Consumer Services Sector Stocks | ||||||||||||||||||||||||||||||||||||||||||||||||
 The top performing Consumer Services sector stocks year to date are
Now, more recently, over last week, the top performing Consumer Services sector stocks on the move are


|
||||||||||||||||||||||||||||||||||||||||||||||||
| 12Stocks.com: Investing in Consumer Services Sector using Exchange Traded Funds | |
|
The following table shows list of key exchange traded funds (ETF) that
help investors track Consumer Services Index. For detailed view, check out our ETF Funds section of our website. Quick View: Move mouse or cursor over ETF symbol (ticker) to view short-term Technical chart and over ETF name to view long term chart. Click on ticker or stock name for detailed view. Click on to add stock symbol to your watchlist and to view watchlist. |
12Stocks.com List of ETFs that track Consumer Services Index
| Ticker | ETF Name | Watchlist | Recent Price | Smart Investing & Trading Score | Change % | Week % | Year-to-date % |
| XLY | Consumer Discret Sel | | 170.51 | 23 | 0.44 | 0.44 | -4.64% |
| RTH | Retail | | 200.18 | 51 | 0.78 | 0.78 | 6.35% |
| IYC | Consumer Services | | 76.62 | 43 | 0.46 | 0.46 | 1.12% |
| XRT | Retail | | 71.47 | 58 | 0.42 | 0.42 | -1.18% |
| IYK | Consumer Goods | | 66.42 | 100 | 0.93 | 0.93 | 3.94% |
| UCC | Consumer Services | | 32.15 | 25 | 1.82 | 1.82 | -10.46% |
| RETL | Retail Bull 3X | | 8.24 | 63 | 1.48 | 1.48 | -9.65% |
| RXI | Globl Consumer Discretionary | | 157.35 | 51 | 0.13 | 0.13 | -1.08% |
| SCC | Short Consumer Services | | 16.80 | 70 | -0.91 | -0.91 | 9.63% |
| UGE | Consumer Goods | | 16.98 | 80 | 2.12 | 2.12 | 7.87% |
| 12Stocks.com: Charts, Trends, Fundamental Data and Performances of Consumer Services Stocks | |
|
We now take in-depth look at all Consumer Services stocks including charts, multi-period performances and overall trends (as measured by Smart Investing & Trading Score). One can sort Consumer Services stocks (click link to choose) by Daily, Weekly and by Year-to-Date performances. Also, one can sort by size of the company or by market capitalization. |
| Select Your Default Chart Type: | |||||
| |||||
| Click on stock symbol or name for detailed view. Click on to add stock symbol to your watchlist and to view watchlist. Quick View: Move mouse or cursor over "Daily" to quickly view daily Technical stock chart and over "Weekly" to view weekly Technical stock chart. | |||||

 | PDD Pinduoduo Inc. |
| Sector: Services & Goods | |
| SubSector: Specialty Retail, Other | |
| MarketCap: 41696.2 Millions | |
| Recent Price: 124.14 Smart Investing & Trading Score: 64 | |
| Day Percent Change: 9.38% Day Change: 10.65 | |
| Week Change: 9.38% Year-to-date Change: -15.2% | |
| PDD Links: Profile News Message Board | |
| Charts:- Daily , Weekly | |
| Add PDD to Watchlist: View: Get Complete PDD Trend Analysis ➞ | |
 | BIRD Allbirds, Inc. |
| Sector: Services & Goods | |
| SubSector: Apparel Retail | |
| MarketCap: 184 Millions | |
| Recent Price: 0.65 Smart Investing & Trading Score: 69 | |
| Day Percent Change: 9.07% Day Change: 0.05 | |
| Week Change: 9.07% Year-to-date Change: -47.0% | |
| BIRD Links: Profile News Message Board | |
| Charts:- Daily , Weekly | |
| Add BIRD to Watchlist: View: Get Complete BIRD Trend Analysis ➞ | |
 | AMC AMC Entertainment Holdings, Inc. |
| Sector: Services & Goods | |
| SubSector: Movie Production, Theaters | |
| MarketCap: 415.929 Millions | |
| Recent Price: 3.42 Smart Investing & Trading Score: 64 | |
| Day Percent Change: 8.23% Day Change: 0.26 | |
| Week Change: 8.23% Year-to-date Change: -44.1% | |
| AMC Links: Profile News Message Board | |
| Charts:- Daily , Weekly | |
| Add AMC to Watchlist: View: Get Complete AMC Trend Analysis ➞ | |
 | NDLS Noodles & Company |
| Sector: Services & Goods | |
| SubSector: Restaurants | |
| MarketCap: 188.77 Millions | |
| Recent Price: 1.28 Smart Investing & Trading Score: 42 | |
| Day Percent Change: 7.98% Day Change: 0.09 | |
| Week Change: 7.98% Year-to-date Change: -59.2% | |
| NDLS Links: Profile News Message Board | |
| Charts:- Daily , Weekly | |
| Add NDLS to Watchlist: View: Get Complete NDLS Trend Analysis ➞ | |
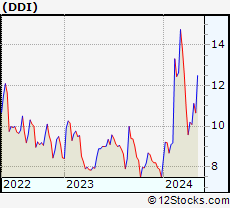 | DDI DoubleDown Interactive Co., Ltd. |
| Sector: Services & Goods | |
| SubSector: Electronic Gaming & Multimedia | |
| MarketCap: 482 Millions | |
| Recent Price: 10.76 Smart Investing & Trading Score: 80 | |
| Day Percent Change: 6.64% Day Change: 0.67 | |
| Week Change: 6.64% Year-to-date Change: 44.0% | |
| DDI Links: Profile News Message Board | |
| Charts:- Daily , Weekly | |
| Add DDI to Watchlist: View: Get Complete DDI Trend Analysis ➞ | |
 | KSS Kohl s Corporation |
| Sector: Services & Goods | |
| SubSector: Department Stores | |
| MarketCap: 3068 Millions | |
| Recent Price: 24.70 Smart Investing & Trading Score: 54 | |
| Day Percent Change: 6.51% Day Change: 1.51 | |
| Week Change: 6.51% Year-to-date Change: -13.9% | |
| KSS Links: Profile News Message Board | |
| Charts:- Daily , Weekly | |
| Add KSS to Watchlist: View: Get Complete KSS Trend Analysis ➞ | |
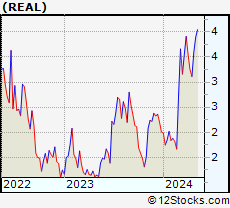 | REAL The RealReal, Inc. |
| Sector: Services & Goods | |
| SubSector: Specialty Retail, Other | |
| MarketCap: 839.344 Millions | |
| Recent Price: 3.31 Smart Investing & Trading Score: 70 | |
| Day Percent Change: 6.43% Day Change: 0.20 | |
| Week Change: 6.43% Year-to-date Change: 64.7% | |
| REAL Links: Profile News Message Board | |
| Charts:- Daily , Weekly | |
| Add REAL to Watchlist: View: Get Complete REAL Trend Analysis ➞ | |
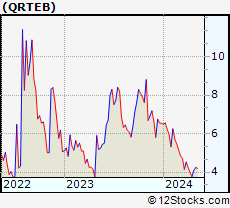 | QRTEB Qurate Retail, Inc. |
| Sector: Services & Goods | |
| SubSector: Specialty Retail, Other | |
| MarketCap: 124.244 Millions | |
| Recent Price: 3.99 Smart Investing & Trading Score: 27 | |
| Day Percent Change: 5.84% Day Change: 0.22 | |
| Week Change: 5.84% Year-to-date Change: -39.0% | |
| QRTEB Links: Profile News Message Board | |
| Charts:- Daily , Weekly | |
| Add QRTEB to Watchlist: View: Get Complete QRTEB Trend Analysis ➞ | |
 | JMIA Jumia Technologies AG |
| Sector: Services & Goods | |
| SubSector: Specialty Retail, Other | |
| MarketCap: 203.644 Millions | |
| Recent Price: 4.16 Smart Investing & Trading Score: 63 | |
| Day Percent Change: 5.58% Day Change: 0.22 | |
| Week Change: 5.58% Year-to-date Change: 17.9% | |
| JMIA Links: Profile News Message Board | |
| Charts:- Daily , Weekly | |
| Add JMIA to Watchlist: View: Get Complete JMIA Trend Analysis ➞ | |
 | BZUN Baozun Inc. |
| Sector: Services & Goods | |
| SubSector: Catalog & Mail Order Houses | |
| MarketCap: 1668.92 Millions | |
| Recent Price: 2.44 Smart Investing & Trading Score: 88 | |
| Day Percent Change: 5.17% Day Change: 0.12 | |
| Week Change: 5.17% Year-to-date Change: -11.0% | |
| BZUN Links: Profile News Message Board | |
| Charts:- Daily , Weekly | |
| Add BZUN to Watchlist: View: Get Complete BZUN Trend Analysis ➞ | |
 | YSG Yatsen Holding Limited |
| Sector: Services & Goods | |
| SubSector: Specialty Retail | |
| MarketCap: 11827 Millions | |
| Recent Price: 3.80 Smart Investing & Trading Score: 88 | |
| Day Percent Change: 5.12% Day Change: 0.18 | |
| Week Change: 5.12% Year-to-date Change: 419.4% | |
| YSG Links: Profile News Message Board | |
| Charts:- Daily , Weekly | |
| Add YSG to Watchlist: View: Get Complete YSG Trend Analysis ➞ | |
 | VMAR Vision Marine Technologies Inc. |
| Sector: Services & Goods | |
| SubSector: Leisure | |
| MarketCap: 99027 Millions | |
| Recent Price: 0.59 Smart Investing & Trading Score: 47 | |
| Day Percent Change: 5.09% Day Change: 0.03 | |
| Week Change: 5.09% Year-to-date Change: -45.9% | |
| VMAR Links: Profile News Message Board | |
| Charts:- Daily , Weekly | |
| Add VMAR to Watchlist: View: Get Complete VMAR Trend Analysis ➞ | |
 | SIG Signet Jewelers Limited |
| Sector: Services & Goods | |
| SubSector: Jewelry Stores | |
| MarketCap: 518.1 Millions | |
| Recent Price: 100.11 Smart Investing & Trading Score: 67 | |
| Day Percent Change: 4.86% Day Change: 4.64 | |
| Week Change: 4.86% Year-to-date Change: -6.7% | |
| SIG Links: Profile News Message Board | |
| Charts:- Daily , Weekly | |
| Add SIG to Watchlist: View: Get Complete SIG Trend Analysis ➞ | |
 | MYTE MYT Netherlands Parent B.V. |
| Sector: Services & Goods | |
| SubSector: Luxury Goods | |
| MarketCap: 330 Millions | |
| Recent Price: 4.01 Smart Investing & Trading Score: 100 | |
| Day Percent Change: 4.70% Day Change: 0.18 | |
| Week Change: 4.7% Year-to-date Change: 24.5% | |
| MYTE Links: Profile News Message Board | |
| Charts:- Daily , Weekly | |
| Add MYTE to Watchlist: View: Get Complete MYTE Trend Analysis ➞ | |
 | GHG GreenTree Hospitality Group Ltd. |
| Sector: Services & Goods | |
| SubSector: Lodging | |
| MarketCap: 1195.36 Millions | |
| Recent Price: 2.96 Smart Investing & Trading Score: 35 | |
| Day Percent Change: 4.62% Day Change: 0.13 | |
| Week Change: 4.62% Year-to-date Change: -21.1% | |
| GHG Links: Profile News Message Board | |
| Charts:- Daily , Weekly | |
| Add GHG to Watchlist: View: Get Complete GHG Trend Analysis ➞ | |
 | ZUMZ Zumiez Inc. |
| Sector: Services & Goods | |
| SubSector: Specialty Retail, Other | |
| MarketCap: 526.244 Millions | |
| Recent Price: 15.87 Smart Investing & Trading Score: 74 | |
| Day Percent Change: 4.61% Day Change: 0.70 | |
| Week Change: 4.61% Year-to-date Change: -22.0% | |
| ZUMZ Links: Profile News Message Board | |
| Charts:- Daily , Weekly | |
| Add ZUMZ to Watchlist: View: Get Complete ZUMZ Trend Analysis ➞ | |
 | TAL TAL Education Group |
| Sector: Services & Goods | |
| SubSector: Education & Training Services | |
| MarketCap: 30103.1 Millions | |
| Recent Price: 11.95 Smart Investing & Trading Score: 90 | |
| Day Percent Change: 4.55% Day Change: 0.52 | |
| Week Change: 4.55% Year-to-date Change: -5.4% | |
| TAL Links: Profile News Message Board | |
| Charts:- Daily , Weekly | |
| Add TAL to Watchlist: View: Get Complete TAL Trend Analysis ➞ | |
 | MOGU MOGU Inc. |
| Sector: Services & Goods | |
| SubSector: Specialty Retail, Other | |
| MarketCap: 168.844 Millions | |
| Recent Price: 2.08 Smart Investing & Trading Score: 100 | |
| Day Percent Change: 4.52% Day Change: 0.09 | |
| Week Change: 4.52% Year-to-date Change: 8.9% | |
| MOGU Links: Profile News Message Board | |
| Charts:- Daily , Weekly | |
| Add MOGU to Watchlist: View: Get Complete MOGU Trend Analysis ➞ | |
 | URBN Urban Outfitters, Inc. |
| Sector: Services & Goods | |
| SubSector: Apparel Stores | |
| MarketCap: 1638.08 Millions | |
| Recent Price: 38.56 Smart Investing & Trading Score: 58 | |
| Day Percent Change: 4.27% Day Change: 1.58 | |
| Week Change: 4.27% Year-to-date Change: 8.0% | |
| URBN Links: Profile News Message Board | |
| Charts:- Daily , Weekly | |
| Add URBN to Watchlist: View: Get Complete URBN Trend Analysis ➞ | |
 | ANF Abercrombie & Fitch Co. |
| Sector: Services & Goods | |
| SubSector: Apparel Stores | |
| MarketCap: 589.108 Millions | |
| Recent Price: 114.84 Smart Investing & Trading Score: 58 | |
| Day Percent Change: 4.06% Day Change: 4.48 | |
| Week Change: 4.06% Year-to-date Change: 30.2% | |
| ANF Links: Profile News Message Board | |
| Charts:- Daily , Weekly | |
| Add ANF to Watchlist: View: Get Complete ANF Trend Analysis ➞ | |
 | AMBP Ardagh Metal Packaging S.A. |
| Sector: Services & Goods | |
| SubSector: Packaging & Containers | |
| MarketCap: 2170 Millions | |
| Recent Price: 3.63 Smart Investing & Trading Score: 74 | |
| Day Percent Change: 4.01% Day Change: 0.14 | |
| Week Change: 4.01% Year-to-date Change: -5.1% | |
| AMBP Links: Profile News Message Board | |
| Charts:- Daily , Weekly | |
| Add AMBP to Watchlist: View: Get Complete AMBP Trend Analysis ➞ | |
 | YI 111, Inc. |
| Sector: Services & Goods | |
| SubSector: Drug Stores | |
| MarketCap: 520.351 Millions | |
| Recent Price: 1.06 Smart Investing & Trading Score: 42 | |
| Day Percent Change: 3.92% Day Change: 0.04 | |
| Week Change: 3.92% Year-to-date Change: -31.6% | |
| YI Links: Profile News Message Board | |
| Charts:- Daily , Weekly | |
| Add YI to Watchlist: View: Get Complete YI Trend Analysis ➞ | |
 | CSV Carriage Services, Inc. |
| Sector: Services & Goods | |
| SubSector: Personal Services | |
| MarketCap: 304.725 Millions | |
| Recent Price: 24.93 Smart Investing & Trading Score: 83 | |
| Day Percent Change: 3.88% Day Change: 0.93 | |
| Week Change: 3.88% Year-to-date Change: -0.3% | |
| CSV Links: Profile News Message Board | |
| Charts:- Daily , Weekly | |
| Add CSV to Watchlist: View: Get Complete CSV Trend Analysis ➞ | |
 | RRGB Red Robin Gourmet Burgers, Inc. |
| Sector: Services & Goods | |
| SubSector: Restaurants | |
| MarketCap: 121.57 Millions | |
| Recent Price: 6.64 Smart Investing & Trading Score: 64 | |
| Day Percent Change: 3.75% Day Change: 0.24 | |
| Week Change: 3.75% Year-to-date Change: -46.8% | |
| RRGB Links: Profile News Message Board | |
| Charts:- Daily , Weekly | |
| Add RRGB to Watchlist: View: Get Complete RRGB Trend Analysis ➞ | |
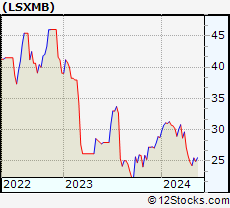 | LSXMB The Liberty SiriusXM Group |
| Sector: Services & Goods | |
| SubSector: Broadcasting - Radio | |
| MarketCap: 252.295 Millions | |
| Recent Price: 25.69 Smart Investing & Trading Score: 35 | |
| Day Percent Change: 3.67% Day Change: 0.91 | |
| Week Change: 3.67% Year-to-date Change: -10.7% | |
| LSXMB Links: Profile News Message Board | |
| Charts:- Daily , Weekly | |
| Add LSXMB to Watchlist: View: Get Complete LSXMB Trend Analysis ➞ | |
| For tabular summary view of above stock list: Summary View ➞ 0 - 25 , 25 - 50 , 50 - 75 , 75 - 100 , 100 - 125 , 125 - 150 , 150 - 175 , 175 - 200 , 200 - 225 , 225 - 250 , 250 - 275 , 275 - 300 , 300 - 325 , 325 - 350 , 350 - 375 , 375 - 400 , 400 - 425 , 425 - 450 , 450 - 475 | ||
| Click To Change The Sort Order: By Market Cap or Company Size Performance: Year-to-date, Week and Day | |
| Select Chart Type: | ||
|
Best Stocks Today 12Stocks.com |
© 2024 12Stocks.com Terms & Conditions Privacy Contact Us
All Information Provided Only For Education And Not To Be Used For Investing or Trading. See Terms & Conditions


One More Thing ... Get Best Stocks Delivered Daily!
Never Ever Miss A Move With Our Top Ten Stocks Lists
Find Best Stocks In Any Market - Bull or Bear Market
Take A Peek At Our Top Ten Stocks Lists: Daily, Weekly, Year-to-Date & Top Trends
Find Best Stocks In Any Market - Bull or Bear Market
Take A Peek At Our Top Ten Stocks Lists: Daily, Weekly, Year-to-Date & Top Trends
Consumer Services Stocks With Best Up Trends [0-bearish to 100-bullish]: MYT Netherlands[100], MOGU [100], Napco Security[100], Reservoir Media[100], Wendy s[100], WPP [100], ASGN [100], Grocery Outlet[100], Manpower [100], Genuine Parts[100], FTI Consulting[100]
Best Consumer Services Stocks Year-to-Date:
U Power[2612.05%], Vroom [1728.28%], Yatsen Holding[419.41%], Fluent [288.06%], Codere Online[134.59%], Research[96.15%], Sweetgreen [79.82%], RealReal [64.68%], Bright Scholar[61.6%], PaySign [52.86%], CRA [48.96%] Best Consumer Services Stocks This Week:
Pinduoduo [9.38%], Allbirds [9.07%], AMC Entertainment[8.23%], Noodles & [7.98%], DoubleDown Interactive[6.64%], Kohl s[6.51%], RealReal [6.43%], Qurate Retail[5.84%], Jumia Technologies[5.58%], Baozun [5.17%], Yatsen Holding[5.12%] Best Consumer Services Stocks Daily:
Pinduoduo [9.38%], Allbirds [9.07%], AMC Entertainment[8.23%], Noodles & [7.98%], DoubleDown Interactive[6.64%], Kohl s[6.51%], RealReal [6.43%], Qurate Retail[5.84%], Jumia Technologies[5.58%], Baozun [5.17%], Yatsen Holding[5.12%]