
 Login Sign Up


| |||||
 |  | ||||

| 12Stocks.com Market Intelligence |
Best Consumer Services Stocks
| In a hurry? Services & Goods Stocks: Performance Trends Table, Stock Charts
Sort Consumer Services: Daily, Weekly, Year-to-Date, Market Cap & Trends. Filter Services & Goods stocks list by size: All Large Mid-Range Small |
| 12Stocks.com Consumer Services Stocks Performances & Trends Daily | |||||||||
|
|  The overall Smart Investing & Trading Score is 58 (0-bearish to 100-bullish) which puts Consumer Services sector in short term neutral trend. The Smart Investing & Trading Score from previous trading session is 23 and an improvement of trend continues.
| ||||||||
Here are the Smart Investing & Trading Scores of the most requested Consumer Services stocks at 12Stocks.com (click stock name for detailed review):
|


| Consider signing up for our daily 12Stocks.com "Best Stocks Newsletter". You will never ever miss a big stock move again! |
| 12Stocks.com: Investing in Consumer Services sector with Stocks | |
|
The following table helps investors and traders sort through current performance and trends (as measured by Smart Investing & Trading Score) of various
stocks in the Consumer Services sector. Quick View: Move mouse or cursor over stock symbol (ticker) to view short-term Technical chart and over stock name to view long term chart. Click on  to add stock symbol to your watchlist and to add stock symbol to your watchlist and  to view watchlist. Click on any ticker or stock name for detailed market intelligence report for that stock. to view watchlist. Click on any ticker or stock name for detailed market intelligence report for that stock. |
12Stocks.com Performance of Stocks in Consumer Services Sector
| Ticker | Stock Name | Watchlist | Category | Recent Price | Smart Investing & Trading Score | Change % | Weekly Change% |
| VSCO | Victorias Secret |   | Apparel Retail | 17.39 | 42 | -1.02% | 0.58% |
| WMT | Walmart | | Retail | 59.87 | 56 | 1.32% | 0.57% |
| QS | QuantumScape | | Auto Parts | 5.48 | 40 | -1.97% | 0.55% |
| XPEV | XPeng | | Auto Manufacturers | 7.08 | 35 | -1.39% | 0.50% |
| OB | Outbrain | | Internet Content & Information | 4.11 | 75 | -0.72% | 0.49% |
| KRT | Karat Packaging | | Packaging | 26.96 | 44 | -0.85% | 0.48% |
| ABM | ABM Industries | | Services | 44.53 | 88 | -0.27% | 0.47% |
| VLGEA | Village Super | | Grocery | 27.67 | 48 | 1.24% | 0.44% |
| CTAS | Cintas | | Services | 664.13 | 44 | -0.33% | 0.43% |
| CCRN | Cross Country | | Staffing | 17.57 | 52 | -1.13% | 0.40% |
| DIBS | 1stdibs.Com | | Internet Retail | 5.34 | 63 | 0.85% | 0.38% |
| DLTR | Dollar Tree | | Retail | 122.39 | 25 | -0.14% | 0.30% |
| CRMT | America s | | Automobile | 58.41 | 42 | -0.53% | 0.29% |
| FUN | Cedar Fair | | Entertainment | 38.19 | 18 | -1.14% | 0.29% |
| ARCO | Arcos Dorados | | Restaurants | 10.93 | 45 | -1.97% | 0.28% |
| UTI | Universal Technical | | Education | 14.62 | 56 | 0.69% | 0.27% |
| LBRDK | Liberty Broadband | | Broadcasting | 50.01 | 35 | 0.00% | 0.26% |
| FAST | Fastenal | | Equipment | 67.74 | 38 | 0.34% | 0.25% |
| FC | Franklin Covey | | Education | 39.58 | 55 | -1.79% | 0.25% |
| PKOH | Park-Ohio | | Equipment | 23.96 | 10 | 0.21% | 0.25% |
| BH | Biglari | | Restaurants | 200.19 | 76 | -0.88% | 0.23% |
| HYZN | Hyzon Motors | | Auto Manufacturers | 0.60 | 22 | 2.06% | 0.18% |
| SPGI | S&P Global | | Services | 413.28 | 18 | 0.00% | 0.17% |
| ORLY | O Reilly | | Auto Parts | 1092.70 | 44 | 0.03% | 0.16% |
| ETSY | Etsy | | Retail | 66.87 | 56 | -2.17% | 0.16% |
| For chart view version of above stock list: Chart View ➞ 0 - 25 , 25 - 50 , 50 - 75 , 75 - 100 , 100 - 125 , 125 - 150 , 150 - 175 , 175 - 200 , 200 - 225 , 225 - 250 , 250 - 275 , 275 - 300 , 300 - 325 , 325 - 350 , 350 - 375 , 375 - 400 , 400 - 425 , 425 - 450 , 450 - 475 | ||
 | Click To Change The Sort Order: By Market Cap or Company Size Performance: Year-to-date, Week and Day |  |
|
Get the most comprehensive stock market coverage daily at 12Stocks.com ➞ Best Stocks Today ➞ Best Stocks Weekly ➞ Best Stocks Year-to-Date ➞ Best Stocks Trends ➞  Best Stocks Today 12Stocks.com Best Nasdaq Stocks ➞ Best S&P 500 Stocks ➞ Best Tech Stocks ➞ Best Biotech Stocks ➞ |
| Detailed Overview of Consumer Services Stocks |
| Consumer Services Technical Overview, Leaders & Laggards, Top Consumer Services ETF Funds & Detailed Consumer Services Stocks List, Charts, Trends & More |
| Consumer Services Sector: Technical Analysis, Trends & YTD Performance | |
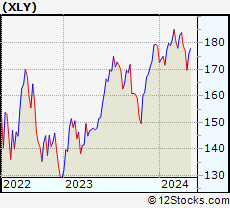
| Consumer Services sector is composed of stocks
from retail, entertainment, media/publishing, consumer goods
and services subsectors. Consumer Services sector, as represented by XLY, an exchange-traded fund [ETF] that holds basket of Consumer Services stocks (e.g, Walmart, Alibaba) is down by -2.58% and is currently underperforming the overall market by -8.24% year-to-date. Below is a quick view of Technical charts and trends: |
|
 XLY Weekly Chart |
|
| Long Term Trend: Good | |
| Medium Term Trend: Not Good | |
 XLY Daily Chart |
|
| Short Term Trend: Very Good | |
| Overall Trend Score: 58 | |
| YTD Performance: -2.58% | |
| **Trend Scores & Views Are Only For Educational Purposes And Not For Investing | |
| 12Stocks.com: Top Performing Consumer Services Sector Stocks | ||||||||||||||||||||||||||||||||||||||||||||||||
 The top performing Consumer Services sector stocks year to date are
Now, more recently, over last week, the top performing Consumer Services sector stocks on the move are


|
||||||||||||||||||||||||||||||||||||||||||||||||
| 12Stocks.com: Investing in Consumer Services Sector using Exchange Traded Funds | |
|
The following table shows list of key exchange traded funds (ETF) that
help investors track Consumer Services Index. For detailed view, check out our ETF Funds section of our website. Quick View: Move mouse or cursor over ETF symbol (ticker) to view short-term Technical chart and over ETF name to view long term chart. Click on ticker or stock name for detailed view. Click on to add stock symbol to your watchlist and to view watchlist. |
12Stocks.com List of ETFs that track Consumer Services Index
| Ticker | ETF Name | Watchlist | Recent Price | Smart Investing & Trading Score | Change % | Week % | Year-to-date % |
| XLY | Consumer Discret Sel | | 174.19 | 58 | 0.96 | 2.61 | -2.58% |
| RTH | Retail | | 199.79 | 44 | -0.35 | 0.58 | 6.14% |
| IYC | Consumer Services | | 77.83 | 43 | 0.31 | 2.05 | 2.72% |
| XRT | Retail | | 72.52 | 65 | -0.71 | 1.9 | 0.28% |
| IYK | Consumer Goods | | 67.20 | 75 | 0.99 | 2.11 | 5.16% |
| UCC | Consumer Services | | 33.37 | 73 | 2.12 | 5.68 | -7.07% |
| RETL | Retail Bull 3X | | 8.59 | 48 | -1.60 | 5.79 | -5.81% |
| RXI | Globl Consumer Discretionary | | 160.29 | 43 | 0.63 | 2 | 0.77% |
| SCC | Short Consumer Services | | 16.12 | 35 | -1.86 | -4.92 | 5.2% |
| UGE | Consumer Goods | | 17.24 | 90 | 1.23 | 3.68 | 9.52% |
| 12Stocks.com: Charts, Trends, Fundamental Data and Performances of Consumer Services Stocks | |
|
We now take in-depth look at all Consumer Services stocks including charts, multi-period performances and overall trends (as measured by Smart Investing & Trading Score). One can sort Consumer Services stocks (click link to choose) by Daily, Weekly and by Year-to-Date performances. Also, one can sort by size of the company or by market capitalization. |
| Select Your Default Chart Type: | |||||
| |||||
| Click on stock symbol or name for detailed view. Click on to add stock symbol to your watchlist and to view watchlist. Quick View: Move mouse or cursor over "Daily" to quickly view daily Technical stock chart and over "Weekly" to view weekly Technical stock chart. | |||||

 | VSCO Victorias Secret & Co. |
| Sector: Services & Goods | |
| SubSector: Apparel Retail | |
| MarketCap: 1340 Millions | |
| Recent Price: 17.39 Smart Investing & Trading Score: 42 | |
| Day Percent Change: -1.02% Day Change: -0.18 | |
| Week Change: 0.58% Year-to-date Change: -34.7% | |
| VSCO Links: Profile News Message Board | |
| Charts:- Daily , Weekly | |
| Add VSCO to Watchlist: View: Get Complete VSCO Trend Analysis ➞ | |
 | WMT Walmart Inc. |
| Sector: Services & Goods | |
| SubSector: Discount, Variety Stores | |
| MarketCap: 355610 Millions | |
| Recent Price: 59.87 Smart Investing & Trading Score: 56 | |
| Day Percent Change: 1.32% Day Change: 0.78 | |
| Week Change: 0.57% Year-to-date Change: 13.9% | |
| WMT Links: Profile News Message Board | |
| Charts:- Daily , Weekly | |
| Add WMT to Watchlist: View: Get Complete WMT Trend Analysis ➞ | |
 | QS QuantumScape Corporation |
| Sector: Services & Goods | |
| SubSector: Auto Parts | |
| MarketCap: 13137 Millions | |
| Recent Price: 5.48 Smart Investing & Trading Score: 40 | |
| Day Percent Change: -1.97% Day Change: -0.11 | |
| Week Change: 0.55% Year-to-date Change: -21.2% | |
| QS Links: Profile News Message Board | |
| Charts:- Daily , Weekly | |
| Add QS to Watchlist: View: Get Complete QS Trend Analysis ➞ | |
 | XPEV XPeng Inc. |
| Sector: Services & Goods | |
| SubSector: Auto Manufacturers | |
| MarketCap: 32917 Millions | |
| Recent Price: 7.08 Smart Investing & Trading Score: 35 | |
| Day Percent Change: -1.39% Day Change: -0.10 | |
| Week Change: 0.5% Year-to-date Change: -51.5% | |
| XPEV Links: Profile News Message Board | |
| Charts:- Daily , Weekly | |
| Add XPEV to Watchlist: View: Get Complete XPEV Trend Analysis ➞ | |
 | OB Outbrain Inc. |
| Sector: Services & Goods | |
| SubSector: Internet Content & Information | |
| MarketCap: 250 Millions | |
| Recent Price: 4.11 Smart Investing & Trading Score: 75 | |
| Day Percent Change: -0.72% Day Change: -0.03 | |
| Week Change: 0.49% Year-to-date Change: -6.2% | |
| OB Links: Profile News Message Board | |
| Charts:- Daily , Weekly | |
| Add OB to Watchlist: View: Get Complete OB Trend Analysis ➞ | |
 | KRT Karat Packaging Inc. |
| Sector: Services & Goods | |
| SubSector: Packaging & Containers | |
| MarketCap: 357 Millions | |
| Recent Price: 26.96 Smart Investing & Trading Score: 44 | |
| Day Percent Change: -0.85% Day Change: -0.23 | |
| Week Change: 0.48% Year-to-date Change: 8.2% | |
| KRT Links: Profile News Message Board | |
| Charts:- Daily , Weekly | |
| Add KRT to Watchlist: View: Get Complete KRT Trend Analysis ➞ | |
 | ABM ABM Industries Incorporated |
| Sector: Services & Goods | |
| SubSector: Business Services | |
| MarketCap: 1706.72 Millions | |
| Recent Price: 44.53 Smart Investing & Trading Score: 88 | |
| Day Percent Change: -0.27% Day Change: -0.12 | |
| Week Change: 0.47% Year-to-date Change: -0.7% | |
| ABM Links: Profile News Message Board | |
| Charts:- Daily , Weekly | |
| Add ABM to Watchlist: View: Get Complete ABM Trend Analysis ➞ | |
 | VLGEA Village Super Market, Inc. |
| Sector: Services & Goods | |
| SubSector: Grocery Stores | |
| MarketCap: 222.375 Millions | |
| Recent Price: 27.67 Smart Investing & Trading Score: 48 | |
| Day Percent Change: 1.24% Day Change: 0.34 | |
| Week Change: 0.44% Year-to-date Change: 5.5% | |
| VLGEA Links: Profile News Message Board | |
| Charts:- Daily , Weekly | |
| Add VLGEA to Watchlist: View: Get Complete VLGEA Trend Analysis ➞ | |
 | CTAS Cintas Corporation |
| Sector: Services & Goods | |
| SubSector: Business Services | |
| MarketCap: 20154.6 Millions | |
| Recent Price: 664.13 Smart Investing & Trading Score: 44 | |
| Day Percent Change: -0.33% Day Change: -2.20 | |
| Week Change: 0.43% Year-to-date Change: 10.2% | |
| CTAS Links: Profile News Message Board | |
| Charts:- Daily , Weekly | |
| Add CTAS to Watchlist: View: Get Complete CTAS Trend Analysis ➞ | |
 | CCRN Cross Country Healthcare, Inc. |
| Sector: Services & Goods | |
| SubSector: Staffing & Outsourcing Services | |
| MarketCap: 348.328 Millions | |
| Recent Price: 17.57 Smart Investing & Trading Score: 52 | |
| Day Percent Change: -1.13% Day Change: -0.20 | |
| Week Change: 0.4% Year-to-date Change: -22.4% | |
| CCRN Links: Profile News Message Board | |
| Charts:- Daily , Weekly | |
| Add CCRN to Watchlist: View: Get Complete CCRN Trend Analysis ➞ | |
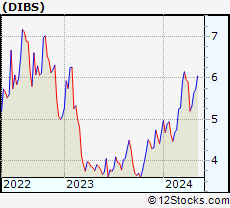 | DIBS 1stdibs.Com, Inc. |
| Sector: Services & Goods | |
| SubSector: Internet Retail | |
| MarketCap: 149 Millions | |
| Recent Price: 5.34 Smart Investing & Trading Score: 63 | |
| Day Percent Change: 0.85% Day Change: 0.04 | |
| Week Change: 0.38% Year-to-date Change: 13.9% | |
| DIBS Links: Profile News Message Board | |
| Charts:- Daily , Weekly | |
| Add DIBS to Watchlist: View: Get Complete DIBS Trend Analysis ➞ | |
 | DLTR Dollar Tree, Inc. |
| Sector: Services & Goods | |
| SubSector: Discount, Variety Stores | |
| MarketCap: 21383.2 Millions | |
| Recent Price: 122.39 Smart Investing & Trading Score: 25 | |
| Day Percent Change: -0.14% Day Change: -0.17 | |
| Week Change: 0.3% Year-to-date Change: -13.8% | |
| DLTR Links: Profile News Message Board | |
| Charts:- Daily , Weekly | |
| Add DLTR to Watchlist: View: Get Complete DLTR Trend Analysis ➞ | |
 | CRMT America s Car-Mart, Inc. |
| Sector: Services & Goods | |
| SubSector: Auto Dealerships | |
| MarketCap: 329.921 Millions | |
| Recent Price: 58.41 Smart Investing & Trading Score: 42 | |
| Day Percent Change: -0.53% Day Change: -0.31 | |
| Week Change: 0.29% Year-to-date Change: -22.9% | |
| CRMT Links: Profile News Message Board | |
| Charts:- Daily , Weekly | |
| Add CRMT to Watchlist: View: Get Complete CRMT Trend Analysis ➞ | |
 | FUN Cedar Fair, L.P. |
| Sector: Services & Goods | |
| SubSector: General Entertainment | |
| MarketCap: 1440.49 Millions | |
| Recent Price: 38.19 Smart Investing & Trading Score: 18 | |
| Day Percent Change: -1.14% Day Change: -0.44 | |
| Week Change: 0.29% Year-to-date Change: -4.1% | |
| FUN Links: Profile News Message Board | |
| Charts:- Daily , Weekly | |
| Add FUN to Watchlist: View: Get Complete FUN Trend Analysis ➞ | |
 | ARCO Arcos Dorados Holdings Inc. |
| Sector: Services & Goods | |
| SubSector: Restaurants | |
| MarketCap: 778.87 Millions | |
| Recent Price: 10.93 Smart Investing & Trading Score: 45 | |
| Day Percent Change: -1.97% Day Change: -0.22 | |
| Week Change: 0.28% Year-to-date Change: -13.9% | |
| ARCO Links: Profile News Message Board | |
| Charts:- Daily , Weekly | |
| Add ARCO to Watchlist: View: Get Complete ARCO Trend Analysis ➞ | |
 | UTI Universal Technical Institute, Inc. |
| Sector: Services & Goods | |
| SubSector: Education & Training Services | |
| MarketCap: 163.506 Millions | |
| Recent Price: 14.62 Smart Investing & Trading Score: 56 | |
| Day Percent Change: 0.69% Day Change: 0.10 | |
| Week Change: 0.27% Year-to-date Change: 16.8% | |
| UTI Links: Profile News Message Board | |
| Charts:- Daily , Weekly | |
| Add UTI to Watchlist: View: Get Complete UTI Trend Analysis ➞ | |
 | LBRDK Liberty Broadband Corporation |
| Sector: Services & Goods | |
| SubSector: Broadcasting - TV | |
| MarketCap: 13847.3 Millions | |
| Recent Price: 50.01 Smart Investing & Trading Score: 35 | |
| Day Percent Change: 0.00% Day Change: 0.00 | |
| Week Change: 0.26% Year-to-date Change: -38.0% | |
| LBRDK Links: Profile News Message Board | |
| Charts:- Daily , Weekly | |
| Add LBRDK to Watchlist: View: Get Complete LBRDK Trend Analysis ➞ | |
 | FAST Fastenal Company |
| Sector: Services & Goods | |
| SubSector: Industrial Equipment Wholesale | |
| MarketCap: 17609.9 Millions | |
| Recent Price: 67.74 Smart Investing & Trading Score: 38 | |
| Day Percent Change: 0.34% Day Change: 0.23 | |
| Week Change: 0.25% Year-to-date Change: 4.6% | |
| FAST Links: Profile News Message Board | |
| Charts:- Daily , Weekly | |
| Add FAST to Watchlist: View: Get Complete FAST Trend Analysis ➞ | |
 | FC Franklin Covey Co. |
| Sector: Services & Goods | |
| SubSector: Education & Training Services | |
| MarketCap: 243.306 Millions | |
| Recent Price: 39.58 Smart Investing & Trading Score: 55 | |
| Day Percent Change: -1.79% Day Change: -0.72 | |
| Week Change: 0.25% Year-to-date Change: -9.1% | |
| FC Links: Profile News Message Board | |
| Charts:- Daily , Weekly | |
| Add FC to Watchlist: View: Get Complete FC Trend Analysis ➞ | |
 | PKOH Park-Ohio Holdings Corp. |
| Sector: Services & Goods | |
| SubSector: Industrial Equipment Wholesale | |
| MarketCap: 214.358 Millions | |
| Recent Price: 23.96 Smart Investing & Trading Score: 10 | |
| Day Percent Change: 0.21% Day Change: 0.05 | |
| Week Change: 0.25% Year-to-date Change: -11.1% | |
| PKOH Links: Profile News Message Board | |
| Charts:- Daily , Weekly | |
| Add PKOH to Watchlist: View: Get Complete PKOH Trend Analysis ➞ | |
 | BH Biglari Holdings Inc. |
| Sector: Services & Goods | |
| SubSector: Restaurants | |
| MarketCap: 149.07 Millions | |
| Recent Price: 200.19 Smart Investing & Trading Score: 76 | |
| Day Percent Change: -0.88% Day Change: -1.77 | |
| Week Change: 0.23% Year-to-date Change: 21.4% | |
| BH Links: Profile News Message Board | |
| Charts:- Daily , Weekly | |
| Add BH to Watchlist: View: Get Complete BH Trend Analysis ➞ | |
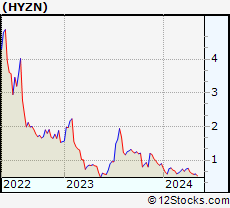 | HYZN Hyzon Motors Inc. |
| Sector: Services & Goods | |
| SubSector: Auto Manufacturers | |
| MarketCap: 223 Millions | |
| Recent Price: 0.60 Smart Investing & Trading Score: 22 | |
| Day Percent Change: 2.06% Day Change: 0.01 | |
| Week Change: 0.18% Year-to-date Change: -32.8% | |
| HYZN Links: Profile News Message Board | |
| Charts:- Daily , Weekly | |
| Add HYZN to Watchlist: View: Get Complete HYZN Trend Analysis ➞ | |
 | SPGI S&P Global Inc. |
| Sector: Services & Goods | |
| SubSector: Business Services | |
| MarketCap: 55247.9 Millions | |
| Recent Price: 413.28 Smart Investing & Trading Score: 18 | |
| Day Percent Change: 0.00% Day Change: 0.02 | |
| Week Change: 0.17% Year-to-date Change: -6.2% | |
| SPGI Links: Profile News Message Board | |
| Charts:- Daily , Weekly | |
| Add SPGI to Watchlist: View: Get Complete SPGI Trend Analysis ➞ | |
 | ORLY O Reilly Automotive, Inc. |
| Sector: Services & Goods | |
| SubSector: Auto Parts Stores | |
| MarketCap: 22391.5 Millions | |
| Recent Price: 1092.70 Smart Investing & Trading Score: 44 | |
| Day Percent Change: 0.03% Day Change: 0.35 | |
| Week Change: 0.16% Year-to-date Change: 15.0% | |
| ORLY Links: Profile News Message Board | |
| Charts:- Daily , Weekly | |
| Add ORLY to Watchlist: View: Get Complete ORLY Trend Analysis ➞ | |
 | ETSY Etsy, Inc. |
| Sector: Services & Goods | |
| SubSector: Specialty Retail, Other | |
| MarketCap: 4263.24 Millions | |
| Recent Price: 66.87 Smart Investing & Trading Score: 56 | |
| Day Percent Change: -2.17% Day Change: -1.48 | |
| Week Change: 0.16% Year-to-date Change: -17.5% | |
| ETSY Links: Profile News Message Board | |
| Charts:- Daily , Weekly | |
| Add ETSY to Watchlist: View: Get Complete ETSY Trend Analysis ➞ | |
| For tabular summary view of above stock list: Summary View ➞ 0 - 25 , 25 - 50 , 50 - 75 , 75 - 100 , 100 - 125 , 125 - 150 , 150 - 175 , 175 - 200 , 200 - 225 , 225 - 250 , 250 - 275 , 275 - 300 , 300 - 325 , 325 - 350 , 350 - 375 , 375 - 400 , 400 - 425 , 425 - 450 , 450 - 475 | ||
| Click To Change The Sort Order: By Market Cap or Company Size Performance: Year-to-date, Week and Day | |
| Select Chart Type: | ||
|
Best Stocks Today 12Stocks.com |
© 2024 12Stocks.com Terms & Conditions Privacy Contact Us
All Information Provided Only For Education And Not To Be Used For Investing or Trading. See Terms & Conditions


One More Thing ... Get Best Stocks Delivered Daily!
Never Ever Miss A Move With Our Top Ten Stocks Lists
Find Best Stocks In Any Market - Bull or Bear Market
Take A Peek At Our Top Ten Stocks Lists: Daily, Weekly, Year-to-Date & Top Trends
Find Best Stocks In Any Market - Bull or Bear Market
Take A Peek At Our Top Ten Stocks Lists: Daily, Weekly, Year-to-Date & Top Trends
Consumer Services Stocks With Best Up Trends [0-bearish to 100-bullish]: Yatsen Holding[100], 1[100], Alibaba [100], MINISO [100], Omnicom [100], Avnet [100], Napco Security[100], ASGN [100], IMAX [100], Yum! Brands[100], Dillard s[100]
Best Consumer Services Stocks Year-to-Date:
U Power[3013.84%], Vroom [1807.84%], Yatsen Holding[479.55%], Fluent [301.49%], Codere Online[134.25%], Research[107.01%], Sweetgreen [92.21%], RealReal [71.64%], PaySign [60.71%], DXP Enterprises[54.04%], Bright Scholar[52%] Best Consumer Services Stocks This Week:
Chicken Soup[282.5%], Hibbett Sports[21.61%], Golden Heaven[20.85%], Yatsen Holding[17.29%], Baozun [14.66%], Jumia Technologies[14.21%], Zumiez [13.38%], Ameresco [13.24%], 1[12.87%], Pinduoduo [12.39%], K12 [11.85%] Best Consumer Services Stocks Daily:
Chicken Soup[264.29%], Golden Heaven[11.81%], K12 [8.64%], Yatsen Holding[7.89%], GameStop [7.58%], Dada Nexus[7.53%], iClick Interactive[7.35%], U Power[7.31%], 1[7.23%], Watsco [6.54%], Allego N.V[6.31%]