
 Login Sign Up


| |||||
 |  | ||||

| 12Stocks.com Market Intelligence |
Best Consumer Services Stocks
| In a hurry? Services & Goods Stocks: Performance Trends Table, Stock Charts
Sort Consumer Services: Daily, Weekly, Year-to-Date, Market Cap & Trends. Filter Services & Goods stocks list by size: All Large Mid-Range Small |
| 12Stocks.com Consumer Services Stocks Performances & Trends Daily | |||||||||
|
|  The overall Smart Investing & Trading Score is 13 (0-bearish to 100-bullish) which puts Consumer Services sector in short term bearish trend. The Smart Investing & Trading Score from previous trading session is 26 and a deterioration of trend continues.
| ||||||||
Here are the Smart Investing & Trading Scores of the most requested Consumer Services stocks at 12Stocks.com (click stock name for detailed review):
|


| Consider signing up for our daily 12Stocks.com "Best Stocks Newsletter". You will never ever miss a big stock move again! |
| 12Stocks.com: Investing in Consumer Services sector with Stocks | |
|
The following table helps investors and traders sort through current performance and trends (as measured by Smart Investing & Trading Score) of various
stocks in the Consumer Services sector. Quick View: Move mouse or cursor over stock symbol (ticker) to view short-term Technical chart and over stock name to view long term chart. Click on  to add stock symbol to your watchlist and to add stock symbol to your watchlist and  to view watchlist. Click on any ticker or stock name for detailed market intelligence report for that stock. to view watchlist. Click on any ticker or stock name for detailed market intelligence report for that stock. |
12Stocks.com Performance of Stocks in Consumer Services Sector
| Ticker | Stock Name | Watchlist | Category | Recent Price | Smart Investing & Trading Score | Change % | Weekly Change% |
| FVRR | Fiverr |   | Services | 19.63 | 22 | -0.96% | -2.14% |
| LAUR | Laureate Education | | Education | 14.04 | 51 | -0.14% | -2.16% |
| GDEV | GDEV | | Electronic Gaming & Multimedia | 2.26 | 30 | -0.44% | -2.16% |
| LTH | Life Time | | Leisure | 14.01 | 53 | -0.46% | -2.16% |
| HD | Home Depot | | Retail | 335.36 | 18 | 0.74% | -2.19% |
| ACVA | ACV Auctions | | Auto & Truck Dealerships | 17.31 | 44 | -3.89% | -2.20% |
| WEX | WEX | | Services | 230.48 | 46 | 0.25% | -2.29% |
| GWW | W.W. Grainger | | Equipment | 942.65 | 36 | 0.55% | -2.31% |
| TAL | TAL Education | | Education | 11.43 | 73 | -1.89% | -2.31% |
| COOK | Traeger | | Furnishings, Fixtures & Appliances | 2.11 | 15 | 0.96% | -2.31% |
| SIX | Six Flags | | Entertainment | 23.45 | 10 | -0.55% | -2.33% |
| ICFI | ICF | | Services | 140.27 | 51 | 1.58% | -2.35% |
| BBY | Best Buy | | Retail | 76.15 | 58 | 0.20% | -2.37% |
| ETSY | Etsy | | Retail | 66.76 | 47 | -0.86% | -2.41% |
| DLTR | Dollar Tree | | Retail | 122.03 | 10 | -0.16% | -2.52% |
| UTI | Universal Technical | | Education | 14.58 | 56 | 2.46% | -2.54% |
| SP | SP Plus | | Services | 50.68 | 0 | -1.03% | -2.54% |
| RHI | Robert Half | | Staffing | 70.23 | 18 | 0.96% | -2.55% |
| DRVN | Driven Brands | | Auto & Truck Dealerships | 14.11 | 36 | -4.31% | -2.56% |
| SAH | Sonic Automotive | | Automobile | 48.62 | 10 | 1.17% | -2.57% |
| CDNA | CareDx | | Research | 8.31 | 30 | 2.97% | -2.58% |
| MSA | MSA Safety | | Security | 185.38 | 36 | -0.09% | -2.59% |
| BATRA | Liberty Braves | | Broadcasting | 40.29 | 18 | 0.40% | -2.61% |
| ADT | ADT | | Security | 6.19 | 25 | 0.16% | -2.67% |
| BYD | Boyd Gaming | | Casinos | 62.66 | 0 | -0.43% | -2.70% |
| For chart view version of above stock list: Chart View ➞ 0 - 25 , 25 - 50 , 50 - 75 , 75 - 100 , 100 - 125 , 125 - 150 , 150 - 175 , 175 - 200 , 200 - 225 , 225 - 250 , 250 - 275 , 275 - 300 , 300 - 325 , 325 - 350 , 350 - 375 , 375 - 400 , 400 - 425 , 425 - 450 , 450 - 475 | ||
 | Click To Change The Sort Order: By Market Cap or Company Size Performance: Year-to-date, Week and Day |  |
|
Get the most comprehensive stock market coverage daily at 12Stocks.com ➞ Best Stocks Today ➞ Best Stocks Weekly ➞ Best Stocks Year-to-Date ➞ Best Stocks Trends ➞  Best Stocks Today 12Stocks.com Best Nasdaq Stocks ➞ Best S&P 500 Stocks ➞ Best Tech Stocks ➞ Best Biotech Stocks ➞ |
| Detailed Overview of Consumer Services Stocks |
| Consumer Services Technical Overview, Leaders & Laggards, Top Consumer Services ETF Funds & Detailed Consumer Services Stocks List, Charts, Trends & More |
| Consumer Services Sector: Technical Analysis, Trends & YTD Performance | |
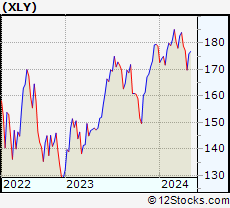
| Consumer Services sector is composed of stocks
from retail, entertainment, media/publishing, consumer goods
and services subsectors. Consumer Services sector, as represented by XLY, an exchange-traded fund [ETF] that holds basket of Consumer Services stocks (e.g, Walmart, Alibaba) is down by -5.06% and is currently underperforming the overall market by -8.44% year-to-date. Below is a quick view of Technical charts and trends: |
|
 XLY Weekly Chart |
|
| Long Term Trend: Not Good | |
| Medium Term Trend: Not Good | |
 XLY Daily Chart |
|
| Short Term Trend: Not Good | |
| Overall Trend Score: 13 | |
| YTD Performance: -5.06% | |
| **Trend Scores & Views Are Only For Educational Purposes And Not For Investing | |
| 12Stocks.com: Top Performing Consumer Services Sector Stocks | ||||||||||||||||||||||||||||||||||||||||||||||||
 The top performing Consumer Services sector stocks year to date are
Now, more recently, over last week, the top performing Consumer Services sector stocks on the move are


|
||||||||||||||||||||||||||||||||||||||||||||||||
| 12Stocks.com: Investing in Consumer Services Sector using Exchange Traded Funds | |
|
The following table shows list of key exchange traded funds (ETF) that
help investors track Consumer Services Index. For detailed view, check out our ETF Funds section of our website. Quick View: Move mouse or cursor over ETF symbol (ticker) to view short-term Technical chart and over ETF name to view long term chart. Click on ticker or stock name for detailed view. Click on to add stock symbol to your watchlist and to view watchlist. |
12Stocks.com List of ETFs that track Consumer Services Index
| Ticker | ETF Name | Watchlist | Recent Price | Smart Investing & Trading Score | Change % | Week % | Year-to-date % |
| XLY | Consumer Discret Sel | | 169.76 | 13 | -0.88 | -4.15 | -5.06% |
| RTH | Retail | | 198.63 | 44 | 0.00 | -1.52 | 5.53% |
| IYC | Consumer Services | | 76.27 | 26 | -1.03 | -3.69 | 0.66% |
| XRT | Retail | | 71.17 | 51 | 0.68 | -0.99 | -1.59% |
| IYK | Consumer Goods | | 65.81 | 75 | 1.29 | 2.57 | 2.98% |
| UCC | Consumer Services | | 31.58 | 20 | -3.26 | -8.28 | -12.06% |
| RETL | Retail Bull 3X | | 8.12 | 49 | 2.14 | -3.45 | -10.96% |
| RXI | Globl Consumer Discretionary | | 157.15 | 44 | -0.19 | -2.26 | -1.2% |
| SCC | Short Consumer Services | | 16.95 | 100 | 2.13 | 8.91 | 10.64% |
| UGE | Consumer Goods | | 16.63 | 73 | 2.26 | 2.71 | 5.63% |
| 12Stocks.com: Charts, Trends, Fundamental Data and Performances of Consumer Services Stocks | |
|
We now take in-depth look at all Consumer Services stocks including charts, multi-period performances and overall trends (as measured by Smart Investing & Trading Score). One can sort Consumer Services stocks (click link to choose) by Daily, Weekly and by Year-to-Date performances. Also, one can sort by size of the company or by market capitalization. |
| Select Your Default Chart Type: | |||||
| |||||
| Click on stock symbol or name for detailed view. Click on to add stock symbol to your watchlist and to view watchlist. Quick View: Move mouse or cursor over "Daily" to quickly view daily Technical stock chart and over "Weekly" to view weekly Technical stock chart. | |||||

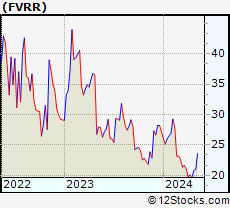 | FVRR Fiverr International Ltd. |
| Sector: Services & Goods | |
| SubSector: Business Services | |
| MarketCap: 766.582 Millions | |
| Recent Price: 19.63 Smart Investing & Trading Score: 22 | |
| Day Percent Change: -0.96% Day Change: -0.19 | |
| Week Change: -2.14% Year-to-date Change: -27.9% | |
| FVRR Links: Profile News Message Board | |
| Charts:- Daily , Weekly | |
| Add FVRR to Watchlist: View: Get Complete FVRR Trend Analysis ➞ | |
 | LAUR Laureate Education, Inc. |
| Sector: Services & Goods | |
| SubSector: Education & Training Services | |
| MarketCap: 2258.56 Millions | |
| Recent Price: 14.04 Smart Investing & Trading Score: 51 | |
| Day Percent Change: -0.14% Day Change: -0.02 | |
| Week Change: -2.16% Year-to-date Change: 2.4% | |
| LAUR Links: Profile News Message Board | |
| Charts:- Daily , Weekly | |
| Add LAUR to Watchlist: View: Get Complete LAUR Trend Analysis ➞ | |
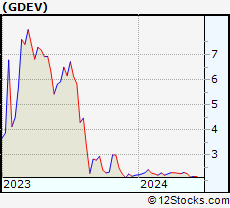 | GDEV GDEV Inc. |
| Sector: Services & Goods | |
| SubSector: Electronic Gaming & Multimedia | |
| MarketCap: 1300 Millions | |
| Recent Price: 2.26 Smart Investing & Trading Score: 30 | |
| Day Percent Change: -0.44% Day Change: -0.01 | |
| Week Change: -2.16% Year-to-date Change: 2.7% | |
| GDEV Links: Profile News Message Board | |
| Charts:- Daily , Weekly | |
| Add GDEV to Watchlist: View: Get Complete GDEV Trend Analysis ➞ | |
 | LTH Life Time Group Holdings, Inc. |
| Sector: Services & Goods | |
| SubSector: Leisure | |
| MarketCap: 3740 Millions | |
| Recent Price: 14.01 Smart Investing & Trading Score: 53 | |
| Day Percent Change: -0.46% Day Change: -0.06 | |
| Week Change: -2.16% Year-to-date Change: -7.5% | |
| LTH Links: Profile News Message Board | |
| Charts:- Daily , Weekly | |
| Add LTH to Watchlist: View: Get Complete LTH Trend Analysis ➞ | |
 | HD The Home Depot, Inc. |
| Sector: Services & Goods | |
| SubSector: Home Improvement Stores | |
| MarketCap: 185389 Millions | |
| Recent Price: 335.36 Smart Investing & Trading Score: 18 | |
| Day Percent Change: 0.74% Day Change: 2.47 | |
| Week Change: -2.19% Year-to-date Change: -3.2% | |
| HD Links: Profile News Message Board | |
| Charts:- Daily , Weekly | |
| Add HD to Watchlist: View: Get Complete HD Trend Analysis ➞ | |
 | ACVA ACV Auctions Inc. |
| Sector: Services & Goods | |
| SubSector: Auto & Truck Dealerships | |
| MarketCap: 2680 Millions | |
| Recent Price: 17.31 Smart Investing & Trading Score: 44 | |
| Day Percent Change: -3.89% Day Change: -0.70 | |
| Week Change: -2.2% Year-to-date Change: 14.9% | |
| ACVA Links: Profile News Message Board | |
| Charts:- Daily , Weekly | |
| Add ACVA to Watchlist: View: Get Complete ACVA Trend Analysis ➞ | |
 | WEX WEX Inc. |
| Sector: Services & Goods | |
| SubSector: Business Services | |
| MarketCap: 4312.22 Millions | |
| Recent Price: 230.48 Smart Investing & Trading Score: 46 | |
| Day Percent Change: 0.25% Day Change: 0.58 | |
| Week Change: -2.29% Year-to-date Change: 18.5% | |
| WEX Links: Profile News Message Board | |
| Charts:- Daily , Weekly | |
| Add WEX to Watchlist: View: Get Complete WEX Trend Analysis ➞ | |
 | GWW W.W. Grainger, Inc. |
| Sector: Services & Goods | |
| SubSector: Industrial Equipment Wholesale | |
| MarketCap: 12794.8 Millions | |
| Recent Price: 942.65 Smart Investing & Trading Score: 36 | |
| Day Percent Change: 0.55% Day Change: 5.11 | |
| Week Change: -2.31% Year-to-date Change: 13.8% | |
| GWW Links: Profile News Message Board | |
| Charts:- Daily , Weekly | |
| Add GWW to Watchlist: View: Get Complete GWW Trend Analysis ➞ | |
 | TAL TAL Education Group |
| Sector: Services & Goods | |
| SubSector: Education & Training Services | |
| MarketCap: 30103.1 Millions | |
| Recent Price: 11.43 Smart Investing & Trading Score: 73 | |
| Day Percent Change: -1.89% Day Change: -0.22 | |
| Week Change: -2.31% Year-to-date Change: -9.5% | |
| TAL Links: Profile News Message Board | |
| Charts:- Daily , Weekly | |
| Add TAL to Watchlist: View: Get Complete TAL Trend Analysis ➞ | |
 | COOK Traeger, Inc. |
| Sector: Services & Goods | |
| SubSector: Furnishings, Fixtures & Appliances | |
| MarketCap: 524 Millions | |
| Recent Price: 2.11 Smart Investing & Trading Score: 15 | |
| Day Percent Change: 0.96% Day Change: 0.02 | |
| Week Change: -2.31% Year-to-date Change: -25.3% | |
| COOK Links: Profile News Message Board | |
| Charts:- Daily , Weekly | |
| Add COOK to Watchlist: View: Get Complete COOK Trend Analysis ➞ | |
 | SIX Six Flags Entertainment Corporation |
| Sector: Services & Goods | |
| SubSector: General Entertainment | |
| MarketCap: 1282.69 Millions | |
| Recent Price: 23.45 Smart Investing & Trading Score: 10 | |
| Day Percent Change: -0.55% Day Change: -0.13 | |
| Week Change: -2.33% Year-to-date Change: -6.5% | |
| SIX Links: Profile News Message Board | |
| Charts:- Daily , Weekly | |
| Add SIX to Watchlist: View: Get Complete SIX Trend Analysis ➞ | |
 | ICFI ICF International, Inc. |
| Sector: Services & Goods | |
| SubSector: Management Services | |
| MarketCap: 1218.75 Millions | |
| Recent Price: 140.27 Smart Investing & Trading Score: 51 | |
| Day Percent Change: 1.58% Day Change: 2.18 | |
| Week Change: -2.35% Year-to-date Change: 4.6% | |
| ICFI Links: Profile News Message Board | |
| Charts:- Daily , Weekly | |
| Add ICFI to Watchlist: View: Get Complete ICFI Trend Analysis ➞ | |
 | BBY Best Buy Co., Inc. |
| Sector: Services & Goods | |
| SubSector: Electronics Stores | |
| MarketCap: 15771.3 Millions | |
| Recent Price: 76.15 Smart Investing & Trading Score: 58 | |
| Day Percent Change: 0.20% Day Change: 0.15 | |
| Week Change: -2.37% Year-to-date Change: -2.7% | |
| BBY Links: Profile News Message Board | |
| Charts:- Daily , Weekly | |
| Add BBY to Watchlist: View: Get Complete BBY Trend Analysis ➞ | |
 | ETSY Etsy, Inc. |
| Sector: Services & Goods | |
| SubSector: Specialty Retail, Other | |
| MarketCap: 4263.24 Millions | |
| Recent Price: 66.76 Smart Investing & Trading Score: 47 | |
| Day Percent Change: -0.86% Day Change: -0.58 | |
| Week Change: -2.41% Year-to-date Change: -17.6% | |
| ETSY Links: Profile News Message Board | |
| Charts:- Daily , Weekly | |
| Add ETSY to Watchlist: View: Get Complete ETSY Trend Analysis ➞ | |
 | DLTR Dollar Tree, Inc. |
| Sector: Services & Goods | |
| SubSector: Discount, Variety Stores | |
| MarketCap: 21383.2 Millions | |
| Recent Price: 122.03 Smart Investing & Trading Score: 10 | |
| Day Percent Change: -0.16% Day Change: -0.20 | |
| Week Change: -2.52% Year-to-date Change: -14.1% | |
| DLTR Links: Profile News Message Board | |
| Charts:- Daily , Weekly | |
| Add DLTR to Watchlist: View: Get Complete DLTR Trend Analysis ➞ | |
 | UTI Universal Technical Institute, Inc. |
| Sector: Services & Goods | |
| SubSector: Education & Training Services | |
| MarketCap: 163.506 Millions | |
| Recent Price: 14.58 Smart Investing & Trading Score: 56 | |
| Day Percent Change: 2.46% Day Change: 0.35 | |
| Week Change: -2.54% Year-to-date Change: 16.5% | |
| UTI Links: Profile News Message Board | |
| Charts:- Daily , Weekly | |
| Add UTI to Watchlist: View: Get Complete UTI Trend Analysis ➞ | |
 | SP SP Plus Corporation |
| Sector: Services & Goods | |
| SubSector: Management Services | |
| MarketCap: 494.545 Millions | |
| Recent Price: 50.68 Smart Investing & Trading Score: 0 | |
| Day Percent Change: -1.03% Day Change: -0.53 | |
| Week Change: -2.54% Year-to-date Change: -1.1% | |
| SP Links: Profile News Message Board | |
| Charts:- Daily , Weekly | |
| Add SP to Watchlist: View: Get Complete SP Trend Analysis ➞ | |
 | RHI Robert Half International Inc. |
| Sector: Services & Goods | |
| SubSector: Staffing & Outsourcing Services | |
| MarketCap: 4302 Millions | |
| Recent Price: 70.23 Smart Investing & Trading Score: 18 | |
| Day Percent Change: 0.96% Day Change: 0.67 | |
| Week Change: -2.55% Year-to-date Change: -20.1% | |
| RHI Links: Profile News Message Board | |
| Charts:- Daily , Weekly | |
| Add RHI to Watchlist: View: Get Complete RHI Trend Analysis ➞ | |
 | DRVN Driven Brands Holdings Inc. |
| Sector: Services & Goods | |
| SubSector: Auto & Truck Dealerships | |
| MarketCap: 4490 Millions | |
| Recent Price: 14.11 Smart Investing & Trading Score: 36 | |
| Day Percent Change: -4.31% Day Change: -0.63 | |
| Week Change: -2.56% Year-to-date Change: -1.7% | |
| DRVN Links: Profile News Message Board | |
| Charts:- Daily , Weekly | |
| Add DRVN to Watchlist: View: Get Complete DRVN Trend Analysis ➞ | |
 | SAH Sonic Automotive, Inc. |
| Sector: Services & Goods | |
| SubSector: Auto Dealerships | |
| MarketCap: 581.321 Millions | |
| Recent Price: 48.62 Smart Investing & Trading Score: 10 | |
| Day Percent Change: 1.17% Day Change: 0.56 | |
| Week Change: -2.57% Year-to-date Change: -13.5% | |
| SAH Links: Profile News Message Board | |
| Charts:- Daily , Weekly | |
| Add SAH to Watchlist: View: Get Complete SAH Trend Analysis ➞ | |
 | CDNA CareDx, Inc |
| Sector: Services & Goods | |
| SubSector: Research Services | |
| MarketCap: 828.194 Millions | |
| Recent Price: 8.31 Smart Investing & Trading Score: 30 | |
| Day Percent Change: 2.97% Day Change: 0.24 | |
| Week Change: -2.58% Year-to-date Change: -30.8% | |
| CDNA Links: Profile News Message Board | |
| Charts:- Daily , Weekly | |
| Add CDNA to Watchlist: View: Get Complete CDNA Trend Analysis ➞ | |
 | MSA MSA Safety Incorporated |
| Sector: Services & Goods | |
| SubSector: Security & Protection Services | |
| MarketCap: 4167.83 Millions | |
| Recent Price: 185.38 Smart Investing & Trading Score: 36 | |
| Day Percent Change: -0.09% Day Change: -0.17 | |
| Week Change: -2.59% Year-to-date Change: 9.8% | |
| MSA Links: Profile News Message Board | |
| Charts:- Daily , Weekly | |
| Add MSA to Watchlist: View: Get Complete MSA Trend Analysis ➞ | |
 | BATRA The Liberty Braves Group |
| Sector: Services & Goods | |
| SubSector: Broadcasting - TV | |
| MarketCap: 18873.5 Millions | |
| Recent Price: 40.29 Smart Investing & Trading Score: 18 | |
| Day Percent Change: 0.40% Day Change: 0.16 | |
| Week Change: -2.61% Year-to-date Change: -5.8% | |
| BATRA Links: Profile News Message Board | |
| Charts:- Daily , Weekly | |
| Add BATRA to Watchlist: View: Get Complete BATRA Trend Analysis ➞ | |
 | ADT ADT Inc. |
| Sector: Services & Goods | |
| SubSector: Security & Protection Services | |
| MarketCap: 2892.03 Millions | |
| Recent Price: 6.19 Smart Investing & Trading Score: 25 | |
| Day Percent Change: 0.16% Day Change: 0.01 | |
| Week Change: -2.67% Year-to-date Change: -9.2% | |
| ADT Links: Profile News Message Board | |
| Charts:- Daily , Weekly | |
| Add ADT to Watchlist: View: Get Complete ADT Trend Analysis ➞ | |
 | BYD Boyd Gaming Corporation |
| Sector: Services & Goods | |
| SubSector: Resorts & Casinos | |
| MarketCap: 1652.54 Millions | |
| Recent Price: 62.66 Smart Investing & Trading Score: 0 | |
| Day Percent Change: -0.43% Day Change: -0.27 | |
| Week Change: -2.7% Year-to-date Change: 0.1% | |
| BYD Links: Profile News Message Board | |
| Charts:- Daily , Weekly | |
| Add BYD to Watchlist: View: Get Complete BYD Trend Analysis ➞ | |
| For tabular summary view of above stock list: Summary View ➞ 0 - 25 , 25 - 50 , 50 - 75 , 75 - 100 , 100 - 125 , 125 - 150 , 150 - 175 , 175 - 200 , 200 - 225 , 225 - 250 , 250 - 275 , 275 - 300 , 300 - 325 , 325 - 350 , 350 - 375 , 375 - 400 , 400 - 425 , 425 - 450 , 450 - 475 | ||
| Click To Change The Sort Order: By Market Cap or Company Size Performance: Year-to-date, Week and Day | |
| Select Chart Type: | ||
|
Best Stocks Today 12Stocks.com |
© 2024 12Stocks.com Terms & Conditions Privacy Contact Us
All Information Provided Only For Education And Not To Be Used For Investing or Trading. See Terms & Conditions


One More Thing ... Get Best Stocks Delivered Daily!
Never Ever Miss A Move With Our Top Ten Stocks Lists
Find Best Stocks In Any Market - Bull or Bear Market
Take A Peek At Our Top Ten Stocks Lists: Daily, Weekly, Year-to-Date & Top Trends
Find Best Stocks In Any Market - Bull or Bear Market
Take A Peek At Our Top Ten Stocks Lists: Daily, Weekly, Year-to-Date & Top Trends
Consumer Services Stocks With Best Up Trends [0-bearish to 100-bullish]: Gannett Co[100], Gaia [100], Genuine Parts[100], Wendy s[100], Biglari [95], Envestnet [93], MYT Netherlands[93], PaySign [93], Weis Markets[93], FTI Consulting[93], Winmark [90]
Best Consumer Services Stocks Year-to-Date:
U Power[2768.3%], Vroom [1713.36%], Yatsen Holding[394.12%], Fluent [294.03%], Codere Online[136.64%], Research[96.15%], Sweetgreen [82.74%], Bright Scholar[60.8%], PaySign [55.71%], RealReal [54.73%], DXP Enterprises[49.76%] Best Consumer Services Stocks This Week:
Yatsen Holding[20.1%], AMC Entertainment[19.25%], Secoo Holding[17.14%], ContextLogic [16.8%], E.W. Scripps[12.19%], TH [11.82%], Genuine Parts[11.7%], Winmark [11.67%], Advance Auto[11.62%], Altisource Portfolio[11.49%], Envestnet [10.52%] Best Consumer Services Stocks Daily:
Lanvin [11.19%], Allego N.V[8.91%], AMC Entertainment[8.22%], Vision Marine[7.40%], Cumulus Media[7.17%], Altisource Portfolio[7.14%], Urban One[6.92%], Bright Scholar[6.91%], Red Robin[6.67%], Entravision [6.06%], MOGU [5.85%]