
 Login Sign Up


| |||||
 |  | ||||

| 12Stocks.com Market Intelligence |
Best Consumer Services Stocks
| In a hurry? Services & Goods Stocks: Performance Trends Table, Stock Charts
Sort Consumer Services: Daily, Weekly, Year-to-Date, Market Cap & Trends. Filter Services & Goods stocks list by size: All Large Mid-Range Small |
| 12Stocks.com Consumer Services Stocks Performances & Trends Daily | |||||||||
|
|  The overall Smart Investing & Trading Score is 26 (0-bearish to 100-bullish) which puts Consumer Services sector in short term bearish to neutral trend. The Smart Investing & Trading Score from previous trading session is 51 and a deterioration of trend continues.
| ||||||||
Here are the Smart Investing & Trading Scores of the most requested Consumer Services stocks at 12Stocks.com (click stock name for detailed review):
|


| Consider signing up for our daily 12Stocks.com "Best Stocks Newsletter". You will never ever miss a big stock move again! |
| 12Stocks.com: Investing in Consumer Services sector with Stocks | |
|
The following table helps investors and traders sort through current performance and trends (as measured by Smart Investing & Trading Score) of various
stocks in the Consumer Services sector. Quick View: Move mouse or cursor over stock symbol (ticker) to view short-term Technical chart and over stock name to view long term chart. Click on  to add stock symbol to your watchlist and to add stock symbol to your watchlist and  to view watchlist. Click on any ticker or stock name for detailed market intelligence report for that stock. to view watchlist. Click on any ticker or stock name for detailed market intelligence report for that stock. |
12Stocks.com Performance of Stocks in Consumer Services Sector
| Ticker | Stock Name | Watchlist | Category | Recent Price | Smart Investing & Trading Score | Change % | Weekly Change% |
| MCS | Marcus |   | Entertainment | 13.04 | 0 | -0.61% | -0.61% |
| IMAX | IMAX | | Entertainment | 16.33 | 63 | -0.61% | -0.61% |
| KFRC | Kforce | | Staffing | 64.46 | 0 | -0.62% | -0.62% |
| CNK | Cinemark | | Entertainment | 17.68 | 36 | -0.62% | -0.62% |
| APEI | American Public | | Education | 12.61 | 31 | -0.63% | -0.63% |
| SP | SP Plus | | Services | 51.67 | 23 | -0.63% | -0.63% |
| LANV | Lanvin | | Luxury Goods | 1.59 | 40 | -0.63% | -0.63% |
| SIG | Signet Jewelers | | Retail | 95.16 | 0 | -0.64% | -0.64% |
| NSP | Insperity | | Services | 105.23 | 28 | -0.65% | -0.65% |
| ASGN | ASGN | | Staffing | 94.82 | 41 | -0.66% | -0.66% |
| ORLY | O Reilly | | Auto Parts | 1069.27 | 36 | -0.67% | -0.67% |
| TGT | Target | | Retail | 165.01 | 36 | -0.67% | -0.67% |
| LOPE | Grand Canyon | | Education | 129.82 | 13 | -0.67% | -0.67% |
| ARW | Arrow Electronics | | Retail | 123.40 | 36 | -0.68% | -0.68% |
| HVT | Haverty Furniture | | Retail | 30.46 | 8 | -0.68% | -0.68% |
| FAST | Fastenal | | Equipment | 69.39 | 26 | -0.70% | -0.70% |
| CSV | Carriage Services | | Services | 24.07 | 28 | -0.70% | -0.70% |
| CMG | Chipotle Mexican | | Restaurants | 2936.63 | 58 | -0.71% | -0.71% |
| STN | Stantec | | Services | 79.64 | 10 | -0.72% | -0.72% |
| BRLT | Brilliant Earth | | Luxury Goods | 2.71 | 22 | -0.73% | -0.73% |
| CASS | Cass Information | | Services | 45.10 | 26 | -0.75% | -0.75% |
| FTDR | frontdoor | | Services | 30.21 | 28 | -0.76% | -0.76% |
| HCSG | Healthcare Services | | Services | 11.54 | 36 | -0.77% | -0.77% |
| FUN | Cedar Fair | | Entertainment | 38.89 | 0 | -0.77% | -0.77% |
| GLP | Global Partners | | Basic Materials Wholesale | 45.45 | 30 | -0.79% | -0.79% |
| For chart view version of above stock list: Chart View ➞ 0 - 25 , 25 - 50 , 50 - 75 , 75 - 100 , 100 - 125 , 125 - 150 , 150 - 175 , 175 - 200 , 200 - 225 , 225 - 250 , 250 - 275 , 275 - 300 , 300 - 325 , 325 - 350 , 350 - 375 , 375 - 400 , 400 - 425 , 425 - 450 , 450 - 475 | ||
 | Click To Change The Sort Order: By Market Cap or Company Size Performance: Year-to-date, Week and Day |  |
|
Get the most comprehensive stock market coverage daily at 12Stocks.com ➞ Best Stocks Today ➞ Best Stocks Weekly ➞ Best Stocks Year-to-Date ➞ Best Stocks Trends ➞  Best Stocks Today 12Stocks.com Best Nasdaq Stocks ➞ Best S&P 500 Stocks ➞ Best Tech Stocks ➞ Best Biotech Stocks ➞ |
| Detailed Overview of Consumer Services Stocks |
| Consumer Services Technical Overview, Leaders & Laggards, Top Consumer Services ETF Funds & Detailed Consumer Services Stocks List, Charts, Trends & More |
| Consumer Services Sector: Technical Analysis, Trends & YTD Performance | |
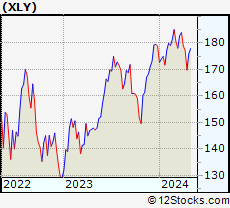
| Consumer Services sector is composed of stocks
from retail, entertainment, media/publishing, consumer goods
and services subsectors. Consumer Services sector, as represented by XLY, an exchange-traded fund [ETF] that holds basket of Consumer Services stocks (e.g, Walmart, Alibaba) is down by -2.6% and is currently underperforming the overall market by -7.94% year-to-date. Below is a quick view of Technical charts and trends: |
|
 XLY Weekly Chart |
|
| Long Term Trend: Good | |
| Medium Term Trend: Not Good | |
 XLY Daily Chart |
|
| Short Term Trend: Not Good | |
| Overall Trend Score: 26 | |
| YTD Performance: -2.6% | |
| **Trend Scores & Views Are Only For Educational Purposes And Not For Investing | |
| 12Stocks.com: Top Performing Consumer Services Sector Stocks | ||||||||||||||||||||||||||||||||||||||||||||||||
 The top performing Consumer Services sector stocks year to date are
Now, more recently, over last week, the top performing Consumer Services sector stocks on the move are


|
||||||||||||||||||||||||||||||||||||||||||||||||
| 12Stocks.com: Investing in Consumer Services Sector using Exchange Traded Funds | |
|
The following table shows list of key exchange traded funds (ETF) that
help investors track Consumer Services Index. For detailed view, check out our ETF Funds section of our website. Quick View: Move mouse or cursor over ETF symbol (ticker) to view short-term Technical chart and over ETF name to view long term chart. Click on ticker or stock name for detailed view. Click on to add stock symbol to your watchlist and to view watchlist. |
12Stocks.com List of ETFs that track Consumer Services Index
| Ticker | ETF Name | Watchlist | Recent Price | Smart Investing & Trading Score | Change % | Week % | Year-to-date % |
| XLY | Consumer Discret Sel | | 174.16 | 26 | -1.67 | -1.67 | -2.6% |
| RTH | Retail | | 199.98 | 26 | -0.85 | -0.85 | 6.24% |
| IYC | Consumer Services | | 79.17 | 26 | -0.03 | -0.03 | 4.49% |
| XRT | Retail | | 70.93 | 26 | -1.32 | -1.32 | -1.92% |
| IYK | Consumer Goods | | 64.33 | 33 | 0.26 | 0.26 | 0.67% |
| UCC | Consumer Services | | 34.00 | 66 | -1.24 | -1.24 | -5.31% |
| RETL | Retail Bull 3X | | 8.34 | 41 | -0.83 | -0.83 | -8.55% |
| RXI | Globl Consumer Discretionary | | 160.94 | 26 | 0.09 | 0.09 | 1.18% |
| SCC | Short Consumer Services | | 16.09 | 74 | 3.36 | 3.36 | 5% |
| UGE | Consumer Goods | | 16.24 | 66 | 0.32 | 0.32 | 3.17% |
| 12Stocks.com: Charts, Trends, Fundamental Data and Performances of Consumer Services Stocks | |
|
We now take in-depth look at all Consumer Services stocks including charts, multi-period performances and overall trends (as measured by Smart Investing & Trading Score). One can sort Consumer Services stocks (click link to choose) by Daily, Weekly and by Year-to-Date performances. Also, one can sort by size of the company or by market capitalization. |
| Select Your Default Chart Type: | |||||
| |||||
| Click on stock symbol or name for detailed view. Click on to add stock symbol to your watchlist and to view watchlist. Quick View: Move mouse or cursor over "Daily" to quickly view daily Technical stock chart and over "Weekly" to view weekly Technical stock chart. | |||||

 | MCS The Marcus Corporation |
| Sector: Services & Goods | |
| SubSector: Entertainment - Diversified | |
| MarketCap: 441.437 Millions | |
| Recent Price: 13.04 Smart Investing & Trading Score: 0 | |
| Day Percent Change: -0.61% Day Change: -0.08 | |
| Week Change: -0.61% Year-to-date Change: -10.6% | |
| MCS Links: Profile News Message Board | |
| Charts:- Daily , Weekly | |
| Add MCS to Watchlist: View: Get Complete MCS Trend Analysis ➞ | |
 | IMAX IMAX Corporation |
| Sector: Services & Goods | |
| SubSector: Entertainment - Diversified | |
| MarketCap: 874.237 Millions | |
| Recent Price: 16.33 Smart Investing & Trading Score: 63 | |
| Day Percent Change: -0.61% Day Change: -0.10 | |
| Week Change: -0.61% Year-to-date Change: 8.7% | |
| IMAX Links: Profile News Message Board | |
| Charts:- Daily , Weekly | |
| Add IMAX to Watchlist: View: Get Complete IMAX Trend Analysis ➞ | |
 | KFRC Kforce Inc. |
| Sector: Services & Goods | |
| SubSector: Staffing & Outsourcing Services | |
| MarketCap: 622.828 Millions | |
| Recent Price: 64.46 Smart Investing & Trading Score: 0 | |
| Day Percent Change: -0.62% Day Change: -0.40 | |
| Week Change: -0.62% Year-to-date Change: -4.6% | |
| KFRC Links: Profile News Message Board | |
| Charts:- Daily , Weekly | |
| Add KFRC to Watchlist: View: Get Complete KFRC Trend Analysis ➞ | |
 | CNK Cinemark Holdings, Inc. |
| Sector: Services & Goods | |
| SubSector: Movie Production, Theaters | |
| MarketCap: 1776.29 Millions | |
| Recent Price: 17.68 Smart Investing & Trading Score: 36 | |
| Day Percent Change: -0.62% Day Change: -0.11 | |
| Week Change: -0.62% Year-to-date Change: 25.5% | |
| CNK Links: Profile News Message Board | |
| Charts:- Daily , Weekly | |
| Add CNK to Watchlist: View: Get Complete CNK Trend Analysis ➞ | |
 | APEI American Public Education, Inc. |
| Sector: Services & Goods | |
| SubSector: Education & Training Services | |
| MarketCap: 361.306 Millions | |
| Recent Price: 12.61 Smart Investing & Trading Score: 31 | |
| Day Percent Change: -0.63% Day Change: -0.08 | |
| Week Change: -0.63% Year-to-date Change: 30.7% | |
| APEI Links: Profile News Message Board | |
| Charts:- Daily , Weekly | |
| Add APEI to Watchlist: View: Get Complete APEI Trend Analysis ➞ | |
 | SP SP Plus Corporation |
| Sector: Services & Goods | |
| SubSector: Management Services | |
| MarketCap: 494.545 Millions | |
| Recent Price: 51.67 Smart Investing & Trading Score: 23 | |
| Day Percent Change: -0.63% Day Change: -0.33 | |
| Week Change: -0.63% Year-to-date Change: 0.8% | |
| SP Links: Profile News Message Board | |
| Charts:- Daily , Weekly | |
| Add SP to Watchlist: View: Get Complete SP Trend Analysis ➞ | |
 | LANV Lanvin Group Holdings Limited |
| Sector: Services & Goods | |
| SubSector: Luxury Goods | |
| MarketCap: 712 Millions | |
| Recent Price: 1.59 Smart Investing & Trading Score: 40 | |
| Day Percent Change: -0.63% Day Change: -0.01 | |
| Week Change: -0.63% Year-to-date Change: -48.0% | |
| LANV Links: Profile News Message Board | |
| Charts:- Daily , Weekly | |
| Add LANV to Watchlist: View: Get Complete LANV Trend Analysis ➞ | |
 | SIG Signet Jewelers Limited |
| Sector: Services & Goods | |
| SubSector: Jewelry Stores | |
| MarketCap: 518.1 Millions | |
| Recent Price: 95.16 Smart Investing & Trading Score: 0 | |
| Day Percent Change: -0.64% Day Change: -0.61 | |
| Week Change: -0.64% Year-to-date Change: -11.3% | |
| SIG Links: Profile News Message Board | |
| Charts:- Daily , Weekly | |
| Add SIG to Watchlist: View: Get Complete SIG Trend Analysis ➞ | |
 | NSP Insperity, Inc. |
| Sector: Services & Goods | |
| SubSector: Business Services | |
| MarketCap: 1385.32 Millions | |
| Recent Price: 105.23 Smart Investing & Trading Score: 28 | |
| Day Percent Change: -0.65% Day Change: -0.69 | |
| Week Change: -0.65% Year-to-date Change: -10.2% | |
| NSP Links: Profile News Message Board | |
| Charts:- Daily , Weekly | |
| Add NSP to Watchlist: View: Get Complete NSP Trend Analysis ➞ | |
 | ASGN ASGN Incorporated |
| Sector: Services & Goods | |
| SubSector: Staffing & Outsourcing Services | |
| MarketCap: 2035.88 Millions | |
| Recent Price: 94.82 Smart Investing & Trading Score: 41 | |
| Day Percent Change: -0.66% Day Change: -0.63 | |
| Week Change: -0.66% Year-to-date Change: -1.4% | |
| ASGN Links: Profile News Message Board | |
| Charts:- Daily , Weekly | |
| Add ASGN to Watchlist: View: Get Complete ASGN Trend Analysis ➞ | |
 | ORLY O Reilly Automotive, Inc. |
| Sector: Services & Goods | |
| SubSector: Auto Parts Stores | |
| MarketCap: 22391.5 Millions | |
| Recent Price: 1069.27 Smart Investing & Trading Score: 36 | |
| Day Percent Change: -0.67% Day Change: -7.22 | |
| Week Change: -0.67% Year-to-date Change: 12.6% | |
| ORLY Links: Profile News Message Board | |
| Charts:- Daily , Weekly | |
| Add ORLY to Watchlist: View: Get Complete ORLY Trend Analysis ➞ | |
 | TGT Target Corporation |
| Sector: Services & Goods | |
| SubSector: Discount, Variety Stores | |
| MarketCap: 55980.6 Millions | |
| Recent Price: 165.01 Smart Investing & Trading Score: 36 | |
| Day Percent Change: -0.67% Day Change: -1.11 | |
| Week Change: -0.67% Year-to-date Change: 15.9% | |
| TGT Links: Profile News Message Board | |
| Charts:- Daily , Weekly | |
| Add TGT to Watchlist: View: Get Complete TGT Trend Analysis ➞ | |
 | LOPE Grand Canyon Education, Inc. |
| Sector: Services & Goods | |
| SubSector: Education & Training Services | |
| MarketCap: 3073.56 Millions | |
| Recent Price: 129.82 Smart Investing & Trading Score: 13 | |
| Day Percent Change: -0.67% Day Change: -0.88 | |
| Week Change: -0.67% Year-to-date Change: -1.7% | |
| LOPE Links: Profile News Message Board | |
| Charts:- Daily , Weekly | |
| Add LOPE to Watchlist: View: Get Complete LOPE Trend Analysis ➞ | |
 | ARW Arrow Electronics, Inc. |
| Sector: Services & Goods | |
| SubSector: Electronics Wholesale | |
| MarketCap: 4155.03 Millions | |
| Recent Price: 123.40 Smart Investing & Trading Score: 36 | |
| Day Percent Change: -0.68% Day Change: -0.85 | |
| Week Change: -0.68% Year-to-date Change: 0.9% | |
| ARW Links: Profile News Message Board | |
| Charts:- Daily , Weekly | |
| Add ARW to Watchlist: View: Get Complete ARW Trend Analysis ➞ | |
 | HVT Haverty Furniture Companies, Inc. |
| Sector: Services & Goods | |
| SubSector: Home Furnishing Stores | |
| MarketCap: 253.125 Millions | |
| Recent Price: 30.46 Smart Investing & Trading Score: 8 | |
| Day Percent Change: -0.68% Day Change: -0.21 | |
| Week Change: -0.68% Year-to-date Change: -14.2% | |
| HVT Links: Profile News Message Board | |
| Charts:- Daily , Weekly | |
| Add HVT to Watchlist: View: Get Complete HVT Trend Analysis ➞ | |
 | FAST Fastenal Company |
| Sector: Services & Goods | |
| SubSector: Industrial Equipment Wholesale | |
| MarketCap: 17609.9 Millions | |
| Recent Price: 69.39 Smart Investing & Trading Score: 26 | |
| Day Percent Change: -0.70% Day Change: -0.49 | |
| Week Change: -0.7% Year-to-date Change: 7.1% | |
| FAST Links: Profile News Message Board | |
| Charts:- Daily , Weekly | |
| Add FAST to Watchlist: View: Get Complete FAST Trend Analysis ➞ | |
 | CSV Carriage Services, Inc. |
| Sector: Services & Goods | |
| SubSector: Personal Services | |
| MarketCap: 304.725 Millions | |
| Recent Price: 24.07 Smart Investing & Trading Score: 28 | |
| Day Percent Change: -0.70% Day Change: -0.17 | |
| Week Change: -0.7% Year-to-date Change: -3.8% | |
| CSV Links: Profile News Message Board | |
| Charts:- Daily , Weekly | |
| Add CSV to Watchlist: View: Get Complete CSV Trend Analysis ➞ | |
 | CMG Chipotle Mexican Grill, Inc. |
| Sector: Services & Goods | |
| SubSector: Restaurants | |
| MarketCap: 16849.9 Millions | |
| Recent Price: 2936.63 Smart Investing & Trading Score: 58 | |
| Day Percent Change: -0.71% Day Change: -20.97 | |
| Week Change: -0.71% Year-to-date Change: 28.4% | |
| CMG Links: Profile News Message Board | |
| Charts:- Daily , Weekly | |
| Add CMG to Watchlist: View: Get Complete CMG Trend Analysis ➞ | |
 | STN Stantec Inc. |
| Sector: Services & Goods | |
| SubSector: Business Services | |
| MarketCap: 2855.92 Millions | |
| Recent Price: 79.64 Smart Investing & Trading Score: 10 | |
| Day Percent Change: -0.72% Day Change: -0.58 | |
| Week Change: -0.72% Year-to-date Change: -0.7% | |
| STN Links: Profile News Message Board | |
| Charts:- Daily , Weekly | |
| Add STN to Watchlist: View: Get Complete STN Trend Analysis ➞ | |
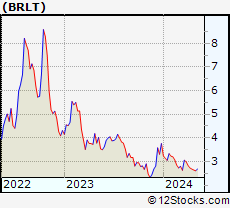 | BRLT Brilliant Earth Group, Inc. |
| Sector: Services & Goods | |
| SubSector: Luxury Goods | |
| MarketCap: 367 Millions | |
| Recent Price: 2.71 Smart Investing & Trading Score: 22 | |
| Day Percent Change: -0.73% Day Change: -0.02 | |
| Week Change: -0.73% Year-to-date Change: -27.9% | |
| BRLT Links: Profile News Message Board | |
| Charts:- Daily , Weekly | |
| Add BRLT to Watchlist: View: Get Complete BRLT Trend Analysis ➞ | |
 | CASS Cass Information Systems, Inc. |
| Sector: Services & Goods | |
| SubSector: Business Services | |
| MarketCap: 477.382 Millions | |
| Recent Price: 45.10 Smart Investing & Trading Score: 26 | |
| Day Percent Change: -0.75% Day Change: -0.34 | |
| Week Change: -0.75% Year-to-date Change: 0.1% | |
| CASS Links: Profile News Message Board | |
| Charts:- Daily , Weekly | |
| Add CASS to Watchlist: View: Get Complete CASS Trend Analysis ➞ | |
 | FTDR frontdoor, inc. |
| Sector: Services & Goods | |
| SubSector: Business Services | |
| MarketCap: 2974.22 Millions | |
| Recent Price: 30.21 Smart Investing & Trading Score: 28 | |
| Day Percent Change: -0.76% Day Change: -0.23 | |
| Week Change: -0.76% Year-to-date Change: -14.2% | |
| FTDR Links: Profile News Message Board | |
| Charts:- Daily , Weekly | |
| Add FTDR to Watchlist: View: Get Complete FTDR Trend Analysis ➞ | |
 | HCSG Healthcare Services Group, Inc. |
| Sector: Services & Goods | |
| SubSector: Business Services | |
| MarketCap: 1758.32 Millions | |
| Recent Price: 11.54 Smart Investing & Trading Score: 36 | |
| Day Percent Change: -0.77% Day Change: -0.09 | |
| Week Change: -0.77% Year-to-date Change: 11.3% | |
| HCSG Links: Profile News Message Board | |
| Charts:- Daily , Weekly | |
| Add HCSG to Watchlist: View: Get Complete HCSG Trend Analysis ➞ | |
 | FUN Cedar Fair, L.P. |
| Sector: Services & Goods | |
| SubSector: General Entertainment | |
| MarketCap: 1440.49 Millions | |
| Recent Price: 38.89 Smart Investing & Trading Score: 0 | |
| Day Percent Change: -0.77% Day Change: -0.30 | |
| Week Change: -0.77% Year-to-date Change: -2.3% | |
| FUN Links: Profile News Message Board | |
| Charts:- Daily , Weekly | |
| Add FUN to Watchlist: View: Get Complete FUN Trend Analysis ➞ | |
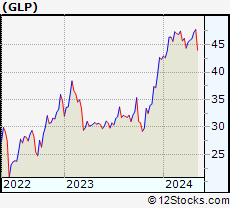 | GLP Global Partners LP |
| Sector: Services & Goods | |
| SubSector: Basic Materials Wholesale | |
| MarketCap: 416.73 Millions | |
| Recent Price: 45.45 Smart Investing & Trading Score: 30 | |
| Day Percent Change: -0.79% Day Change: -0.36 | |
| Week Change: -0.79% Year-to-date Change: 7.4% | |
| GLP Links: Profile News Message Board | |
| Charts:- Daily , Weekly | |
| Add GLP to Watchlist: View: Get Complete GLP Trend Analysis ➞ | |
| For tabular summary view of above stock list: Summary View ➞ 0 - 25 , 25 - 50 , 50 - 75 , 75 - 100 , 100 - 125 , 125 - 150 , 150 - 175 , 175 - 200 , 200 - 225 , 225 - 250 , 250 - 275 , 275 - 300 , 300 - 325 , 325 - 350 , 350 - 375 , 375 - 400 , 400 - 425 , 425 - 450 , 450 - 475 | ||
| Click To Change The Sort Order: By Market Cap or Company Size Performance: Year-to-date, Week and Day | |
| Select Chart Type: | ||
|
Best Stocks Today 12Stocks.com |
© 2024 12Stocks.com Terms & Conditions Privacy Contact Us
All Information Provided Only For Education And Not To Be Used For Investing or Trading. See Terms & Conditions


One More Thing ... Get Best Stocks Delivered Daily!
Never Ever Miss A Move With Our Top Ten Stocks Lists
Find Best Stocks In Any Market - Bull or Bear Market
Take A Peek At Our Top Ten Stocks Lists: Daily, Weekly, Year-to-Date & Top Trends
Find Best Stocks In Any Market - Bull or Bear Market
Take A Peek At Our Top Ten Stocks Lists: Daily, Weekly, Year-to-Date & Top Trends
Consumer Services Stocks With Best Up Trends [0-bearish to 100-bullish]: SES AI[100], Yatsen Holding[100], Coupang [100], Fluent [93], Formula One[90], ABM Industries[86], Trip.com [85], KAR Auction[80], Biglari [76], Lands [76], Yum! Brands[75]
Best Consumer Services Stocks Year-to-Date:
U Power[2578.57%], Vroom [1729.94%], Yatsen Holding[363.37%], Fluent [279.1%], Codere Online[135.96%], Research[89.95%], Sweetgreen [86.55%], DXP Enterprises[57.18%], RealReal [54.73%], Spotify Technology[54.61%], Bright Scholar[46.4%] Best Consumer Services Stocks This Week:
SES AI[15.44%], Yatsen Holding[12.62%], United Homes[6.66%], Liberty SiriusXM[4.1%], Research[3.81%], China Online[3.69%], NL Industries[3.53%], Huazhu [2.96%], Cracker Barrel[2.84%], Team [2.33%], Secoo Holding[2.32%] Best Consumer Services Stocks Daily:
SES AI[15.44%], Yatsen Holding[12.62%], United Homes[6.66%], Liberty SiriusXM[4.10%], Research[3.81%], China Online[3.69%], NL Industries[3.53%], Huazhu [2.96%], Cracker Barrel[2.84%], Team [2.33%], Secoo Holding[2.32%]