
 Login Sign Up


| |||||
 |  | ||||

| 12Stocks.com Market Intelligence |
Best Biotech Stocks
|
|
| Quick Read: Best Biotech Stocks List By Performances & Trends: Daily, Weekly, Year-to-Date, Market Cap (Size) & Technical Trends | |||
| Best Biotech Stocks Views: Quick Browse View, Summary & Slide Show View | |||
| 12Stocks.com Biotech Stocks Performances & Trends Daily | |||||||||
|
|  The overall market intelligence score is 25 (0-bearish to 100-bullish) which puts Biotech sector in short term bearish to neutral trend. The market intelligence score from previous trading session is 32 and a deterioration of trend continues.
| ||||||||
Here are the market intelligence trend scores of the most requested Biotech stocks at 12Stocks.com (click stock name for detailed review):
|


| 12Stocks.com: Investing in Biotech sector with Stocks | |
|
The following table helps investors and traders sort through current performance and trends (as measured by market intelligence score) of various
stocks in the Biotech sector. Quick View: Move mouse or cursor over stock symbol (ticker) to view short-term Technical chart and over stock name to view long term chart. Click on  to add stock symbol to your watchlist and to add stock symbol to your watchlist and  to view watchlist. Click on any ticker or stock name for detailed market intelligence report for that stock. to view watchlist. Click on any ticker or stock name for detailed market intelligence report for that stock. |
12Stocks.com Performance of Stocks in Biotech Sector
| Ticker | Stock Name | Watchlist | Category | Recent Price | Market Intelligence Score | Change % | YTD Change% |
| VCYT | Veracyte |   | Biotechnology | 19.48 | 42 | -2.11 | -29.19% |
| TSVT | 2seventy bio | | Biotechnology | 4.29 | 10 | -2.17 | -0.81% |
| DVAX | Dynavax Technologies | | Biotechnology | 11.17 | 10 | -2.19 | -20.10% |
| RIGL | Rigel | | Biotechnology | 1.10 | 25 | -2.22 | -24.14% |
| GBIO | Generation Bio | | Biotechnology | 2.92 | 61 | -2.34 | 77.27% |
| PIRS | Pieris | | Biotechnology | 11.60 | 93 | -2.36 | NA |
| BCLI | Brainstorm Cell | | Biotechnology | 0.53 | 54 | -2.39 | 94.87% |
| URGN | UroGen Pharma | | Biotechnology | 13.87 | 50 | -2.39 | -7.53% |
| INZY | Inozyme Pharma | | Biotechnology | 4.29 | 10 | -2.39 | 0.94% |
| CRNX | Crinetics | | Biotechnology | 42.28 | 56 | -2.40 | 18.83% |
| SPRY | ARS | | Biotechnology | 8.09 | 46 | -2.41 | 42.30% |
| MRNA | Moderna | | Biotechnology | 106.21 | 73 | -2.43 | 6.79% |
| EDIT | Editas Medicine | | Biotechnology | 5.22 | 10 | -2.43 | -48.47% |
| PLRX | Pliant | | Biotechnology | 11.59 | 10 | -2.44 | -36.04% |
| PRQR | ProQR | | Biotechnology | 1.96 | 32 | -2.49 | -1.01% |
| VALN | Valneva SE | | Biotechnology | 7.55 | 35 | -2.49 | -27.19% |
| ABOS | Acumen | | Biotechnology | 3.09 | 25 | -2.52 | -19.53% |
| TERN | Terns | | Biotechnology | 4.64 | 10 | -2.52 | -29.80% |
| REPL | Replimune | | Biotechnology | 6.17 | 10 | -2.53 | -26.81% |
| SCPH | sc | | Biotechnology | 4.38 | 35 | -2.56 | -30.06% |
| MNOV | MediciNova | | Biotechnology | 1.32 | 20 | -2.58 | -12.00% |
| KROS | Keros | | Biotechnology | 54.63 | 36 | -2.67 | 37.14% |
| QTRX | Quanterix | | Biotechnology | 15.61 | 10 | -2.68 | -42.90% |
| GILD | Gilead | | Biotechnology | 65.27 | 0 | -2.70 | -19.43% |
| KZR | Kezar Life | | Biotechnology | 0.78 | 50 | -2.72 | -17.71% |
| To view more stocks, click on Next / Previous arrows or select different range: 0 - 25 , 25 - 50 , 50 - 75 , 75 - 100 , 100 - 125 , 125 - 150 , 150 - 175 , 175 - 200 , 200 - 225 , 225 - 250 , 250 - 275 , 275 - 300 , 300 - 325 , 325 - 350 , 350 - 375 , 375 - 400 | ||
 | Click To Change The Sort Order: By Market Cap or Company Size Performance: Year-to-date, Week and Day |  |
|
Get the most comprehensive stock market coverage daily at 12Stocks.com ➞ Best Stocks Today ➞ Best Stocks Weekly ➞ Best Stocks Year-to-Date ➞ Best Stocks Trends ➞  Best Stocks Today 12Stocks.com Best Nasdaq Stocks ➞ Best S&P 500 Stocks ➞ Best Tech Stocks ➞ Best Biotech Stocks ➞ |
| Detailed Overview of Biotech Stocks |
| Biotech Technical Overview, Leaders & Laggards, Top Biotech ETF Funds & Detailed Biotech Stocks List, Charts, Trends & More |
| Biotech Sector: Technical Analysis, Trends & YTD Performance | |
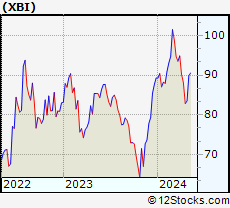
| Biotech sector, as represented by XBI, an exchange-traded fund [ETF] that holds basket of Biotech stocks (e.g, Amgen, Celgene) is down by -7.92% and is currently underperforming the overall market by -13.08% year-to-date. Below is a quick view of Technical charts and trends: | |
 XBI Weekly Chart |
|
| Long Term Trend: Not Good | |
| Medium Term Trend: Not Good | |
 XBI Daily Chart |
|
| Short Term Trend: Very Good | |
| Overall Trend Score: 25 | |
| YTD Performance: -7.92% | |
| **Trend Scores & Views Are Only For Educational Purposes And Not For Investing | |
| 12Stocks.com: Top Performing Biotech Sector Stocks | ||||||||||||||||||||||||||||||||||||||||||||||||
 The top performing Biotech sector stocks year to date are
Now, more recently, over last week, the top performing Biotech sector stocks on the move are


|
||||||||||||||||||||||||||||||||||||||||||||||||
| 12Stocks.com: Investing in Biotech Sector using Exchange Traded Funds | |
|
The following table shows list of key exchange traded funds (ETF) that
help investors track Biotech Index. For detailed view, check out our ETF Funds section of our website. Quick View: Move mouse or cursor over ETF symbol (ticker) to view short-term Technical chart and over ETF name to view long term chart. Click on ticker or stock name for detailed view. Click on to add stock symbol to your watchlist and to view watchlist. |
12Stocks.com List of ETFs that track Biotech Index
| Ticker | ETF Name | Watchlist | Recent Price | Market Intelligence Score | Change % | Week % | Year-to-date % |
| LABD | Biotech Bear 3X | | 11.03 | 75 | 6.36 | 2.13 | 13.83% |
| XBI | Biotech | | 82.22 | 25 | -2.05 | -0.74 | -7.92% |
| LABU | Biotech Bull 3X | | 83.72 | 25 | -6.35 | -2.71 | -31.36% |
| IBB | Biotechnology | | 125.67 | 18 | -1.64 | 0.76 | -7.49% |
| IYH | Healthcare | | 58.68 | 45 | -0.69 | 0.89 | 2.5% |
| IHF | Healthcare Providers | | 52.11 | 55 | -0.29 | -0.19 | -0.76% |
| IXJ | Global Healthcare | | 88.91 | 25 | -0.45 | 1.32 | 2.53% |
| BBH | Biotech | | 154.61 | 49 | -1.73 | 1.48 | -6.47% |
| FBT | First NYSE | | 142.59 | 25 | -1.93 | 0.64 | -9.78% |
| CURE | Healthcare Bull 3X | | 105.32 | 25 | -2.35 | 1.92 | 3.52% |
| BIB | Biotechnology | | 48.83 | 32 | -2.69 | 1.31 | -14.41% |
| BIS | Short Biotech | | 20.59 | 61 | 2.49 | -1.46 | 13.95% |
| PTH | DWA Healthcare Momentum | | 39.60 | 46 | -0.08 | 0.18 | 1.18% |
| PBE | Biotech & Genome | | 59.85 | 32 | -1.69 | 0 | -9.1% |
| BBC | Bio Biotechnology Clinical | | 24.70 | 36 | -3.62 | -0.04 | 1.01% |
| BTEC | Principal Healthcare Innovators | | 34.21 | 32 | 0.02 | 1.04 | -5.83% |
| BBP | Bio Biotechnology Products | | 51.14 | 35 | -2.40 | 1.41 | -11.96% |
| 12Stocks.com: Charts, Trends, Fundamental Data and Performances of Biotech Stocks | |
|
We now take in-depth look at all Biotech stocks including charts, multi-period performances and overall trends (as measured by market intelligence score). One can sort Biotech stocks (click link to choose) by Daily, Weekly and by Year-to-Date performances. Also, one can sort by size of the company or by market capitalization. |
| Select Your Default Chart Type: | |||||
| |||||
| Click on stock symbol or name for detailed view. Click on to add stock symbol to your watchlist and to view watchlist. Quick View: Move mouse or cursor over "Daily" to quickly view daily Technical stock chart and over "Weekly" to view weekly Technical stock chart. | |||||

 | VCYT Veracyte, Inc. |
| Sector: Health Care | |
| SubSector: Biotechnology | |
| MarketCap: 1089.05 Millions | |
| Recent Price: 19.48 Market Intelligence Score: 42 | |
| Day Percent Change: -2.11% Day Change: -0.42 | |
| Week Change: 0.15% Year-to-date Change: -29.2% | |
| VCYT Links: Profile News Message Board | |
| Charts:- Daily , Weekly | |
| Add VCYT to Watchlist: View: Get Complete VCYT Trend Analysis ➞ | |
 | TSVT 2seventy bio, Inc. |
| Sector: Health Care | |
| SubSector: Biotechnology | |
| MarketCap: 504 Millions | |
| Recent Price: 4.29 Market Intelligence Score: 10 | |
| Day Percent Change: -2.17% Day Change: -0.09 | |
| Week Change: -5.09% Year-to-date Change: -0.8% | |
| TSVT Links: Profile News Message Board | |
| Charts:- Daily , Weekly | |
| Add TSVT to Watchlist: View: Get Complete TSVT Trend Analysis ➞ | |
 | DVAX Dynavax Technologies Corporation |
| Sector: Health Care | |
| SubSector: Biotechnology | |
| MarketCap: 276.885 Millions | |
| Recent Price: 11.17 Market Intelligence Score: 10 | |
| Day Percent Change: -2.19% Day Change: -0.25 | |
| Week Change: -5.34% Year-to-date Change: -20.1% | |
| DVAX Links: Profile News Message Board | |
| Charts:- Daily , Weekly | |
| Add DVAX to Watchlist: View: Get Complete DVAX Trend Analysis ➞ | |
 | RIGL Rigel Pharmaceuticals, Inc. |
| Sector: Health Care | |
| SubSector: Biotechnology | |
| MarketCap: 256.585 Millions | |
| Recent Price: 1.10 Market Intelligence Score: 25 | |
| Day Percent Change: -2.22% Day Change: -0.02 | |
| Week Change: 1.85% Year-to-date Change: -24.1% | |
| RIGL Links: Profile News Message Board | |
| Charts:- Daily , Weekly | |
| Add RIGL to Watchlist: View: Get Complete RIGL Trend Analysis ➞ | |
 | GBIO Generation Bio Co. |
| Sector: Health Care | |
| SubSector: Biotechnology | |
| MarketCap: 17487 Millions | |
| Recent Price: 2.92 Market Intelligence Score: 61 | |
| Day Percent Change: -2.34% Day Change: -0.07 | |
| Week Change: 5.6% Year-to-date Change: 77.3% | |
| GBIO Links: Profile News Message Board | |
| Charts:- Daily , Weekly | |
| Add GBIO to Watchlist: View: Get Complete GBIO Trend Analysis ➞ | |
 | PIRS Pieris Pharmaceuticals, Inc. |
| Sector: Health Care | |
| SubSector: Biotechnology | |
| MarketCap: 150.785 Millions | |
| Recent Price: 11.60 Market Intelligence Score: 93 | |
| Day Percent Change: -2.36% Day Change: -0.28 | |
| Week Change: 7900% Year-to-date Change: 6,273.6% | |
| PIRS Links: Profile News Message Board | |
| Charts:- Daily , Weekly | |
| Add PIRS to Watchlist: View: Get Complete PIRS Trend Analysis ➞ | |
 | BCLI Brainstorm Cell Therapeutics Inc. |
| Sector: Health Care | |
| SubSector: Biotechnology | |
| MarketCap: 141.285 Millions | |
| Recent Price: 0.53 Market Intelligence Score: 54 | |
| Day Percent Change: -2.39% Day Change: -0.01 | |
| Week Change: 0% Year-to-date Change: 94.9% | |
| BCLI Links: Profile News Message Board | |
| Charts:- Daily , Weekly | |
| Add BCLI to Watchlist: View: Get Complete BCLI Trend Analysis ➞ | |
 | URGN UroGen Pharma Ltd. |
| Sector: Health Care | |
| SubSector: Biotechnology | |
| MarketCap: 373.485 Millions | |
| Recent Price: 13.87 Market Intelligence Score: 50 | |
| Day Percent Change: -2.39% Day Change: -0.34 | |
| Week Change: 0.65% Year-to-date Change: -7.5% | |
| URGN Links: Profile News Message Board | |
| Charts:- Daily , Weekly | |
| Add URGN to Watchlist: View: Get Complete URGN Trend Analysis ➞ | |
 | INZY Inozyme Pharma, Inc. |
| Sector: Health Care | |
| SubSector: Biotechnology | |
| MarketCap: 53487 Millions | |
| Recent Price: 4.29 Market Intelligence Score: 10 | |
| Day Percent Change: -2.39% Day Change: -0.11 | |
| Week Change: -4.24% Year-to-date Change: 0.9% | |
| INZY Links: Profile News Message Board | |
| Charts:- Daily , Weekly | |
| Add INZY to Watchlist: View: Get Complete INZY Trend Analysis ➞ | |
 | CRNX Crinetics Pharmaceuticals, Inc. |
| Sector: Health Care | |
| SubSector: Biotechnology | |
| MarketCap: 381.085 Millions | |
| Recent Price: 42.28 Market Intelligence Score: 56 | |
| Day Percent Change: -2.40% Day Change: -1.04 | |
| Week Change: -1.63% Year-to-date Change: 18.8% | |
| CRNX Links: Profile News Message Board | |
| Charts:- Daily , Weekly | |
| Add CRNX to Watchlist: View: Get Complete CRNX Trend Analysis ➞ | |
 | SPRY ARS Pharmaceuticals, Inc. |
| Sector: Health Care | |
| SubSector: Biotechnology | |
| MarketCap: 632 Millions | |
| Recent Price: 8.09 Market Intelligence Score: 46 | |
| Day Percent Change: -2.41% Day Change: -0.20 | |
| Week Change: -4.49% Year-to-date Change: 42.3% | |
| SPRY Links: Profile News Message Board | |
| Charts:- Daily , Weekly | |
| Add SPRY to Watchlist: View: Get Complete SPRY Trend Analysis ➞ | |
 | MRNA Moderna, Inc. |
| Sector: Health Care | |
| SubSector: Biotechnology | |
| MarketCap: 11006.4 Millions | |
| Recent Price: 106.21 Market Intelligence Score: 73 | |
| Day Percent Change: -2.43% Day Change: -2.64 | |
| Week Change: 4.7% Year-to-date Change: 6.8% | |
| MRNA Links: Profile News Message Board | |
| Charts:- Daily , Weekly | |
| Add MRNA to Watchlist: View: Get Complete MRNA Trend Analysis ➞ | |
 | EDIT Editas Medicine, Inc. |
| Sector: Health Care | |
| SubSector: Biotechnology | |
| MarketCap: 1194.95 Millions | |
| Recent Price: 5.22 Market Intelligence Score: 10 | |
| Day Percent Change: -2.43% Day Change: -0.13 | |
| Week Change: -4.92% Year-to-date Change: -48.5% | |
| EDIT Links: Profile News Message Board | |
| Charts:- Daily , Weekly | |
| Add EDIT to Watchlist: View: Get Complete EDIT Trend Analysis ➞ | |
 | PLRX Pliant Therapeutics, Inc. |
| Sector: Health Care | |
| SubSector: Biotechnology | |
| MarketCap: 96487 Millions | |
| Recent Price: 11.59 Market Intelligence Score: 10 | |
| Day Percent Change: -2.44% Day Change: -0.29 | |
| Week Change: -5% Year-to-date Change: -36.0% | |
| PLRX Links: Profile News Message Board | |
| Charts:- Daily , Weekly | |
| Add PLRX to Watchlist: View: Get Complete PLRX Trend Analysis ➞ | |
 | PRQR ProQR Therapeutics N.V. |
| Sector: Health Care | |
| SubSector: Biotechnology | |
| MarketCap: 324.385 Millions | |
| Recent Price: 1.96 Market Intelligence Score: 32 | |
| Day Percent Change: -2.49% Day Change: -0.05 | |
| Week Change: -1.51% Year-to-date Change: -1.0% | |
| PRQR Links: Profile News Message Board | |
| Charts:- Daily , Weekly | |
| Add PRQR to Watchlist: View: Get Complete PRQR Trend Analysis ➞ | |
 | VALN Valneva SE |
| Sector: Health Care | |
| SubSector: Biotechnology | |
| MarketCap: 1010 Millions | |
| Recent Price: 7.55 Market Intelligence Score: 35 | |
| Day Percent Change: -2.49% Day Change: -0.19 | |
| Week Change: -0.44% Year-to-date Change: -27.2% | |
| VALN Links: Profile News Message Board | |
| Charts:- Daily , Weekly | |
| Add VALN to Watchlist: View: Get Complete VALN Trend Analysis ➞ | |
 | ABOS Acumen Pharmaceuticals, Inc. |
| Sector: Health Care | |
| SubSector: Biotechnology | |
| MarketCap: 199 Millions | |
| Recent Price: 3.09 Market Intelligence Score: 25 | |
| Day Percent Change: -2.52% Day Change: -0.08 | |
| Week Change: -1.9% Year-to-date Change: -19.5% | |
| ABOS Links: Profile News Message Board | |
| Charts:- Daily , Weekly | |
| Add ABOS to Watchlist: View: Get Complete ABOS Trend Analysis ➞ | |
 | TERN Terns Pharmaceuticals, Inc. |
| Sector: Health Care | |
| SubSector: Biotechnology | |
| MarketCap: 611 Millions | |
| Recent Price: 4.64 Market Intelligence Score: 10 | |
| Day Percent Change: -2.52% Day Change: -0.12 | |
| Week Change: 1.75% Year-to-date Change: -29.8% | |
| TERN Links: Profile News Message Board | |
| Charts:- Daily , Weekly | |
| Add TERN to Watchlist: View: Get Complete TERN Trend Analysis ➞ | |
 | REPL Replimune Group, Inc. |
| Sector: Health Care | |
| SubSector: Biotechnology | |
| MarketCap: 367.885 Millions | |
| Recent Price: 6.17 Market Intelligence Score: 10 | |
| Day Percent Change: -2.53% Day Change: -0.16 | |
| Week Change: -4.64% Year-to-date Change: -26.8% | |
| REPL Links: Profile News Message Board | |
| Charts:- Daily , Weekly | |
| Add REPL to Watchlist: View: Get Complete REPL Trend Analysis ➞ | |
 | SCPH scPharmaceuticals Inc. |
| Sector: Health Care | |
| SubSector: Biotechnology | |
| MarketCap: 136.185 Millions | |
| Recent Price: 4.38 Market Intelligence Score: 35 | |
| Day Percent Change: -2.56% Day Change: -0.12 | |
| Week Change: -3.63% Year-to-date Change: -30.1% | |
| SCPH Links: Profile News Message Board | |
| Charts:- Daily , Weekly | |
| Add SCPH to Watchlist: View: Get Complete SCPH Trend Analysis ➞ | |
 | MNOV MediciNova, Inc. |
| Sector: Health Care | |
| SubSector: Biotechnology | |
| MarketCap: 137.685 Millions | |
| Recent Price: 1.32 Market Intelligence Score: 20 | |
| Day Percent Change: -2.58% Day Change: -0.03 | |
| Week Change: -5.04% Year-to-date Change: -12.0% | |
| MNOV Links: Profile News Message Board | |
| Charts:- Daily , Weekly | |
| Add MNOV to Watchlist: View: Get Complete MNOV Trend Analysis ➞ | |
 | KROS Keros Therapeutics, Inc. |
| Sector: Health Care | |
| SubSector: Biotechnology | |
| MarketCap: 17887 Millions | |
| Recent Price: 54.63 Market Intelligence Score: 36 | |
| Day Percent Change: -2.67% Day Change: -1.50 | |
| Week Change: -6.7% Year-to-date Change: 37.1% | |
| KROS Links: Profile News Message Board | |
| Charts:- Daily , Weekly | |
| Add KROS to Watchlist: View: Get Complete KROS Trend Analysis ➞ | |
 | QTRX Quanterix Corporation |
| Sector: Health Care | |
| SubSector: Biotechnology | |
| MarketCap: 448.685 Millions | |
| Recent Price: 15.61 Market Intelligence Score: 10 | |
| Day Percent Change: -2.68% Day Change: -0.43 | |
| Week Change: -1.45% Year-to-date Change: -42.9% | |
| QTRX Links: Profile News Message Board | |
| Charts:- Daily , Weekly | |
| Add QTRX to Watchlist: View: Get Complete QTRX Trend Analysis ➞ | |
 | GILD Gilead Sciences, Inc. |
| Sector: Health Care | |
| SubSector: Biotechnology | |
| MarketCap: 99485.6 Millions | |
| Recent Price: 65.27 Market Intelligence Score: 0 | |
| Day Percent Change: -2.70% Day Change: -1.81 | |
| Week Change: -2.23% Year-to-date Change: -19.4% | |
| GILD Links: Profile News Message Board | |
| Charts:- Daily , Weekly | |
| Add GILD to Watchlist: View: Get Complete GILD Trend Analysis ➞ | |
 | KZR Kezar Life Sciences, Inc. |
| Sector: Health Care | |
| SubSector: Biotechnology | |
| MarketCap: 174.885 Millions | |
| Recent Price: 0.78 Market Intelligence Score: 50 | |
| Day Percent Change: -2.72% Day Change: -0.02 | |
| Week Change: -1% Year-to-date Change: -17.7% | |
| KZR Links: Profile News Message Board | |
| Charts:- Daily , Weekly | |
| Add KZR to Watchlist: View: Get Complete KZR Trend Analysis ➞ | |
| To view more stocks, click on Next / Previous arrows or select different range: 0 - 25 , 25 - 50 , 50 - 75 , 75 - 100 , 100 - 125 , 125 - 150 , 150 - 175 , 175 - 200 , 200 - 225 , 225 - 250 , 250 - 275 , 275 - 300 , 300 - 325 , 325 - 350 , 350 - 375 , 375 - 400 | ||
| Click To Change The Sort Order: By Market Cap or Company Size Performance: Year-to-date, Week and Day | |
| Select Chart Type: | ||
|
Best Stocks Today 12Stocks.com |
© 2024 12Stocks.com Terms & Conditions Privacy Contact Us
All Information Provided Only For Education And Not To Be Used For Investing or Trading. See Terms & Conditions


One More Thing ... Get Best Stocks Delivered Daily!
Never Ever Miss A Move With Our Top Ten Stocks Lists
Find Best Stocks In Any Market - Bull or Bear Market
Take A Peek At Our Top Ten Stocks Lists: Daily, Weekly, Year-to-Date & Top Trends
Find Best Stocks In Any Market - Bull or Bear Market
Take A Peek At Our Top Ten Stocks Lists: Daily, Weekly, Year-to-Date & Top Trends
Biotech Stocks With Best Up Trends [0-bearish to 100-bullish]: Annovis Bio[100], Agios [100], Agenus [95], Mesoblast [95], Cullinan Oncology[93], Avadel [93], Pieris [93], NewAmsterdam Pharma[93], PureTech Health[93], Exelixis [90], ALX Oncology[88]
Best Biotech Stocks Year-to-Date:
Pieris [6273.63%], Precision [2590.41%], Inovio [1885.29%], Assembly [1529.07%], NuCana [1198.17%], Adverum nologies[1147.34%], Agenus [902.54%], Affimed N.V[680.8%], Mesoblast [459.09%], Corbus [454.64%], Janux [338.34%] Best Biotech Stocks This Week:
Pieris [7900%], Agenus [56.31%], ProKidney [32.84%], Seres [32.65%], Annovis Bio[30%], BeyondSpring [26.11%], Cullinan Oncology[22.92%], Pharvaris N.V[18.84%], Mesoblast [18.04%], BeiGene [14.7%], Avid Bioservices[14.2%] Best Biotech Stocks Daily:
Galera [13.74%], Agenus [11.86%], ADiTx [10.57%], Apollomics [9.94%], Pharming [9.06%], Structure [8.13%], Pharvaris N.V[7.91%], ProKidney [7.75%], Avid Bioservices[7.17%], Merus N.V[7.05%], Zura Bio[6.75%]