
 Login Sign Up


| |||||
 |  | ||||

| 12Stocks.com Market Intelligence |
Best Biotech Stocks
|
|
| Quick Read: Best Biotech Stocks List By Performances & Trends: Daily, Weekly, Year-to-Date, Market Cap (Size) & Technical Trends | |||
| Best Biotech Stocks Views: Quick Browse View, Summary & Slide Show View | |||
| 12Stocks.com Biotech Stocks Performances & Trends Daily | |||||||||
|
|  The overall market intelligence score is 32 (0-bearish to 100-bullish) which puts Biotech sector in short term bearish to neutral trend. The market intelligence score from previous trading session is 10 and hence an improvement of trend.
| ||||||||
Here are the market intelligence trend scores of the most requested Biotech stocks at 12Stocks.com (click stock name for detailed review):
|


| 12Stocks.com: Investing in Biotech sector with Stocks | |
|
The following table helps investors and traders sort through current performance and trends (as measured by market intelligence score) of various
stocks in the Biotech sector. Quick View: Move mouse or cursor over stock symbol (ticker) to view short-term Technical chart and over stock name to view long term chart. Click on  to add stock symbol to your watchlist and to add stock symbol to your watchlist and  to view watchlist. Click on any ticker or stock name for detailed market intelligence report for that stock. to view watchlist. Click on any ticker or stock name for detailed market intelligence report for that stock. |
12Stocks.com Performance of Stocks in Biotech Sector
| Ticker | Stock Name | Watchlist | Category | Recent Price | Market Intelligence Score | Change % | YTD Change% |
| VRCA | Verrica |   | Biotechnology | 6.85 | 56 | 0.88 | -6.42% |
| SCPH | sc | | Biotechnology | 4.61 | 32 | 0.88 | -26.48% |
| MORF | Morphic Holding | | Biotechnology | 28.75 | 42 | 0.88 | -0.45% |
| ZLAB | Zai Lab | | Biotechnology | 15.12 | 49 | 0.87 | -44.68% |
| LTRN | Lantern Pharma | | Biotechnology | 5.77 | 43 | 0.87 | 34.50% |
| ANTX | AN2 | | Biotechnology | 2.38 | 10 | 0.85 | -88.38% |
| VERA | Vera | | Biotechnology | 39.46 | 63 | 0.84 | 154.91% |
| MTNB | Matinas BioPharma | | Biotechnology | 0.18 | 10 | 0.83 | -16.05% |
| AVRO | AVROBIO | | Biotechnology | 1.21 | 0 | 0.83 | -11.03% |
| LEGN | Legend | | Biotechnology | 47.45 | 25 | 0.83 | -21.34% |
| REGN | Regeneron | | Biotechnology | 907.32 | 32 | 0.80 | 3.31% |
| ALKS | Alkermes | | Biotechnology | 24.26 | 32 | 0.79 | -12.55% |
| ANIP | ANI | | Biotechnology | 66.14 | 58 | 0.79 | 19.95% |
| AUPH | Aurinia | | Biotechnology | 5.09 | 50 | 0.79 | -43.38% |
| JAZZ | Jazz | | Biotechnology | 109.67 | 18 | 0.77 | -10.84% |
| DNLI | Denali | | Biotechnology | 16.11 | 30 | 0.75 | -24.93% |
| AKBA | Akebia | | Biotechnology | 1.37 | 17 | 0.74 | 10.48% |
| UBX | Unity nology | | Biotechnology | 1.49 | 10 | 0.68 | -22.80% |
| HALO | Halozyme | | Biotechnology | 38.97 | 75 | 0.67 | 5.44% |
| ABOS | Acumen | | Biotechnology | 3.15 | 22 | 0.64 | -17.97% |
| DCPH | Deciphera | | Biotechnology | 14.67 | 63 | 0.62 | -9.05% |
| AMGN | Amgen | | Biotechnology | 273.54 | 64 | 0.60 | -5.03% |
| CTMX | CytomX | | Biotechnology | 1.68 | 36 | 0.60 | 8.39% |
| CCCC | C4 | | Biotechnology | 6.90 | 56 | 0.58 | 22.34% |
| KALV | KalVista | | Biotechnology | 11.53 | 40 | 0.57 | -5.92% |
| To view more stocks, click on Next / Previous arrows or select different range: 0 - 25 , 25 - 50 , 50 - 75 , 75 - 100 , 100 - 125 , 125 - 150 , 150 - 175 , 175 - 200 , 200 - 225 , 225 - 250 , 250 - 275 , 275 - 300 , 300 - 325 , 325 - 350 , 350 - 375 , 375 - 400 | ||
 | Click To Change The Sort Order: By Market Cap or Company Size Performance: Year-to-date, Week and Day |  |
|
Get the most comprehensive stock market coverage daily at 12Stocks.com ➞ Best Stocks Today ➞ Best Stocks Weekly ➞ Best Stocks Year-to-Date ➞ Best Stocks Trends ➞  Best Stocks Today 12Stocks.com Best Nasdaq Stocks ➞ Best S&P 500 Stocks ➞ Best Tech Stocks ➞ Best Biotech Stocks ➞ |
| Detailed Overview of Biotech Stocks |
| Biotech Technical Overview, Leaders & Laggards, Top Biotech ETF Funds & Detailed Biotech Stocks List, Charts, Trends & More |
| Biotech Sector: Technical Analysis, Trends & YTD Performance | |
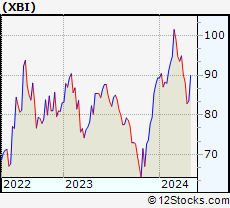
| Biotech sector, as represented by XBI, an exchange-traded fund [ETF] that holds basket of Biotech stocks (e.g, Amgen, Celgene) is down by -5.15% and is currently underperforming the overall market by -10.79% year-to-date. Below is a quick view of Technical charts and trends: | |
 XBI Weekly Chart |
|
| Long Term Trend: Not Good | |
| Medium Term Trend: Not Good | |
 XBI Daily Chart |
|
| Short Term Trend: Very Good | |
| Overall Trend Score: 32 | |
| YTD Performance: -5.15% | |
| **Trend Scores & Views Are Only For Educational Purposes And Not For Investing | |
| 12Stocks.com: Top Performing Biotech Sector Stocks | ||||||||||||||||||||||||||||||||||||||||||||||||
 The top performing Biotech sector stocks year to date are
Now, more recently, over last week, the top performing Biotech sector stocks on the move are


|
||||||||||||||||||||||||||||||||||||||||||||||||
| 12Stocks.com: Investing in Biotech Sector using Exchange Traded Funds | |
|
The following table shows list of key exchange traded funds (ETF) that
help investors track Biotech Index. For detailed view, check out our ETF Funds section of our website. Quick View: Move mouse or cursor over ETF symbol (ticker) to view short-term Technical chart and over ETF name to view long term chart. Click on ticker or stock name for detailed view. Click on to add stock symbol to your watchlist and to view watchlist. |
12Stocks.com List of ETFs that track Biotech Index
| Ticker | ETF Name | Watchlist | Recent Price | Market Intelligence Score | Change % | Week % | Year-to-date % |
| LABD | Biotech Bear 3X | | 10.07 | 42 | -6.33 | -6.76 | 3.92% |
| XBI | Biotech | | 84.69 | 32 | 2.28 | 2.25 | -5.15% |
| LABU | Biotech Bull 3X | | 91.98 | 32 | 6.42 | 6.89 | -24.59% |
| IBB | Biotechnology | | 128.02 | 32 | 1.51 | 2.65 | -5.76% |
| PBE | Biotech & Genome | | 61.14 | 49 | 0.82 | 2.16 | -7.14% |
| IXJ | Global Healthcare | | 89.62 | 65 | 1.37 | 2.13 | 3.34% |
| IYH | Healthcare | | 59.21 | 65 | 1.33 | 1.81 | 3.43% |
| IHF | Healthcare Providers | | 52.32 | 70 | 0.47 | 0.21 | -0.36% |
| CURE | Healthcare Bull 3X | | 108.12 | 39 | 3.52 | 4.64 | 6.27% |
| BIB | Biotechnology | | 50.33 | 39 | 2.51 | 4.42 | -11.78% |
| FBT | First NYSE | | 145.32 | 42 | 1.68 | 2.57 | -8.05% |
| BBH | Biotech | | 157.29 | 49 | 1.77 | 3.24 | -4.85% |
| BIS | Short Biotech | | 19.94 | 68 | -2.59 | -4.57 | 10.35% |
| PTH | DWA Healthcare Momentum | | 40.17 | 35 | 2.11 | 1.62 | 2.63% |
| BBP | Bio Biotechnology Products | | 52.39 | 42 | 1.87 | 3.89 | -9.81% |
| BTEC | Principal Healthcare Innovators | | 34.81 | 25 | 3.10 | 2.79 | -4.2% |
| BBC | Bio Biotechnology Clinical | | 25.67 | 51 | 3.26 | 3.89 | 4.98% |
| 12Stocks.com: Charts, Trends, Fundamental Data and Performances of Biotech Stocks | |
|
We now take in-depth look at all Biotech stocks including charts, multi-period performances and overall trends (as measured by market intelligence score). One can sort Biotech stocks (click link to choose) by Daily, Weekly and by Year-to-Date performances. Also, one can sort by size of the company or by market capitalization. |
| Select Your Default Chart Type: | |||||
| |||||
| Click on stock symbol or name for detailed view. Click on to add stock symbol to your watchlist and to view watchlist. Quick View: Move mouse or cursor over "Daily" to quickly view daily Technical stock chart and over "Weekly" to view weekly Technical stock chart. | |||||

 | VRCA Verrica Pharmaceuticals Inc. |
| Sector: Health Care | |
| SubSector: Biotechnology | |
| MarketCap: 289.585 Millions | |
| Recent Price: 6.85 Market Intelligence Score: 56 | |
| Day Percent Change: 0.88% Day Change: 0.06 | |
| Week Change: -1.58% Year-to-date Change: -6.4% | |
| VRCA Links: Profile News Message Board | |
| Charts:- Daily , Weekly | |
| Add VRCA to Watchlist: View: Get Complete VRCA Trend Analysis ➞ | |
 | SCPH scPharmaceuticals Inc. |
| Sector: Health Care | |
| SubSector: Biotechnology | |
| MarketCap: 136.185 Millions | |
| Recent Price: 4.61 Market Intelligence Score: 32 | |
| Day Percent Change: 0.88% Day Change: 0.04 | |
| Week Change: 1.32% Year-to-date Change: -26.5% | |
| SCPH Links: Profile News Message Board | |
| Charts:- Daily , Weekly | |
| Add SCPH to Watchlist: View: Get Complete SCPH Trend Analysis ➞ | |
 | MORF Morphic Holding, Inc. |
| Sector: Health Care | |
| SubSector: Biotechnology | |
| MarketCap: 484.885 Millions | |
| Recent Price: 28.75 Market Intelligence Score: 42 | |
| Day Percent Change: 0.88% Day Change: 0.25 | |
| Week Change: 2.68% Year-to-date Change: -0.5% | |
| MORF Links: Profile News Message Board | |
| Charts:- Daily , Weekly | |
| Add MORF to Watchlist: View: Get Complete MORF Trend Analysis ➞ | |
 | ZLAB Zai Lab Limited |
| Sector: Health Care | |
| SubSector: Biotechnology | |
| MarketCap: 3970.35 Millions | |
| Recent Price: 15.12 Market Intelligence Score: 49 | |
| Day Percent Change: 0.87% Day Change: 0.13 | |
| Week Change: 7.39% Year-to-date Change: -44.7% | |
| ZLAB Links: Profile News Message Board | |
| Charts:- Daily , Weekly | |
| Add ZLAB to Watchlist: View: Get Complete ZLAB Trend Analysis ➞ | |
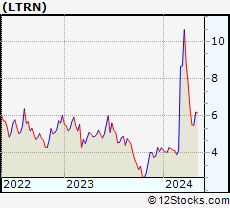 | LTRN Lantern Pharma Inc. |
| Sector: Health Care | |
| SubSector: Biotechnology | |
| MarketCap: 11487 Millions | |
| Recent Price: 5.77 Market Intelligence Score: 43 | |
| Day Percent Change: 0.87% Day Change: 0.05 | |
| Week Change: 4.53% Year-to-date Change: 34.5% | |
| LTRN Links: Profile News Message Board | |
| Charts:- Daily , Weekly | |
| Add LTRN to Watchlist: View: Get Complete LTRN Trend Analysis ➞ | |
 | ANTX AN2 Therapeutics, Inc. |
| Sector: Health Care | |
| SubSector: Biotechnology | |
| MarketCap: 163 Millions | |
| Recent Price: 2.38 Market Intelligence Score: 10 | |
| Day Percent Change: 0.85% Day Change: 0.02 | |
| Week Change: -3.64% Year-to-date Change: -88.4% | |
| ANTX Links: Profile News Message Board | |
| Charts:- Daily , Weekly | |
| Add ANTX to Watchlist: View: Get Complete ANTX Trend Analysis ➞ | |
 | VERA Vera Therapeutics, Inc. |
| Sector: Health Care | |
| SubSector: Biotechnology | |
| MarketCap: 746 Millions | |
| Recent Price: 39.46 Market Intelligence Score: 63 | |
| Day Percent Change: 0.84% Day Change: 0.33 | |
| Week Change: 3.84% Year-to-date Change: 154.9% | |
| VERA Links: Profile News Message Board | |
| Charts:- Daily , Weekly | |
| Add VERA to Watchlist: View: Get Complete VERA Trend Analysis ➞ | |
 | MTNB Matinas BioPharma Holdings, Inc. |
| Sector: Health Care | |
| SubSector: Biotechnology | |
| MarketCap: 147.085 Millions | |
| Recent Price: 0.18 Market Intelligence Score: 10 | |
| Day Percent Change: 0.83% Day Change: 0.00 | |
| Week Change: -3.3% Year-to-date Change: -16.1% | |
| MTNB Links: Profile News Message Board | |
| Charts:- Daily , Weekly | |
| Add MTNB to Watchlist: View: Get Complete MTNB Trend Analysis ➞ | |
 | AVRO AVROBIO, Inc. |
| Sector: Health Care | |
| SubSector: Biotechnology | |
| MarketCap: 626.185 Millions | |
| Recent Price: 1.21 Market Intelligence Score: 0 | |
| Day Percent Change: 0.83% Day Change: 0.01 | |
| Week Change: 0.41% Year-to-date Change: -11.0% | |
| AVRO Links: Profile News Message Board | |
| Charts:- Daily , Weekly | |
| Add AVRO to Watchlist: View: Get Complete AVRO Trend Analysis ➞ | |
 | LEGN Legend Biotech Corporation |
| Sector: Health Care | |
| SubSector: Biotechnology | |
| MarketCap: 37387 Millions | |
| Recent Price: 47.45 Market Intelligence Score: 25 | |
| Day Percent Change: 0.83% Day Change: 0.39 | |
| Week Change: 1.37% Year-to-date Change: -21.3% | |
| LEGN Links: Profile News Message Board | |
| Charts:- Daily , Weekly | |
| Add LEGN to Watchlist: View: Get Complete LEGN Trend Analysis ➞ | |
 | REGN Regeneron Pharmaceuticals, Inc. |
| Sector: Health Care | |
| SubSector: Biotechnology | |
| MarketCap: 51903.7 Millions | |
| Recent Price: 907.32 Market Intelligence Score: 32 | |
| Day Percent Change: 0.80% Day Change: 7.16 | |
| Week Change: 1.17% Year-to-date Change: 3.3% | |
| REGN Links: Profile News Message Board | |
| Charts:- Daily , Weekly | |
| Add REGN to Watchlist: View: Get Complete REGN Trend Analysis ➞ | |
 | ALKS Alkermes plc |
| Sector: Health Care | |
| SubSector: Biotechnology | |
| MarketCap: 2311.95 Millions | |
| Recent Price: 24.26 Market Intelligence Score: 32 | |
| Day Percent Change: 0.79% Day Change: 0.19 | |
| Week Change: 1.72% Year-to-date Change: -12.6% | |
| ALKS Links: Profile News Message Board | |
| Charts:- Daily , Weekly | |
| Add ALKS to Watchlist: View: Get Complete ALKS Trend Analysis ➞ | |
 | ANIP ANI Pharmaceuticals, Inc. |
| Sector: Health Care | |
| SubSector: Biotechnology | |
| MarketCap: 489.285 Millions | |
| Recent Price: 66.14 Market Intelligence Score: 58 | |
| Day Percent Change: 0.79% Day Change: 0.52 | |
| Week Change: 1.01% Year-to-date Change: 20.0% | |
| ANIP Links: Profile News Message Board | |
| Charts:- Daily , Weekly | |
| Add ANIP to Watchlist: View: Get Complete ANIP Trend Analysis ➞ | |
 | AUPH Aurinia Pharmaceuticals Inc. |
| Sector: Health Care | |
| SubSector: Biotechnology | |
| MarketCap: 1319.75 Millions | |
| Recent Price: 5.09 Market Intelligence Score: 50 | |
| Day Percent Change: 0.79% Day Change: 0.04 | |
| Week Change: 2% Year-to-date Change: -43.4% | |
| AUPH Links: Profile News Message Board | |
| Charts:- Daily , Weekly | |
| Add AUPH to Watchlist: View: Get Complete AUPH Trend Analysis ➞ | |
 | JAZZ Jazz Pharmaceuticals plc |
| Sector: Health Care | |
| SubSector: Biotechnology | |
| MarketCap: 5576.05 Millions | |
| Recent Price: 109.67 Market Intelligence Score: 18 | |
| Day Percent Change: 0.77% Day Change: 0.84 | |
| Week Change: -0.25% Year-to-date Change: -10.8% | |
| JAZZ Links: Profile News Message Board | |
| Charts:- Daily , Weekly | |
| Add JAZZ to Watchlist: View: Get Complete JAZZ Trend Analysis ➞ | |
 | DNLI Denali Therapeutics Inc. |
| Sector: Health Care | |
| SubSector: Biotechnology | |
| MarketCap: 2020.05 Millions | |
| Recent Price: 16.11 Market Intelligence Score: 30 | |
| Day Percent Change: 0.75% Day Change: 0.12 | |
| Week Change: 0.81% Year-to-date Change: -24.9% | |
| DNLI Links: Profile News Message Board | |
| Charts:- Daily , Weekly | |
| Add DNLI to Watchlist: View: Get Complete DNLI Trend Analysis ➞ | |
 | AKBA Akebia Therapeutics, Inc. |
| Sector: Health Care | |
| SubSector: Biotechnology | |
| MarketCap: 794.285 Millions | |
| Recent Price: 1.37 Market Intelligence Score: 17 | |
| Day Percent Change: 0.74% Day Change: 0.01 | |
| Week Change: 0.74% Year-to-date Change: 10.5% | |
| AKBA Links: Profile News Message Board | |
| Charts:- Daily , Weekly | |
| Add AKBA to Watchlist: View: Get Complete AKBA Trend Analysis ➞ | |
 | UBX Unity Biotechnology, Inc. |
| Sector: Health Care | |
| SubSector: Biotechnology | |
| MarketCap: 254.985 Millions | |
| Recent Price: 1.49 Market Intelligence Score: 10 | |
| Day Percent Change: 0.68% Day Change: 0.01 | |
| Week Change: -0.67% Year-to-date Change: -22.8% | |
| UBX Links: Profile News Message Board | |
| Charts:- Daily , Weekly | |
| Add UBX to Watchlist: View: Get Complete UBX Trend Analysis ➞ | |
 | HALO Halozyme Therapeutics, Inc. |
| Sector: Health Care | |
| SubSector: Biotechnology | |
| MarketCap: 2383.75 Millions | |
| Recent Price: 38.97 Market Intelligence Score: 75 | |
| Day Percent Change: 0.67% Day Change: 0.26 | |
| Week Change: 0.85% Year-to-date Change: 5.4% | |
| HALO Links: Profile News Message Board | |
| Charts:- Daily , Weekly | |
| Add HALO to Watchlist: View: Get Complete HALO Trend Analysis ➞ | |
 | ABOS Acumen Pharmaceuticals, Inc. |
| Sector: Health Care | |
| SubSector: Biotechnology | |
| MarketCap: 199 Millions | |
| Recent Price: 3.15 Market Intelligence Score: 22 | |
| Day Percent Change: 0.64% Day Change: 0.02 | |
| Week Change: 0% Year-to-date Change: -18.0% | |
| ABOS Links: Profile News Message Board | |
| Charts:- Daily , Weekly | |
| Add ABOS to Watchlist: View: Get Complete ABOS Trend Analysis ➞ | |
 | DCPH Deciphera Pharmaceuticals, Inc. |
| Sector: Health Care | |
| SubSector: Biotechnology | |
| MarketCap: 2329.95 Millions | |
| Recent Price: 14.67 Market Intelligence Score: 63 | |
| Day Percent Change: 0.62% Day Change: 0.09 | |
| Week Change: -0.14% Year-to-date Change: -9.1% | |
| DCPH Links: Profile News Message Board | |
| Charts:- Daily , Weekly | |
| Add DCPH to Watchlist: View: Get Complete DCPH Trend Analysis ➞ | |
 | AMGN Amgen Inc. |
| Sector: Health Care | |
| SubSector: Biotechnology | |
| MarketCap: 121030 Millions | |
| Recent Price: 273.54 Market Intelligence Score: 64 | |
| Day Percent Change: 0.60% Day Change: 1.63 | |
| Week Change: 1.71% Year-to-date Change: -5.0% | |
| AMGN Links: Profile News Message Board | |
| Charts:- Daily , Weekly | |
| Add AMGN to Watchlist: View: Get Complete AMGN Trend Analysis ➞ | |
 | CTMX CytomX Therapeutics, Inc. |
| Sector: Health Care | |
| SubSector: Biotechnology | |
| MarketCap: 264.885 Millions | |
| Recent Price: 1.68 Market Intelligence Score: 36 | |
| Day Percent Change: 0.60% Day Change: 0.01 | |
| Week Change: 0.6% Year-to-date Change: 8.4% | |
| CTMX Links: Profile News Message Board | |
| Charts:- Daily , Weekly | |
| Add CTMX to Watchlist: View: Get Complete CTMX Trend Analysis ➞ | |
 | CCCC C4 Therapeutics, Inc. |
| Sector: Health Care | |
| SubSector: Biotechnology | |
| MarketCap: 12587 Millions | |
| Recent Price: 6.90 Market Intelligence Score: 56 | |
| Day Percent Change: 0.58% Day Change: 0.04 | |
| Week Change: 1.47% Year-to-date Change: 22.3% | |
| CCCC Links: Profile News Message Board | |
| Charts:- Daily , Weekly | |
| Add CCCC to Watchlist: View: Get Complete CCCC Trend Analysis ➞ | |
 | KALV KalVista Pharmaceuticals, Inc. |
| Sector: Health Care | |
| SubSector: Biotechnology | |
| MarketCap: 138.385 Millions | |
| Recent Price: 11.53 Market Intelligence Score: 40 | |
| Day Percent Change: 0.57% Day Change: 0.06 | |
| Week Change: -0.39% Year-to-date Change: -5.9% | |
| KALV Links: Profile News Message Board | |
| Charts:- Daily , Weekly | |
| Add KALV to Watchlist: View: Get Complete KALV Trend Analysis ➞ | |
| To view more stocks, click on Next / Previous arrows or select different range: 0 - 25 , 25 - 50 , 50 - 75 , 75 - 100 , 100 - 125 , 125 - 150 , 150 - 175 , 175 - 200 , 200 - 225 , 225 - 250 , 250 - 275 , 275 - 300 , 300 - 325 , 325 - 350 , 350 - 375 , 375 - 400 | ||
| Click To Change The Sort Order: By Market Cap or Company Size Performance: Year-to-date, Week and Day | |
| Select Chart Type: | ||
|
Best Stocks Today 12Stocks.com |
© 2024 12Stocks.com Terms & Conditions Privacy Contact Us
All Information Provided Only For Education And Not To Be Used For Investing or Trading. See Terms & Conditions


One More Thing ... Get Best Stocks Delivered Daily!
Never Ever Miss A Move With Our Top Ten Stocks Lists
Find Best Stocks In Any Market - Bull or Bear Market
Take A Peek At Our Top Ten Stocks Lists: Daily, Weekly, Year-to-Date & Top Trends
Find Best Stocks In Any Market - Bull or Bear Market
Take A Peek At Our Top Ten Stocks Lists: Daily, Weekly, Year-to-Date & Top Trends
Biotech Stocks With Best Up Trends [0-bearish to 100-bullish]: Pieris [100], PureTech Health[100], Day One[100], Agios [100], Avadel [100], PMV [100], Annovis Bio[100], BioMarin [100], Mesoblast [95], Nektar [95], Moderna [95]
Best Biotech Stocks Year-to-Date:
Pieris [6658.24%], Precision [2702.74%], Inovio [1933.33%], Assembly [1518.1%], Adverum nologies[1435.6%], NuCana [1252.27%], Affimed N.V[700%], Agenus [680.29%], Corbus [524.83%], Mesoblast [445.45%], Janux [364.03%] Best Biotech Stocks This Week:
Pieris [8382.76%], Seres [35.74%], BeyondSpring [27.22%], ProKidney [24.75%], Agenus [21.66%], Annovis Bio[18.8%], Generation Bio[17.69%], Molecular Partners[16.87%], Adaptimmune [16.72%], Longboard [16.23%], Mesoblast [15.16%] Best Biotech Stocks Daily:
Pieris [8318.89%], Seres [21.68%], Generation Bio[16.01%], IGM [14.07%], Adaptimmune [12.87%], Agenus [11.96%], Galectin [10.64%], PureTech Health[10.55%], Personalis [9.52%], Esperion [9.42%], ALX Oncology[8.92%]