
 Login Sign Up


| |||||
 |  | ||||

| 12Stocks.com Market Intelligence |
Best Biotech Stocks
|
|
| Quick Read: Best Biotech Stocks List By Performances & Trends: Daily, Weekly, Year-to-Date, Market Cap (Size) & Technical Trends | |||
| Best Biotech Stocks Views: Quick Browse View, Summary & Slide Show View | |||
| 12Stocks.com Biotech Stocks Performances & Trends Daily | |||||||||
|
|  The overall market intelligence score is 10 (0-bearish to 100-bullish) which puts Biotech sector in short term bearish trend. The market intelligence score from previous trading session is 0 and hence an improvement of trend.
| ||||||||
Here are the market intelligence trend scores of the most requested Biotech stocks at 12Stocks.com (click stock name for detailed review):
|


| 12Stocks.com: Investing in Biotech sector with Stocks | |
|
The following table helps investors and traders sort through current performance and trends (as measured by market intelligence score) of various
stocks in the Biotech sector. Quick View: Move mouse or cursor over stock symbol (ticker) to view short-term Technical chart and over stock name to view long term chart. Click on  to add stock symbol to your watchlist and to add stock symbol to your watchlist and  to view watchlist. Click on any ticker or stock name for detailed market intelligence report for that stock. to view watchlist. Click on any ticker or stock name for detailed market intelligence report for that stock. |
12Stocks.com Performance of Stocks in Biotech Sector
| Ticker | Stock Name | Watchlist | Category | Recent Price | Market Intelligence Score | Change % | YTD Change% |
| HLVX | HilleVax |   | Biotechnology | 12.46 | 0 | -0.80 | -24.37% |
| CRON | Cronos | | Biotechnology | 2.40 | 41 | -0.83 | 14.83% |
| AUTL | Autolus | | Biotechnology | 4.80 | 10 | -0.83 | -25.47% |
| IMAB | I Mab | | Biotechnology | 1.79 | 48 | -0.83 | -5.53% |
| REGN | Regeneron | | Biotechnology | 893.66 | 18 | -0.84 | 1.75% |
| BIIB | Biogen | | Biotechnology | 190.55 | 10 | -0.84 | -26.36% |
| ASND | Ascendis Pharma | | Biotechnology | 140.98 | 31 | -0.84 | 11.93% |
| RYTM | Rhythm | | Biotechnology | 38.11 | 10 | -0.88 | -17.10% |
| EDIT | Editas Medicine | | Biotechnology | 5.56 | 10 | -0.89 | -45.11% |
| ANIK | Anika | | Biotechnology | 25.46 | 76 | -0.90 | 12.36% |
| TARA | ArTara | | Biotechnology | 2.71 | 36 | -0.92 | 44.26% |
| NTLA | Intellia | | Biotechnology | 21.30 | 20 | -0.93 | -30.14% |
| YMAB | Y-mAbs | | Biotechnology | 14.97 | 48 | -0.93 | 119.50% |
| ALKS | Alkermes | | Biotechnology | 23.78 | 10 | -0.96 | -14.28% |
| FDMT | 4D Molecular | | Biotechnology | 25.05 | 36 | -0.99 | 21.01% |
| RCKT | Rocket | | Biotechnology | 23.44 | 10 | -1.01 | -21.79% |
| NKTX | Nkarta | | Biotechnology | 7.78 | 15 | -1.02 | 17.97% |
| MTNB | Matinas BioPharma | | Biotechnology | 0.19 | 0 | -1.04 | -12.12% |
| CGEN | Compugen | | Biotechnology | 1.88 | 10 | -1.05 | -5.05% |
| STRO | Sutro Biopharma | | Biotechnology | 3.76 | 10 | -1.05 | -12.35% |
| MIRM | Mirum | | Biotechnology | 23.60 | 10 | -1.05 | -20.05% |
| APLS | Apellis | | Biotechnology | 47.51 | 10 | -1.08 | -20.63% |
| SRPT | Sarepta | | Biotechnology | 116.59 | 41 | -1.10 | 20.91% |
| GLPG | Galapagos NV | | Biotechnology | 28.90 | 10 | -1.10 | -28.91% |
| FENC | Fennec | | Biotechnology | 9.59 | 0 | -1.13 | -14.53% |
| To view more stocks, click on Next / Previous arrows or select different range: 0 - 25 , 25 - 50 , 50 - 75 , 75 - 100 , 100 - 125 , 125 - 150 , 150 - 175 , 175 - 200 , 200 - 225 , 225 - 250 , 250 - 275 , 275 - 300 , 300 - 325 , 325 - 350 , 350 - 375 , 375 - 400 | ||
 | Click To Change The Sort Order: By Market Cap or Company Size Performance: Year-to-date, Week and Day |  |
|
Get the most comprehensive stock market coverage daily at 12Stocks.com ➞ Best Stocks Today ➞ Best Stocks Weekly ➞ Best Stocks Year-to-Date ➞ Best Stocks Trends ➞  Best Stocks Today 12Stocks.com Best Nasdaq Stocks ➞ Best S&P 500 Stocks ➞ Best Tech Stocks ➞ Best Biotech Stocks ➞ |
| Detailed Overview of Biotech Stocks |
| Biotech Technical Overview, Leaders & Laggards, Top Biotech ETF Funds & Detailed Biotech Stocks List, Charts, Trends & More |
| Biotech Sector: Technical Analysis, Trends & YTD Performance | |
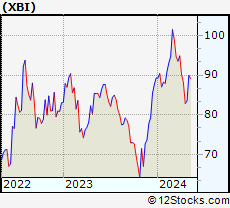
| Biotech sector, as represented by XBI, an exchange-traded fund [ETF] that holds basket of Biotech stocks (e.g, Amgen, Celgene) is down by -6.51% and is currently underperforming the overall market by -10.7% year-to-date. Below is a quick view of Technical charts and trends: | |
 XBI Weekly Chart |
|
| Long Term Trend: Not Good | |
| Medium Term Trend: Not Good | |
 XBI Daily Chart |
|
| Short Term Trend: Deteriorating | |
| Overall Trend Score: 10 | |
| YTD Performance: -6.51% | |
| **Trend Scores & Views Are Only For Educational Purposes And Not For Investing | |
| 12Stocks.com: Top Performing Biotech Sector Stocks | ||||||||||||||||||||||||||||||||||||||||||||||||
 The top performing Biotech sector stocks year to date are
Now, more recently, over last week, the top performing Biotech sector stocks on the move are


|
||||||||||||||||||||||||||||||||||||||||||||||||
| 12Stocks.com: Investing in Biotech Sector using Exchange Traded Funds | |
|
The following table shows list of key exchange traded funds (ETF) that
help investors track Biotech Index. For detailed view, check out our ETF Funds section of our website. Quick View: Move mouse or cursor over ETF symbol (ticker) to view short-term Technical chart and over ETF name to view long term chart. Click on ticker or stock name for detailed view. Click on to add stock symbol to your watchlist and to view watchlist. |
12Stocks.com List of ETFs that track Biotech Index
| Ticker | ETF Name | Watchlist | Recent Price | Market Intelligence Score | Change % | Week % | Year-to-date % |
| LABD | Biotech Bear 3X | | 10.52 | 82 | 4.37 | 17.15 | 8.57% |
| XBI | Biotech | | 83.48 | 10 | -1.38 | -5.3 | -6.51% |
| LABU | Biotech Bull 3X | | 88.04 | 10 | -4.33 | -15.63 | -27.82% |
| IBB | Biotechnology | | 124.65 | 0 | -0.98 | -3.8 | -8.24% |
| IYH | Healthcare | | 58.05 | 10 | -0.02 | -0.6 | 1.4% |
| IXJ | Global Healthcare | | 87.41 | 18 | -0.26 | -0.65 | 0.8% |
| BTEC | Principal Healthcare Innovators | | 34.41 | 10 | -0.58 | -4.39 | -5.28% |
| IHF | Healthcare Providers | | 51.53 | 45 | 0.90 | 1.96 | -1.87% |
| CURE | Healthcare Bull 3X | | 102.23 | 18 | -0.42 | -1.12 | 0.48% |
| FBT | First NYSE | | 141.72 | 10 | -1.38 | -3.8 | -10.33% |
| BIB | Biotechnology | | 48.23 | 0 | -1.44 | -6.16 | -15.47% |
| BIS | Short Biotech | | 20.57 | 95 | 0.24 | 4.95 | 13.84% |
| PTH | DWA Healthcare Momentum | | 40.51 | 46 | 0.15 | -3.16 | 3.5% |
| PBE | Biotech & Genome | | 60.17 | 18 | -0.85 | -1.76 | -8.61% |
| BBH | Biotech | | 152.32 | 10 | -0.45 | -3.34 | -7.86% |
| BBP | Bio Biotechnology Products | | 50.60 | 18 | -2.76 | -4.7 | -12.9% |
| BBC | Bio Biotechnology Clinical | | 25.48 | 36 | -1.32 | -6.06 | 4.2% |
| 12Stocks.com: Charts, Trends, Fundamental Data and Performances of Biotech Stocks | |
|
We now take in-depth look at all Biotech stocks including charts, multi-period performances and overall trends (as measured by market intelligence score). One can sort Biotech stocks (click link to choose) by Daily, Weekly and by Year-to-Date performances. Also, one can sort by size of the company or by market capitalization. |
| Select Your Default Chart Type: | |||||
| |||||
| Click on stock symbol or name for detailed view. Click on to add stock symbol to your watchlist and to view watchlist. Quick View: Move mouse or cursor over "Daily" to quickly view daily Technical stock chart and over "Weekly" to view weekly Technical stock chart. | |||||

 | HLVX HilleVax, Inc. |
| Sector: Health Care | |
| SubSector: Biotechnology | |
| MarketCap: 680 Millions | |
| Recent Price: 12.46 Market Intelligence Score: 0 | |
| Day Percent Change: -0.80% Day Change: -0.10 | |
| Week Change: -17.13% Year-to-date Change: -24.4% | |
| HLVX Links: Profile News Message Board | |
| Charts:- Daily , Weekly | |
| Add HLVX to Watchlist: View: Get Complete HLVX Trend Analysis ➞ | |
 | CRON Cronos Group Inc. |
| Sector: Health Care | |
| SubSector: Biotechnology | |
| MarketCap: 1935.95 Millions | |
| Recent Price: 2.40 Market Intelligence Score: 41 | |
| Day Percent Change: -0.83% Day Change: -0.02 | |
| Week Change: -5.51% Year-to-date Change: 14.8% | |
| CRON Links: Profile News Message Board | |
| Charts:- Daily , Weekly | |
| Add CRON to Watchlist: View: Get Complete CRON Trend Analysis ➞ | |
 | AUTL Autolus Therapeutics plc |
| Sector: Health Care | |
| SubSector: Biotechnology | |
| MarketCap: 296.285 Millions | |
| Recent Price: 4.80 Market Intelligence Score: 10 | |
| Day Percent Change: -0.83% Day Change: -0.04 | |
| Week Change: -4.38% Year-to-date Change: -25.5% | |
| AUTL Links: Profile News Message Board | |
| Charts:- Daily , Weekly | |
| Add AUTL to Watchlist: View: Get Complete AUTL Trend Analysis ➞ | |
 | IMAB I Mab |
| Sector: Health Care | |
| SubSector: Biotechnology | |
| MarketCap: 26187 Millions | |
| Recent Price: 1.79 Market Intelligence Score: 48 | |
| Day Percent Change: -0.83% Day Change: -0.02 | |
| Week Change: -0.83% Year-to-date Change: -5.5% | |
| IMAB Links: Profile News Message Board | |
| Charts:- Daily , Weekly | |
| Add IMAB to Watchlist: View: Get Complete IMAB Trend Analysis ➞ | |
 | REGN Regeneron Pharmaceuticals, Inc. |
| Sector: Health Care | |
| SubSector: Biotechnology | |
| MarketCap: 51903.7 Millions | |
| Recent Price: 893.66 Market Intelligence Score: 18 | |
| Day Percent Change: -0.84% Day Change: -7.53 | |
| Week Change: -1.22% Year-to-date Change: 1.8% | |
| REGN Links: Profile News Message Board | |
| Charts:- Daily , Weekly | |
| Add REGN to Watchlist: View: Get Complete REGN Trend Analysis ➞ | |
 | BIIB Biogen Inc. |
| Sector: Health Care | |
| SubSector: Biotechnology | |
| MarketCap: 53102.6 Millions | |
| Recent Price: 190.55 Market Intelligence Score: 10 | |
| Day Percent Change: -0.84% Day Change: -1.61 | |
| Week Change: -3.85% Year-to-date Change: -26.4% | |
| BIIB Links: Profile News Message Board | |
| Charts:- Daily , Weekly | |
| Add BIIB to Watchlist: View: Get Complete BIIB Trend Analysis ➞ | |
 | ASND Ascendis Pharma A/S |
| Sector: Health Care | |
| SubSector: Biotechnology | |
| MarketCap: 5470.35 Millions | |
| Recent Price: 140.98 Market Intelligence Score: 31 | |
| Day Percent Change: -0.84% Day Change: -1.19 | |
| Week Change: -3.46% Year-to-date Change: 11.9% | |
| ASND Links: Profile News Message Board | |
| Charts:- Daily , Weekly | |
| Add ASND to Watchlist: View: Get Complete ASND Trend Analysis ➞ | |
 | RYTM Rhythm Pharmaceuticals, Inc. |
| Sector: Health Care | |
| SubSector: Biotechnology | |
| MarketCap: 643.685 Millions | |
| Recent Price: 38.11 Market Intelligence Score: 10 | |
| Day Percent Change: -0.88% Day Change: -0.34 | |
| Week Change: -5.5% Year-to-date Change: -17.1% | |
| RYTM Links: Profile News Message Board | |
| Charts:- Daily , Weekly | |
| Add RYTM to Watchlist: View: Get Complete RYTM Trend Analysis ➞ | |
 | EDIT Editas Medicine, Inc. |
| Sector: Health Care | |
| SubSector: Biotechnology | |
| MarketCap: 1194.95 Millions | |
| Recent Price: 5.56 Market Intelligence Score: 10 | |
| Day Percent Change: -0.89% Day Change: -0.05 | |
| Week Change: -10.47% Year-to-date Change: -45.1% | |
| EDIT Links: Profile News Message Board | |
| Charts:- Daily , Weekly | |
| Add EDIT to Watchlist: View: Get Complete EDIT Trend Analysis ➞ | |
 | ANIK Anika Therapeutics, Inc. |
| Sector: Health Care | |
| SubSector: Biotechnology | |
| MarketCap: 438.385 Millions | |
| Recent Price: 25.46 Market Intelligence Score: 76 | |
| Day Percent Change: -0.90% Day Change: -0.23 | |
| Week Change: 1.84% Year-to-date Change: 12.4% | |
| ANIK Links: Profile News Message Board | |
| Charts:- Daily , Weekly | |
| Add ANIK to Watchlist: View: Get Complete ANIK Trend Analysis ➞ | |
 | TARA ArTara Therapeutics, Inc. |
| Sector: Health Care | |
| SubSector: Biotechnology | |
| MarketCap: 140.685 Millions | |
| Recent Price: 2.71 Market Intelligence Score: 36 | |
| Day Percent Change: -0.92% Day Change: -0.02 | |
| Week Change: -9.83% Year-to-date Change: 44.3% | |
| TARA Links: Profile News Message Board | |
| Charts:- Daily , Weekly | |
| Add TARA to Watchlist: View: Get Complete TARA Trend Analysis ➞ | |
 | NTLA Intellia Therapeutics, Inc. |
| Sector: Health Care | |
| SubSector: Biotechnology | |
| MarketCap: 707.185 Millions | |
| Recent Price: 21.30 Market Intelligence Score: 20 | |
| Day Percent Change: -0.93% Day Change: -0.20 | |
| Week Change: -12.24% Year-to-date Change: -30.1% | |
| NTLA Links: Profile News Message Board | |
| Charts:- Daily , Weekly | |
| Add NTLA to Watchlist: View: Get Complete NTLA Trend Analysis ➞ | |
 | YMAB Y-mAbs Therapeutics, Inc. |
| Sector: Health Care | |
| SubSector: Biotechnology | |
| MarketCap: 899.585 Millions | |
| Recent Price: 14.97 Market Intelligence Score: 48 | |
| Day Percent Change: -0.93% Day Change: -0.14 | |
| Week Change: 4.18% Year-to-date Change: 119.5% | |
| YMAB Links: Profile News Message Board | |
| Charts:- Daily , Weekly | |
| Add YMAB to Watchlist: View: Get Complete YMAB Trend Analysis ➞ | |
 | ALKS Alkermes plc |
| Sector: Health Care | |
| SubSector: Biotechnology | |
| MarketCap: 2311.95 Millions | |
| Recent Price: 23.78 Market Intelligence Score: 10 | |
| Day Percent Change: -0.96% Day Change: -0.23 | |
| Week Change: -2.62% Year-to-date Change: -14.3% | |
| ALKS Links: Profile News Message Board | |
| Charts:- Daily , Weekly | |
| Add ALKS to Watchlist: View: Get Complete ALKS Trend Analysis ➞ | |
 | FDMT 4D Molecular Therapeutics, Inc. |
| Sector: Health Care | |
| SubSector: Biotechnology | |
| MarketCap: 772 Millions | |
| Recent Price: 25.05 Market Intelligence Score: 36 | |
| Day Percent Change: -0.99% Day Change: -0.25 | |
| Week Change: -9.57% Year-to-date Change: 21.0% | |
| FDMT Links: Profile News Message Board | |
| Charts:- Daily , Weekly | |
| Add FDMT to Watchlist: View: Get Complete FDMT Trend Analysis ➞ | |
 | RCKT Rocket Pharmaceuticals, Inc. |
| Sector: Health Care | |
| SubSector: Biotechnology | |
| MarketCap: 899.585 Millions | |
| Recent Price: 23.44 Market Intelligence Score: 10 | |
| Day Percent Change: -1.01% Day Change: -0.24 | |
| Week Change: -3.1% Year-to-date Change: -21.8% | |
| RCKT Links: Profile News Message Board | |
| Charts:- Daily , Weekly | |
| Add RCKT to Watchlist: View: Get Complete RCKT Trend Analysis ➞ | |
 | NKTX Nkarta, Inc. |
| Sector: Health Care | |
| SubSector: Biotechnology | |
| MarketCap: 23487 Millions | |
| Recent Price: 7.78 Market Intelligence Score: 15 | |
| Day Percent Change: -1.02% Day Change: -0.08 | |
| Week Change: -10.98% Year-to-date Change: 18.0% | |
| NKTX Links: Profile News Message Board | |
| Charts:- Daily , Weekly | |
| Add NKTX to Watchlist: View: Get Complete NKTX Trend Analysis ➞ | |
 | MTNB Matinas BioPharma Holdings, Inc. |
| Sector: Health Care | |
| SubSector: Biotechnology | |
| MarketCap: 147.085 Millions | |
| Recent Price: 0.19 Market Intelligence Score: 0 | |
| Day Percent Change: -1.04% Day Change: 0.00 | |
| Week Change: -6.5% Year-to-date Change: -12.1% | |
| MTNB Links: Profile News Message Board | |
| Charts:- Daily , Weekly | |
| Add MTNB to Watchlist: View: Get Complete MTNB Trend Analysis ➞ | |
 | CGEN Compugen Ltd. |
| Sector: Health Care | |
| SubSector: Biotechnology | |
| MarketCap: 634.285 Millions | |
| Recent Price: 1.88 Market Intelligence Score: 10 | |
| Day Percent Change: -1.05% Day Change: -0.02 | |
| Week Change: -11.74% Year-to-date Change: -5.1% | |
| CGEN Links: Profile News Message Board | |
| Charts:- Daily , Weekly | |
| Add CGEN to Watchlist: View: Get Complete CGEN Trend Analysis ➞ | |
 | STRO Sutro Biopharma, Inc. |
| Sector: Health Care | |
| SubSector: Biotechnology | |
| MarketCap: 196.485 Millions | |
| Recent Price: 3.76 Market Intelligence Score: 10 | |
| Day Percent Change: -1.05% Day Change: -0.04 | |
| Week Change: -9.18% Year-to-date Change: -12.4% | |
| STRO Links: Profile News Message Board | |
| Charts:- Daily , Weekly | |
| Add STRO to Watchlist: View: Get Complete STRO Trend Analysis ➞ | |
 | MIRM Mirum Pharmaceuticals, Inc. |
| Sector: Health Care | |
| SubSector: Biotechnology | |
| MarketCap: 309.585 Millions | |
| Recent Price: 23.60 Market Intelligence Score: 10 | |
| Day Percent Change: -1.05% Day Change: -0.25 | |
| Week Change: -3.99% Year-to-date Change: -20.1% | |
| MIRM Links: Profile News Message Board | |
| Charts:- Daily , Weekly | |
| Add MIRM to Watchlist: View: Get Complete MIRM Trend Analysis ➞ | |
 | APLS Apellis Pharmaceuticals, Inc. |
| Sector: Health Care | |
| SubSector: Biotechnology | |
| MarketCap: 2030.95 Millions | |
| Recent Price: 47.51 Market Intelligence Score: 10 | |
| Day Percent Change: -1.08% Day Change: -0.52 | |
| Week Change: -8.26% Year-to-date Change: -20.6% | |
| APLS Links: Profile News Message Board | |
| Charts:- Daily , Weekly | |
| Add APLS to Watchlist: View: Get Complete APLS Trend Analysis ➞ | |
 | SRPT Sarepta Therapeutics, Inc. |
| Sector: Health Care | |
| SubSector: Biotechnology | |
| MarketCap: 7388.05 Millions | |
| Recent Price: 116.59 Market Intelligence Score: 41 | |
| Day Percent Change: -1.10% Day Change: -1.30 | |
| Week Change: -5.11% Year-to-date Change: 20.9% | |
| SRPT Links: Profile News Message Board | |
| Charts:- Daily , Weekly | |
| Add SRPT to Watchlist: View: Get Complete SRPT Trend Analysis ➞ | |
 | GLPG Galapagos NV |
| Sector: Health Care | |
| SubSector: Biotechnology | |
| MarketCap: 9541.55 Millions | |
| Recent Price: 28.90 Market Intelligence Score: 10 | |
| Day Percent Change: -1.10% Day Change: -0.32 | |
| Week Change: -4.46% Year-to-date Change: -28.9% | |
| GLPG Links: Profile News Message Board | |
| Charts:- Daily , Weekly | |
| Add GLPG to Watchlist: View: Get Complete GLPG Trend Analysis ➞ | |
 | FENC Fennec Pharmaceuticals Inc. |
| Sector: Health Care | |
| SubSector: Biotechnology | |
| MarketCap: 126.785 Millions | |
| Recent Price: 9.59 Market Intelligence Score: 0 | |
| Day Percent Change: -1.13% Day Change: -0.11 | |
| Week Change: -11.45% Year-to-date Change: -14.5% | |
| FENC Links: Profile News Message Board | |
| Charts:- Daily , Weekly | |
| Add FENC to Watchlist: View: Get Complete FENC Trend Analysis ➞ | |
| To view more stocks, click on Next / Previous arrows or select different range: 0 - 25 , 25 - 50 , 50 - 75 , 75 - 100 , 100 - 125 , 125 - 150 , 150 - 175 , 175 - 200 , 200 - 225 , 225 - 250 , 250 - 275 , 275 - 300 , 300 - 325 , 325 - 350 , 350 - 375 , 375 - 400 | ||
| Click To Change The Sort Order: By Market Cap or Company Size Performance: Year-to-date, Week and Day | |
| Select Chart Type: | ||
|
Best Stocks Today 12Stocks.com |
© 2024 12Stocks.com Terms & Conditions Privacy Contact Us
All Information Provided Only For Education And Not To Be Used For Investing or Trading. See Terms & Conditions


One More Thing ... Get Best Stocks Delivered Daily!
Never Ever Miss A Move With Our Top Ten Stocks Lists
Find Best Stocks In Any Market - Bull or Bear Market
Take A Peek At Our Top Ten Stocks Lists: Daily, Weekly, Year-to-Date & Top Trends
Find Best Stocks In Any Market - Bull or Bear Market
Take A Peek At Our Top Ten Stocks Lists: Daily, Weekly, Year-to-Date & Top Trends
Biotech Stocks With Best Up Trends [0-bearish to 100-bullish]: Cullinan Oncology[100], Geron [100], ALX Oncology[100], Zura Bio[93], NuCana [93], Reneo [93], Avadel [93], Vanda [93], Acrivon [88], Shattuck Labs[88], Galera [88]
Best Biotech Stocks Year-to-Date:
Precision [2850.68%], Inovio [1903.92%], Assembly [1479.08%], Adverum nologies[1361.21%], NuCana [1269.17%], Affimed N.V[733.6%], Corbus [503.73%], Agenus [500.31%], Mesoblast [367.27%], Janux [348.12%], Addex [294.25%] Best Biotech Stocks This Week:
NuCana [1708.84%], ProKidney [32%], ALX Oncology[20.64%], Vanda [20.63%], Galera [16.43%], Cullinan Oncology[13.89%], Rani [13.15%], Humacyte [12.67%], Bicycle [9.91%], Zura Bio[9.52%], Intra-Cellular Therapies[9.3%] Best Biotech Stocks Daily:
Zura Bio[17.20%], Bicycle [12.33%], RedHill Biopharma[11.57%], Vaxxinity [10.05%], Annovis Bio[9.57%], Cullinan Oncology[6.42%], Longboard [6.07%], Addex [5.31%], Ginkgo Bioworks[5.13%], Century [5.13%], Acrivon [5.08%]