
 Login Sign Up


| |||||
 |  | ||||

| 12Stocks.com Market Intelligence |
Stock Charts, Performance & Trend Analysis for SLCA
U.S. Silica Holdings, Inc.
|
| |||||||||||||||||||
 ➞
➞ ➞
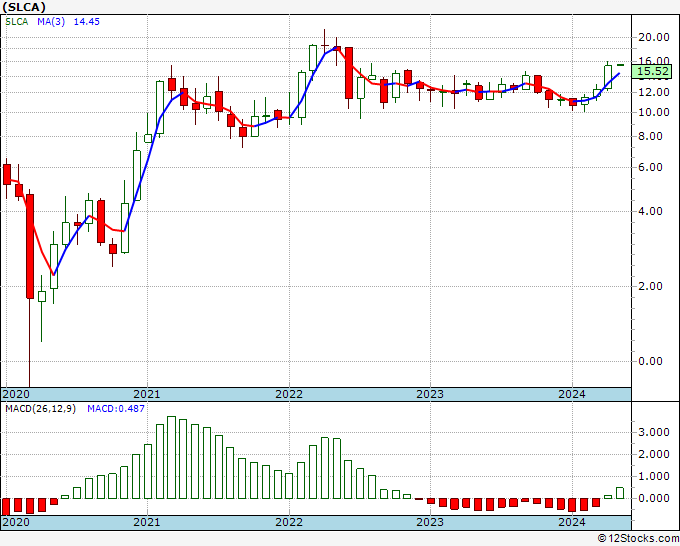
➞September 8, 2025 - The year-to-date (YTD) return or performance of U.S. Silica (SLCA) is up 0% but is underperforming the overall stock market by -11.4834%.
Recently, the weekly return of U.S. Silica (SLCA) is up 0.129282% and is outperforming the overall market by 0.0418093%.
All trends (long term, mid-term and short term) for U.S. Silica Holdings, Inc. looks good.
The overall 12Stocks.com Smart Investing & Trading Score is 30 (measures stock trend from 0-bearish to 100-bullish) which puts SLCA in short term bearish to neutral trend.
The Smart Investing & Trading Score from previous trading session is 30 and an improvement of trend continues. Scroll down for key technical charts, support & resistance levels and analysis for U.S. Silica.
| Stock Analysis for SLCA | |||||||
| Name: U.S. Silica Holdings, Inc. | |||||||
| Sector: Materials | |||||||
| SubSector: Industrial Metals & Minerals | |||||||
| In A Glance U.S. Silica (SLCA) Stock Performance and Technical Trend Chart View | |||||||
| |||||||
Weekly SLCA Technical Chart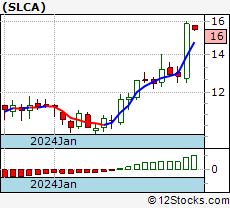 Daily SLCA Technical Chart 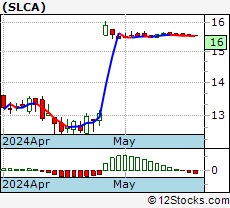 Add SLCA To Watch List View List | |||||||
| 12Stocks.com Short Term Trend Analysis for SLCA | |||||||
| 30 / 100 | |||||||
| The current technical trend score is 30 in a scale where 0 is bearish and 100 is bullish. | |||||||
| The technical trend score from previous session is 30. | |||||||
| Trend score updated daily. Not to be used for investing. | |||||||
Stocks Similar To U.S. Silica
|
|
|
|
Get the most comprehensive stock market coverage daily at 12Stocks.com ➞ Best Stocks Today ➞ Best Stocks Weekly ➞ Best Stocks Year-to-Date ➞ Best Stocks Trends ➞  Best Stocks Today 12Stocks.com Best Nasdaq Stocks ➞ Best S&P 500 Stocks ➞ Best Tech Stocks ➞ Best Biotech Stocks ➞ |
© 2025 12Stocks.com Terms & Conditions Privacy Contact Us
All Information Provided Only For Education And Not To Be Used For Investing or Trading. See Terms & Conditions


One More Thing ... Get Best Stocks Delivered Daily!
Never Ever Miss A Move With Our Top Ten Stocks Lists
Get Best Performing Stocks, Daily Market Trends & Insight
Take A Peek At Our Top Ten Stocks Lists: Daily, Weekly, Year-to-Date & Top Trends
Get Best Performing Stocks, Daily Market Trends & Insight
Take A Peek At Our Top Ten Stocks Lists: Daily, Weekly, Year-to-Date & Top Trends
Dow Stocks With Best Current Trends [0-bearish to 100-bullish]: Unitedhealth [90], Amazon.com Inc[90], Procter & Gamble Co[90], Home Depot[90], Walmart Inc[80], S&P[80], [80], IBM Corp[70], Intel Corp[60], Caterpillar Inc[60] Best S&P 500 Stocks Year-to-Date Update:
Seagate [120.612%], Newmont Corp[99.8283%], Western Digital[96.8598%], CVS Health[67.66%], GE Aerospace[66.5347%], Amphenol Corp[61.199%], Tapestry Inc[59.6251%], NRG Energy[59.4529%], Idexx [58.8896%], Royal Caribbean[57.3681%] Best Nasdaq 100 Stocks Weekly Update:
Splunk [38.7643%], Autodesk Inc[13.7058%], Broadcom Inc[13.1379%], Alphabet Inc[12.0015%], Alphabet Inc[11.7389%], MongoInc [9.82076%], Micron [5.57377%], Take-Two Interactive[4.82759%], Biogen Inc[4.45533%], Dexcom Inc[4.06233%] Today's Stock Market In A Nutshell:Gold [0.9%], China [0.8%], Euro [0.6%], Emerging Markets [0.5%], Bonds [0.5%], Europe [0.4%], US Large Cap [0.2%], Oil [0.2%], India [0.1%], US Small Cap [-0.3%], US Mid Cap [-0.5%], US Dollar [-0.5%],