


On This Page ...
Search
- Material Stocks & etfs (top)
- Current Performance
- Top Performing Materials Stocks
- Investing in Materials Sector with ETFs
- Investing in Materials Sector with Stocks
- Materials Sector Stock List, Charts & More
Explore

For Best Stocks
Search

Best Gold & Materials Stocks & ETFs
| 12Stocks.com: Investing and Trading in Materials Sector | |
|
Best Gold and Commodities Stocks of the Day - The best performers from the last trading session:- Coeur Mining [137.31%], Scotts Miracle-Gro [34.57%], Ecolab [33.49%], Kronos Worldwide [30.20%], Axalta Coating [22.35%], Linde [21.99%], NewMarket [20.86%], Hecla Mining [20.43%], Eastman Chemical [19.77%], H.B. Fuller [15.38%], The top 10 best trending stocks:- Hecla Mining [20.43%], Central Garden [2.74%], NovaGold Resources [2.31%], MP Materials [1.21%], Ivanhoe Electric [0.71%], Warrior Met [0.57%], Cleveland-Cliffs [-16.65%], Coeur Mining [137.31%], Materion [12.72%], Perimeter Solutions [1.69%], |
| 12Stocks.com:Current Chart and Performance of Materials Sector in a Glance | |
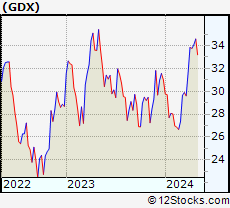 |
GDX : Tracks to perform similar to Amex Gold Miners Index |
| Performance Weekly: -0.93% Daily: 1.38% | |
| Year-to-date Performance : 54.59% | |
| Relative Performance: The materials sector is outperforming the market (S&P 500) by 47.86% | |
 |
Materials sector is composed of stocks
from Metals, Precious Metals (Gold, Silver), Mining
and services subsectors. Materials sector, as represented by XLB, an exchange-traded fund [ETF] that holds basket of materials stocks (e.g, Alcoa, Newmont Mining) is up by 54.59% and is currently outperforming the market (S&P 500) by 47.86%. Year to date, the leading largecap materials stocks are MP Materials [189.17%], Newmont [62.51%], Mosaic [49.66%], NewMarket [38.22%], Corteva [29.51%], Freeport-McMoRan [22.75%], Nucor [22.56%], Reliance Steel [22.51%], Royal Gold [22.06%], Steel Dynamics [18.89%], CF Industries [15.85%] . This guide helps to identify investing opportunities in materials sector. Check daily for updates. Scroll down this guide or just click the links below - |
| MATERIALS | |
| SECTOR | |
| PERFORMANCE | |
|
9.29% (YEAR-TO-DATE) |
|
|
0.16% (WEEKLY) |
|
|
11.41% (DAILY) |
|
| 12Stocks.com: Top Performing Materials Stocks | |
|
|
We try to spot trends by analyzing the performances of various stocks or
components within materials sector and try to find best performing
stocks. The movers and shakers. First, let us look at major subsectors (gold & silver, coal, steel) within Materials sector and look at their performances year to date - GDX [54.59%], SLX [22.1%], . Among larger materials stocks (marketcap > 3 Billion), the top performing stocks year to date are MP Materials [189.17%], Newmont [62.51%], Mosaic [49.66%], NewMarket [38.22%], Corteva [29.51%], Freeport-McMoRan [22.75%], Nucor [22.56%], Reliance Steel [22.51%], Royal Gold [22.06%], Steel Dynamics [18.89%], CF Industries [15.85%] . Now, more recently, over last week, the largecap materials stocks on the move up are - MP Materials [41.68%], Albemarle [5.61%], Westlake Chemical [5.24%], LyondellBasell Industries [4.1%], Dow [3.83%], CF Industries [3.79%], Huntsman [3.42%], Nucor [3.29%], DuPont de [2.4%], Steel Dynamics [1.37%], Freeport-McMoRan [1.22%] . The top performing stocks year to date (YTD) in the midcap and smallcap materials sector are Compass Minerals [99.47%], SSR Mining [81.9%], Coeur Mining [67.66%], Worthington Industries [59.06%], Sensient Technologies [53.28%], NovaGold Resources [44.14%], Ivanhoe Electric [37.62%], Constellium SE [37.39%], i-80 Gold [32.04%], Kaiser Aluminum [28.84%], Hecla Mining [28.81%] . |
| LEADING MATERIALS STOCKS | |
| MP MATERIALS: 189.17% | |
| NEWMONT : 62.51% | |
| MOSAIC : 49.66% | |
| NEWMARKET : 38.22% | |
| CORTEVA : 29.51% | |
| FREEPORT-MCMORAN : 22.75% | |
| NUCOR : 22.56% | |
| RELIANCE STEEL: 22.51% | |
| ROYAL GOLD: 22.06% | |
| STEEL DYNAMICS: 18.89% | |
|
For Complete List of Winners and Laggards from Materials Sector
| |

| 12Stocks.com: Investing in Materials Sector using Exchange Traded Funds | |
|
The following table shows list of key exchange traded funds (ETF)that help investors have diversified
materials portfolio. List of leveraged ETFs thattrack twice or thrice the daily returns of materials indices help traders in making short term movements of materials sector (both up and down). |
12Stocks.com List of ETFs that track Materials Sector
| Ticker | ETF Name | Watchlist | Category | Recent Price | Change % | Week % | Year-to-date % |
| UYM | ProShares Ultra Basic Materials |   | Double | 25.63 | 2.92 | -0.2 | 12.97% |
| XLB | Materials SPDR | | Chemicals | 91.52 | 11.41 | 0.16 | 9.29% |
| SLX | Market Vectors Steel | | Metals | 71.38 | 1.54 | 1.69 | 22.1% |
| GLD | streetTRACKS Gold | | Precious Metals | 309.14 | 1.16 | 0.65 | 27.68% |
| DBA | PowerShares DB Agriculture Fund | | Agricultural | 25.77 | 0.90 | -0.46 | -3.08% |
| AGQ | Ultra Silver | | Double | 55.13 | 6.41 | 11.51 | 63.74% |
| SLV | iShares Silver Trust | | Precious Metals | 35.03 | 3.07 | 4.54 | 33.04% |
| XME | Metals & Mining SPDR | | MINING -NON FERR | 73.13 | 2.41 | 4.37 | 29.02% |
| UGL | Ultra Gold | | Double | 35.74 | 2.21 | 1.62 | -61.77% |
| MOO | Agribusiness ETF | | Agricultural | 74.43 | 1.73 | -1.29 | 15.36% |
| GDX | Gold Miners | | Precious Metals | 52.42 | 1.38 | -0.93 | 54.59% |
| SEA | Shipping ETF | | Materials | 14.35 | 0.00 | 0 | 10.43% |
| ZSL | UltraShort Silver | | Short | 22.01 | -48.33 | -11.18 | -47.6% |
| SMN | ProShares UltraShort Basic Materials | | Short | 13.17 | -2.54 | -0.04 | -20.3% |
| GLL | UltraShort Gold | | Short | 21.60 | -2.26 | -1.59 | 22.87% |
| 12Stocks.com: Investing in Materials using Stocks | |
|
The following table helps investors and traders sort through current performance of various
materials stocks. One can glean long and short term trends by sorting list of materials stocks by performance over daily, weekly or year-to-date periods. |
12Stocks.com Performance of Materials Stocks
| Ticker | Stock Name | Watchlist | Category | Recent Price | Change % | Weekly Change% | YTD Change% |
| SXC | SunCoke Energy, Inc. | | Materials | 8.83 | 2.22 | 1.26 | -16.48% |
| IIIN | Insteel Industries, Inc. | | Materials | 39.60 | 3.45 | 0.94 | 46.78% |
| CENX | Century Aluminum Company | | Materials | 20.71 | 8.05 | 9.87 | 13.67% |
| ODC | Oil-Dri Corporation of America | | Materials | 58.47 | 5.85 | -3.08 | 33.67% |
| NWPX | Northwest Pipe Company | | Materials | 42.12 | 42.20 | -1.54 | -12.72% |
| KOP | Koppers Holdings Inc. | | Materials | 34.03 | 3.82 | 1.01 | 5.31% |
| DC | Dakota Gold Corp. | | Materials | 4.14 | 7.37 | 9.52 | 88.18% |
| GPRE | Green Plains Inc. | | Materials | 8.01 | -57.98 | 14.76 | -15.51% |
 | Showing 75 to 100 Stocks. Click on arrows to view more! Sort by performace by clicking on Daily, Weekly or YTD % Change |  | |||||
| Charts, Fundamental Data and Performances of Stocks | ||
| Click on following links to sort by: Market Cap or Company Size Performance: Year-to-date, Week and Day | |
| To view more stocks click on next and previous arrows | ||
| Select Chart Type: | ||
 | SXC SunCoke Energy, Inc. | ||||||||||||
| Sector: Materials | |||||||||||||
| SubSector: Nonmetallic Mineral Mining | |||||||||||||
| MarketCap: 306.5 Millions | |||||||||||||
| Recent Price: 8.83 | |||||||||||||
| Day Percent Change: SunCoke Energy, Inc.% Day Change: 0.19 | |||||||||||||
| Week Change: 1.26% Year-to-date Change: -16.5% | |||||||||||||
| SXC Links: Profile News Charts:- Daily , Weekly Message Board | |||||||||||||
| Save SXC for Review: New!Add to watchlist View watchlist | |||||||||||||
 | IIIN Insteel Industries, Inc. | ||||||||||||
| Sector: Materials | |||||||||||||
| SubSector: Steel & Iron | |||||||||||||
| MarketCap: 269.488 Millions | |||||||||||||
| Recent Price: 39.60 | |||||||||||||
| Day Percent Change: Insteel Industries, Inc.% Day Change: 1.13 | |||||||||||||
| Week Change: 0.94% Year-to-date Change: 46.8% | |||||||||||||
| IIIN Links: Profile News Charts:- Daily , Weekly Message Board | |||||||||||||
| Save IIIN for Review: New!Add to watchlist View watchlist | |||||||||||||
 | CENX Century Aluminum Company | ||||||||||||
| Sector: Materials | |||||||||||||
| SubSector: Aluminum | |||||||||||||
| MarketCap: 266.408 Millions | |||||||||||||
| Recent Price: 20.71 | |||||||||||||
| Day Percent Change: Century Aluminum Company% Day Change: 1.13 | |||||||||||||
| Week Change: 9.87% Year-to-date Change: 13.7% | |||||||||||||
| CENX Links: Profile News Charts:- Daily , Weekly Message Board | |||||||||||||
| Save CENX for Review: New!Add to watchlist View watchlist | |||||||||||||
 | ODC Oil-Dri Corporation of America | ||||||||||||
| Sector: Materials | |||||||||||||
| SubSector: Specialty Chemicals | |||||||||||||
| MarketCap: 249.857 Millions | |||||||||||||
| Recent Price: 58.47 | |||||||||||||
| Day Percent Change: Oil-Dri Corporation of America% Day Change: 3.82 | |||||||||||||
| Week Change: -3.08% Year-to-date Change: 33.7% | |||||||||||||
| ODC Links: Profile News Charts:- Daily , Weekly Message Board | |||||||||||||
| Save ODC for Review: New!Add to watchlist View watchlist | |||||||||||||
 | NWPX Northwest Pipe Company | ||||||||||||
| Sector: Materials | |||||||||||||
| SubSector: Steel & Iron | |||||||||||||
| MarketCap: 245.788 Millions | |||||||||||||
| Recent Price: 42.12 | |||||||||||||
| Day Percent Change: Northwest Pipe Company% Day Change: 13.58 | |||||||||||||
| Week Change: -1.54% Year-to-date Change: -12.7% | |||||||||||||
| NWPX Links: Profile News Charts:- Daily , Weekly Message Board | |||||||||||||
| Save NWPX for Review: New!Add to watchlist View watchlist | |||||||||||||
 | KOP Koppers Holdings Inc. | ||||||||||||
| Sector: Materials | |||||||||||||
| SubSector: Specialty Chemicals | |||||||||||||
| MarketCap: 232.657 Millions | |||||||||||||
| Recent Price: 34.03 | |||||||||||||
| Day Percent Change: Koppers Holdings Inc.% Day Change: 1.44 | |||||||||||||
| Week Change: 1.01% Year-to-date Change: 5.3% | |||||||||||||
| KOP Links: Profile News Charts:- Daily , Weekly Message Board | |||||||||||||
| Save KOP for Review: New!Add to watchlist View watchlist | |||||||||||||
 | DC Dakota Gold Corp. | ||||||||||||
| Sector: Materials | |||||||||||||
| SubSector: Gold | |||||||||||||
| MarketCap: 218 Millions | |||||||||||||
| Recent Price: 4.14 | |||||||||||||
| Day Percent Change: Dakota Gold Corp.% Day Change: 0.16 | |||||||||||||
| Week Change: 9.52% Year-to-date Change: 88.2% | |||||||||||||
| DC Links: Profile News Charts:- Daily , Weekly Message Board | |||||||||||||
| Save DC for Review: New!Add to watchlist View watchlist | |||||||||||||
 | GPRE Green Plains Inc. | ||||||||||||
| Sector: Materials | |||||||||||||
| SubSector: Specialty Chemicals | |||||||||||||
| MarketCap: 196.357 Millions | |||||||||||||
| Recent Price: 8.01 | |||||||||||||
| Day Percent Change: Green Plains Inc.% Day Change: -19.37 | |||||||||||||
| Week Change: 14.76% Year-to-date Change: -15.5% | |||||||||||||
| GPRE Links: Profile News Charts:- Daily , Weekly Message Board | |||||||||||||
| Save GPRE for Review: New!Add to watchlist View watchlist | |||||||||||||
| To view more stocks, click on Next / Previous arrows or select different range: 0 - 25 , 25 - 50 , 50 - 75 , 75 - 100 | ||
| Click To Change The Sort Order: By Market Cap or Company Size Performance: Year-to-date, Week and Day | |
| Select Chart Type: | ||

|


On This Page - Quick Links
List of Gold & Materials Stocks
 |
|
US Stock Market Performance Year-to-Date: 6% |
 performance (%Change)
| Stock | Price | YTD | Week | Day% |
| LIN | 468.81 | 12.4 | -1.4 | 22.0 |
| ECL | 266.96 | 14.2 | -2.6 | 33.5 |
| APD | 291.97 | 1.9 | 0.0 | 0.7 |
| MP | 45.11 | 189.2 | 41.7 | 1.2 |
| SHW | 345.93 | 2.0 | -2.3 | 0.3 |
| NEM | 60.13 | 62.5 | 0.4 | 1.2 |
| DD | 75.49 | -0.5 | 2.4 | 1.2 |
| DOW | 29.55 | -25.0 | 3.8 | -2.7 |
| PPG | 117.30 | -1.2 | -0.8 | -11.7 |
| CTVA | 73.57 | 29.5 | -4.6 | 2.2 |
| LYB | 64.55 | -11.6 | 4.1 | 2.2 |
| IFF | 75.95 | -9.7 | -0.5 | -0.4 |
| NUE | 142.40 | 22.6 | 3.3 | 1.4 |
| FCX | 46.36 | 22.8 | 1.2 | 3.3 |
| FMC | 42.38 | -11.6 | -4.2 | 2.7 |
| CE | 61.03 | -11.8 | 0.3 | 2.1 |
| AVTR | 13.58 | -35.6 | -2.2 | 2.5 |
| RPM | 113.30 | -7.1 | -0.1 | 1.7 |
| EMN | 80.26 | -11.3 | 0.9 | 19.8 |
| ALB | 70.98 | -17.1 | 5.6 | -53.7 |
| CF | 98.24 | 15.9 | 3.8 | 2.3 |
| RS | 328.48 | 22.5 | 0.5 | 1.1 |
| WLK | 85.36 | -25.2 | 5.2 | 4.8 |
| SMG | 69.31 | 5.6 | 1.1 | 34.6 |
| RGLD | 159.96 | 22.1 | -11.0 | 1.6 |
| NEU | 726.45 | 38.2 | -1.5 | 20.9 |
| STLD | 135.07 | 18.9 | 1.4 | 1.8 |
| MOS | 36.45 | 49.7 | -2.2 | 2.8 |
| AXTA | 30.52 | -10.8 | -1.1 | 22.4 |
| BCPC | 158.44 | -2.8 | -4.0 | 3.0 |
| HUN | 11.49 | -35.3 | 3.4 | 4.6 |
| WDFC | 223.33 | -7.2 | -4.2 | 2.0 |
| ASH | 53.42 | -24.8 | -0.5 | 2.2 |
| KNF | 78.88 | -22.4 | -2.1 | 4.1 |
| NG | 4.80 | 44.1 | 6.2 | 2.3 |
| KWR | 130.04 | -6.8 | 4.7 | -7.1 |
| OLN | 21.88 | -34.8 | -0.2 | 3.8 |
| SXT | 108.63 | 53.3 | 0.7 | 2.4 |
| ESI | 24.68 | -2.7 | 2.8 | 3.1 |
| SCL | 59.02 | -8.2 | -0.4 | -17.8 |
| CMC | 52.11 | 5.8 | -0.6 | 2.7 |
| CC | 13.82 | -16.9 | 6.9 | -47.7 |
| SLVM | 50.99 | -34.6 | -3.8 | 2.3 |
| IOSP | 88.26 | -19.8 | -0.5 | 2.1 |
| FUL | 63.23 | -6.0 | 1.6 | 15.4 |
| SSRM | 12.66 | 81.9 | -4.0 | 5.5 |
| CMP | 22.44 | 99.5 | 0.9 | -1.3 |
| WOR | 63.53 | 59.1 | -2.8 | 3.0 |
| ROCK | 63.71 | 8.2 | 2.3 | 4.3 |
| NGVT | 47.56 | 16.7 | 1.7 | -30.7 |
performance (%Change) End-of-Day Market data as of
© 2014 12Stocks.com Terms & Conditions Privacy Contact Us
All Information Provided Only For Education And Not To Be Used For Investing or Trading. See Terms & Conditions
|
|
Best US Stocks |
|
Top Exchange Traded Funds (ETFs) |
|
Global Markets |
|
Best Sectors |
|
Books & More |