
 Login Sign Up


| |||||
 |  | ||||

| 12Stocks.com Market Intelligence |
Best Tech Stocks
| In a hurry? Tech Stocks Lists: Performance & Trends, Stock Charts, FANG Stocks
Sort Tech stocks: Daily, Weekly, Year-to-Date, Market Cap & Trends. Filter Tech stocks list by size:All Tech Large Mid-Range Small and MicroCap |
| 12Stocks.com Tech Stocks Performances & Trends Daily | |||||||||
|
|  The overall Smart Investing & Trading Score is 0 (0-bearish to 100-bullish) which puts Technology sector in short term bearish trend. The Smart Investing & Trading Score from previous trading session is 21 and hence a deterioration of trend.
| ||||||||
Here are the Smart Investing & Trading Scores of the most requested Technology stocks at 12Stocks.com (click stock name for detailed review):
|


| 12Stocks.com: Investing in Technology sector with Stocks | |
|
The following table helps investors and traders sort through current performance and trends (as measured by Smart Investing & Trading Score) of various
stocks in the Tech sector. Quick View: Move mouse or cursor over stock symbol (ticker) to view short-term technical chart and over stock name to view long term chart. Click on  to add stock symbol to your watchlist and to add stock symbol to your watchlist and  to view watchlist. Click on any ticker or stock name for detailed market intelligence report for that stock. to view watchlist. Click on any ticker or stock name for detailed market intelligence report for that stock. |
12Stocks.com Performance of Stocks in Tech Sector
| Ticker | Stock Name | Watchlist | Category | Recent Price | Smart Investing & Trading Score | Change % | YTD Change% |
| OCFT | OneConnect Financial |   | Software | 2.04 | 64 | 0.49 | -35.24% |
| PCOR | Procore | | Software - | 68.75 | 10 | 0.48 | -1.62% |
| TDOC | Teladoc Health | | Healthcare Information | 12.81 | 15 | 0.47 | -40.56% |
| TDY | Teledyne | | Instruments | 383.03 | 25 | 0.41 | -14.17% |
| PATH | UiPath | | Software - Infrastructure | 19.05 | 27 | 0.40 | -23.38% |
| OKTA | Okta | | Software | 93.34 | 32 | 0.39 | 3.10% |
| INFY | Infosys | | IT | 16.77 | 20 | 0.36 | -8.76% |
| WIMI | WiMi Hologram | | Advertising Agencies | 0.93 | 30 | 0.32 | 15.78% |
| AMX | America Movil | | Wireless | 19.12 | 88 | 0.31 | 3.24% |
| GLW | Corning | | Electronics | 33.48 | 93 | 0.30 | 9.95% |
| SHOP | Shopify | | Software | 70.40 | 18 | 0.28 | -9.63% |
| TEAM | Atlassian | | IT | 172.77 | 7 | 0.27 | -27.36% |
| VERX | Vertex | | Software | 29.21 | 10 | 0.27 | 8.35% |
| HOOD | Robinhood Markets | | Software - Infrastructure | 16.52 | 33 | 0.24 | 30.28% |
| TEF | Telefonica S.A | | Telecom | 4.44 | 63 | 0.23 | 13.85% |
| FTV | Fortive | | Instruments | 75.44 | 18 | 0.23 | 2.46% |
| NFLX | Netflix | | CATV | 551.71 | 17 | 0.19 | 13.32% |
| T | AT&T | | Telecom | 16.92 | 69 | 0.18 | 0.83% |
| VEEV | Veeva Systems | | Healthcare Information | 198.90 | 10 | 0.17 | 3.31% |
| OTEX | Open Text | | Software | 35.35 | 30 | 0.11 | -15.87% |
| RELX | RELX | | IT | 41.23 | 0 | 0.10 | 3.96% |
| WDAY | Workday | | Software | 244.96 | 17 | 0.09 | -11.27% |
| SKM | SK Telecom | | Wireless | 20.44 | 45 | 0.05 | -4.49% |
| FOUR | Shift4 Payments | | Software Infrastructure | 57.89 | 10 | 0.05 | -22.13% |
| BR | Broadridge Financial | | IT | 193.43 | 25 | 0.01 | -5.99% |
| For chart view version of above stock list: Chart View ➞ 0 - 25 , 25 - 50 , 50 - 75 , 75 - 100 , 100 - 125 , 125 - 150 , 150 - 175 , 175 - 200 | ||
 | Click To Change The Sort Order: By Market Cap or Company Size Performance: Year-to-date, Week and Day |  |
|
Get the most comprehensive stock market coverage daily at 12Stocks.com ➞ Best Stocks Today ➞ Best Stocks Weekly ➞ Best Stocks Year-to-Date ➞ Best Stocks Trends ➞  Best Stocks Today 12Stocks.com Best Nasdaq Stocks ➞ Best S&P 500 Stocks ➞ Best Tech Stocks ➞ Best Biotech Stocks ➞ |
| Detailed Overview of Tech Stocks |
| Tech Technical Overview, Leaders & Laggards, Top Tech ETF Funds & Detailed Tech Stocks List, Charts, Trends & More |
| Tech Sector: Technical Analysis, Trends & YTD Performance | |
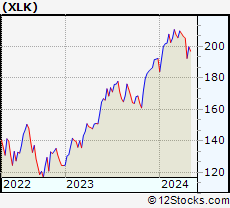
| Technology sector is composed of stocks
from semiconductors, software, web, social media
and services subsectors. Technology sector, as represented by XLK, an exchange-traded fund [ETF] that holds basket of tech stocks (e.g, Intel, Google) is up by 0.92% and is currently underperforming the overall market by -3.62% year-to-date. Below is a quick view of technical charts and trends: |
|
 XLK Weekly Chart |
|
| Long Term Trend: Not Good | |
| Medium Term Trend: Not Good | |
 XLK Daily Chart |
|
| Short Term Trend: Not Good | |
| Overall Trend Score: 0 | |
| YTD Performance: 0.92% | |
| **Trend Scores & Views Are Only For Educational Purposes And Not For Investing | |
| 12Stocks.com: Top Performing Technology Sector Stocks | ||||||||||||||||||||||||||||||||||||||||||||||||
 The top performing Technology sector stocks year to date are
Now, more recently, over last week, the top performing Technology sector stocks on the move are


|
||||||||||||||||||||||||||||||||||||||||||||||||
| 12Stocks.com: Investing in Tech Sector using Exchange Traded Funds | |
|
The following table shows list of key exchange traded funds (ETF) that
help investors track Tech Index. For detailed view, check out our ETF Funds section of our website. Quick View: Move mouse or cursor over ETF symbol (ticker) to view short-term technical chart and over ETF name to view long term chart. Click on ticker or stock name for detailed view. Click on to add stock symbol to your watchlist and to view watchlist. |
12Stocks.com List of ETFs that track Tech Index
| Ticker | ETF Name | Watchlist | Recent Price | Smart Investing & Trading Score | Change % | Week % | Year-to-date % |
| XLK | Technology | | 194.26 | 0 | -1.00 | -2.79 | 0.92% |
| QQQ | QQQ | | 421.52 | 7 | -0.72 | -2.2 | 2.93% |
| IYW | Technology | | 126.95 | 0 | -0.95 | -3.05 | 3.42% |
| VGT | Information Technology | | 489.37 | 7 | -1.08 | -2.89 | 1.11% |
| IXN | Global Tech | | 69.83 | 0 | -0.92 | -2.74 | 2.42% |
| IGV | Tech-Software | | 79.07 | 0 | 0.18 | -2.49 | -2.54% |
| XSD | Semiconductor | | 217.32 | 20 | -3.20 | -3.28 | -3.32% |
| TQQQ | QQQ | | 51.60 | 7 | -2.15 | -6.66 | 1.78% |
| SQQQ | Short QQQ | | 12.22 | 88 | 2.26 | 6.91 | -9.14% |
| SOXL | Semicondct Bull 3X | | 34.37 | 7 | -9.98 | -13.53 | 9.46% |
| SOXS | Semicondct Bear 3X | | 40.23 | 73 | 10.01 | 14.62 | 591.24% |
| SOXX | PHLX Semiconductor | | 206.76 | 7 | -3.38 | -4.67 | 7.67% |
| QTEC | First -100-Tech | | 177.34 | 0 | -1.51 | -3.61 | 1.07% |
| SMH | Semiconductor | | 207.85 | 7 | -2.91 | -4.5 | 18.86% |
| 12Stocks.com: Charts, Trends, Fundamental Data and Performances of Tech Stocks | |
|
We now take in-depth look at all Tech stocks including charts, multi-period performances and overall trends (as measured by Smart Investing & Trading Score). One can sort Tech stocks (click link to choose) by Daily, Weekly and by Year-to-Date performances. Also, one can sort by size of the company or by market capitalization. |
| Select Your Default Chart Type: | |||||
| |||||
| Click on stock symbol or name for detailed view. Click on to add stock symbol to your watchlist and to view watchlist. Quick View: Move mouse or cursor over "Daily" to quickly view daily technical stock chart and over "Weekly" to view weekly technical stock chart. | |||||


 | OCFT OneConnect Financial Technology Co., Ltd. |
| Sector: Technology | |
| SubSector: Software Application | |
| MarketCap: 80387 Millions | |
| Recent Price: 2.04 Smart Investing & Trading Score: 64 | |
| Day Percent Change: 0.49% Day Change: 0.01 | |
| Week Change: 2% Year-to-date Change: -35.2% | |
| OCFT Links: Profile News Message Board | |
| Charts:- Daily , Weekly | |
| Add OCFT to Watchlist: View: Get Complete OCFT Trend Analysis ➞ | |
 | PCOR Procore Technologies, Inc. |
| Sector: Technology | |
| SubSector: Software - Application | |
| MarketCap: 9180 Millions | |
| Recent Price: 68.75 Smart Investing & Trading Score: 10 | |
| Day Percent Change: 0.48% Day Change: 0.33 | |
| Week Change: -1.91% Year-to-date Change: -1.6% | |
| PCOR Links: Profile News Message Board | |
| Charts:- Daily , Weekly | |
| Add PCOR to Watchlist: View: Get Complete PCOR Trend Analysis ➞ | |
 | TDOC Teladoc Health, Inc. |
| Sector: Technology | |
| SubSector: Healthcare Information Services | |
| MarketCap: 11968.5 Millions | |
| Recent Price: 12.81 Smart Investing & Trading Score: 15 | |
| Day Percent Change: 0.47% Day Change: 0.06 | |
| Week Change: -1.54% Year-to-date Change: -40.6% | |
| TDOC Links: Profile News Message Board | |
| Charts:- Daily , Weekly | |
| Add TDOC to Watchlist: View: Get Complete TDOC Trend Analysis ➞ | |
 | TDY Teledyne Technologies Incorporated |
| Sector: Technology | |
| SubSector: Scientific & Technical Instruments | |
| MarketCap: 9360.43 Millions | |
| Recent Price: 383.03 Smart Investing & Trading Score: 25 | |
| Day Percent Change: 0.41% Day Change: 1.55 | |
| Week Change: 2.24% Year-to-date Change: -14.2% | |
| TDY Links: Profile News Message Board | |
| Charts:- Daily , Weekly | |
| Add TDY to Watchlist: View: Get Complete TDY Trend Analysis ➞ | |
 | PATH UiPath Inc. |
| Sector: Technology | |
| SubSector: Software - Infrastructure | |
| MarketCap: 9580 Millions | |
| Recent Price: 19.05 Smart Investing & Trading Score: 27 | |
| Day Percent Change: 0.40% Day Change: 0.08 | |
| Week Change: -2.13% Year-to-date Change: -23.4% | |
| PATH Links: Profile News Message Board | |
| Charts:- Daily , Weekly | |
| Add PATH to Watchlist: View: Get Complete PATH Trend Analysis ➞ | |
 | OKTA Okta, Inc. |
| Sector: Technology | |
| SubSector: Technical & System Software | |
| MarketCap: 15332.9 Millions | |
| Recent Price: 93.34 Smart Investing & Trading Score: 32 | |
| Day Percent Change: 0.39% Day Change: 0.36 | |
| Week Change: 1.14% Year-to-date Change: 3.1% | |
| OKTA Links: Profile News Message Board | |
| Charts:- Daily , Weekly | |
| Add OKTA to Watchlist: View: Get Complete OKTA Trend Analysis ➞ | |
 | INFY Infosys Limited |
| Sector: Technology | |
| SubSector: Information Technology Services | |
| MarketCap: 33819.1 Millions | |
| Recent Price: 16.77 Smart Investing & Trading Score: 20 | |
| Day Percent Change: 0.36% Day Change: 0.06 | |
| Week Change: -1% Year-to-date Change: -8.8% | |
| INFY Links: Profile News Message Board | |
| Charts:- Daily , Weekly | |
| Add INFY to Watchlist: View: Get Complete INFY Trend Analysis ➞ | |
 | WIMI WiMi Hologram Cloud Inc. |
| Sector: Technology | |
| SubSector: Advertising Agencies | |
| MarketCap: 41837 Millions | |
| Recent Price: 0.93 Smart Investing & Trading Score: 30 | |
| Day Percent Change: 0.32% Day Change: 0.00 | |
| Week Change: -8.63% Year-to-date Change: 15.8% | |
| WIMI Links: Profile News Message Board | |
| Charts:- Daily , Weekly | |
| Add WIMI to Watchlist: View: Get Complete WIMI Trend Analysis ➞ | |
 | AMX America Movil, S.A.B. de C.V. |
| Sector: Technology | |
| SubSector: Wireless Communications | |
| MarketCap: 44726.6 Millions | |
| Recent Price: 19.12 Smart Investing & Trading Score: 88 | |
| Day Percent Change: 0.31% Day Change: 0.06 | |
| Week Change: 1.54% Year-to-date Change: 3.2% | |
| AMX Links: Profile News Message Board | |
| Charts:- Daily , Weekly | |
| Add AMX to Watchlist: View: Get Complete AMX Trend Analysis ➞ | |
 | GLW Corning Incorporated |
| Sector: Technology | |
| SubSector: Diversified Electronics | |
| MarketCap: 16287.6 Millions | |
| Recent Price: 33.48 Smart Investing & Trading Score: 93 | |
| Day Percent Change: 0.30% Day Change: 0.10 | |
| Week Change: 6.86% Year-to-date Change: 10.0% | |
| GLW Links: Profile News Message Board | |
| Charts:- Daily , Weekly | |
| Add GLW to Watchlist: View: Get Complete GLW Trend Analysis ➞ | |
 | SHOP Shopify Inc. |
| Sector: Technology | |
| SubSector: Application Software | |
| MarketCap: 45164.2 Millions | |
| Recent Price: 70.40 Smart Investing & Trading Score: 18 | |
| Day Percent Change: 0.28% Day Change: 0.20 | |
| Week Change: -1.3% Year-to-date Change: -9.6% | |
| SHOP Links: Profile News Message Board | |
| Charts:- Daily , Weekly | |
| Add SHOP to Watchlist: View: Get Complete SHOP Trend Analysis ➞ | |
 | TEAM Atlassian Corporation Plc |
| Sector: Technology | |
| SubSector: Information Technology Services | |
| MarketCap: 32265.7 Millions | |
| Recent Price: 172.77 Smart Investing & Trading Score: 7 | |
| Day Percent Change: 0.27% Day Change: 0.47 | |
| Week Change: -3.72% Year-to-date Change: -27.4% | |
| TEAM Links: Profile News Message Board | |
| Charts:- Daily , Weekly | |
| Add TEAM to Watchlist: View: Get Complete TEAM Trend Analysis ➞ | |
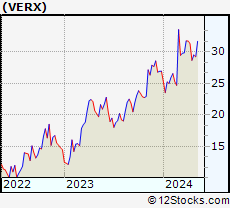 | VERX Vertex, Inc. |
| Sector: Technology | |
| SubSector: Software Application | |
| MarketCap: 39687 Millions | |
| Recent Price: 29.21 Smart Investing & Trading Score: 10 | |
| Day Percent Change: 0.27% Day Change: 0.08 | |
| Week Change: -1.08% Year-to-date Change: 8.4% | |
| VERX Links: Profile News Message Board | |
| Charts:- Daily , Weekly | |
| Add VERX to Watchlist: View: Get Complete VERX Trend Analysis ➞ | |
 | HOOD Robinhood Markets, Inc. |
| Sector: Technology | |
| SubSector: Software - Infrastructure | |
| MarketCap: 9200 Millions | |
| Recent Price: 16.52 Smart Investing & Trading Score: 33 | |
| Day Percent Change: 0.24% Day Change: 0.04 | |
| Week Change: -7.66% Year-to-date Change: 30.3% | |
| HOOD Links: Profile News Message Board | |
| Charts:- Daily , Weekly | |
| Add HOOD to Watchlist: View: Get Complete HOOD Trend Analysis ➞ | |
 | TEF Telefonica, S.A. |
| Sector: Technology | |
| SubSector: Telecom Services - Foreign | |
| MarketCap: 26698.4 Millions | |
| Recent Price: 4.44 Smart Investing & Trading Score: 63 | |
| Day Percent Change: 0.23% Day Change: 0.01 | |
| Week Change: -1.33% Year-to-date Change: 13.9% | |
| TEF Links: Profile News Message Board | |
| Charts:- Daily , Weekly | |
| Add TEF to Watchlist: View: Get Complete TEF Trend Analysis ➞ | |
 | FTV Fortive Corporation |
| Sector: Technology | |
| SubSector: Scientific & Technical Instruments | |
| MarketCap: 16351.9 Millions | |
| Recent Price: 75.44 Smart Investing & Trading Score: 18 | |
| Day Percent Change: 0.23% Day Change: 0.17 | |
| Week Change: -0.7% Year-to-date Change: 2.5% | |
| FTV Links: Profile News Message Board | |
| Charts:- Daily , Weekly | |
| Add FTV to Watchlist: View: Get Complete FTV Trend Analysis ➞ | |
 | NFLX Netflix, Inc. |
| Sector: Technology | |
| SubSector: CATV Systems | |
| MarketCap: 162108 Millions | |
| Recent Price: 551.71 Smart Investing & Trading Score: 17 | |
| Day Percent Change: 0.19% Day Change: 1.07 | |
| Week Change: -1.7% Year-to-date Change: 13.3% | |
| NFLX Links: Profile News Message Board | |
| Charts:- Daily , Weekly | |
| Add NFLX to Watchlist: View: Get Complete NFLX Trend Analysis ➞ | |
 | T AT&T Inc. |
| Sector: Technology | |
| SubSector: Telecom Services - Domestic | |
| MarketCap: 224847 Millions | |
| Recent Price: 16.92 Smart Investing & Trading Score: 69 | |
| Day Percent Change: 0.18% Day Change: 0.03 | |
| Week Change: 1.01% Year-to-date Change: 0.8% | |
| T Links: Profile News Message Board | |
| Charts:- Daily , Weekly | |
| Add T to Watchlist: View: Get Complete T Trend Analysis ➞ | |
 | VEEV Veeva Systems Inc. |
| Sector: Technology | |
| SubSector: Healthcare Information Services | |
| MarketCap: 21492.1 Millions | |
| Recent Price: 198.90 Smart Investing & Trading Score: 10 | |
| Day Percent Change: 0.17% Day Change: 0.34 | |
| Week Change: -1% Year-to-date Change: 3.3% | |
| VEEV Links: Profile News Message Board | |
| Charts:- Daily , Weekly | |
| Add VEEV to Watchlist: View: Get Complete VEEV Trend Analysis ➞ | |
 | OTEX Open Text Corporation |
| Sector: Technology | |
| SubSector: Application Software | |
| MarketCap: 9291.92 Millions | |
| Recent Price: 35.35 Smart Investing & Trading Score: 30 | |
| Day Percent Change: 0.11% Day Change: 0.04 | |
| Week Change: -0.92% Year-to-date Change: -15.9% | |
| OTEX Links: Profile News Message Board | |
| Charts:- Daily , Weekly | |
| Add OTEX to Watchlist: View: Get Complete OTEX Trend Analysis ➞ | |
 | RELX RELX PLC |
| Sector: Technology | |
| SubSector: Information & Delivery Services | |
| MarketCap: 36730.7 Millions | |
| Recent Price: 41.23 Smart Investing & Trading Score: 0 | |
| Day Percent Change: 0.10% Day Change: 0.04 | |
| Week Change: -0.91% Year-to-date Change: 4.0% | |
| RELX Links: Profile News Message Board | |
| Charts:- Daily , Weekly | |
| Add RELX to Watchlist: View: Get Complete RELX Trend Analysis ➞ | |
 | WDAY Workday, Inc. |
| Sector: Technology | |
| SubSector: Application Software | |
| MarketCap: 31372.1 Millions | |
| Recent Price: 244.96 Smart Investing & Trading Score: 17 | |
| Day Percent Change: 0.09% Day Change: 0.23 | |
| Week Change: -2.42% Year-to-date Change: -11.3% | |
| WDAY Links: Profile News Message Board | |
| Charts:- Daily , Weekly | |
| Add WDAY to Watchlist: View: Get Complete WDAY Trend Analysis ➞ | |
 | SKM SK Telecom Co.,Ltd |
| Sector: Technology | |
| SubSector: Wireless Communications | |
| MarketCap: 12332.1 Millions | |
| Recent Price: 20.44 Smart Investing & Trading Score: 45 | |
| Day Percent Change: 0.05% Day Change: 0.01 | |
| Week Change: -0.82% Year-to-date Change: -4.5% | |
| SKM Links: Profile News Message Board | |
| Charts:- Daily , Weekly | |
| Add SKM to Watchlist: View: Get Complete SKM Trend Analysis ➞ | |
 | FOUR Shift4 Payments, Inc. |
| Sector: Technology | |
| SubSector: Software Infrastructure | |
| MarketCap: 49287 Millions | |
| Recent Price: 57.89 Smart Investing & Trading Score: 10 | |
| Day Percent Change: 0.05% Day Change: 0.03 | |
| Week Change: -2% Year-to-date Change: -22.1% | |
| FOUR Links: Profile News Message Board | |
| Charts:- Daily , Weekly | |
| Add FOUR to Watchlist: View: Get Complete FOUR Trend Analysis ➞ | |
 | BR Broadridge Financial Solutions, Inc. |
| Sector: Technology | |
| SubSector: Information Technology Services | |
| MarketCap: 10633.8 Millions | |
| Recent Price: 193.43 Smart Investing & Trading Score: 25 | |
| Day Percent Change: 0.01% Day Change: 0.02 | |
| Week Change: -0.37% Year-to-date Change: -6.0% | |
| BR Links: Profile News Message Board | |
| Charts:- Daily , Weekly | |
| Add BR to Watchlist: View: Get Complete BR Trend Analysis ➞ | |
| For tabular summary view of above stock list: Summary View ➞ 0 - 25 , 25 - 50 , 50 - 75 , 75 - 100 , 100 - 125 , 125 - 150 , 150 - 175 , 175 - 200 | ||
| Click To Change The Sort Order: By Market Cap or Company Size Performance: Year-to-date, Week and Day | |
| Select Chart Type: | ||
|
Best Stocks Today 12Stocks.com |
© 2024 12Stocks.com Terms & Conditions Privacy Contact Us
All Information Provided Only For Education And Not To Be Used For Investing or Trading. See Terms & Conditions


One More Thing ... Get Best Stocks Delivered Daily!
Never Ever Miss A Move With Our Top Ten Stocks Lists
Find Best Stocks In Any Market - Bull or Bear Market
Take A Peek At Our Top Ten Stocks Lists: Daily, Weekly, Year-to-Date & Top Trends
Find Best Stocks In Any Market - Bull or Bear Market
Take A Peek At Our Top Ten Stocks Lists: Daily, Weekly, Year-to-Date & Top Trends
Technology Stocks With Best Up Trends [0-bearish to 100-bullish]: A10 Networks[100], Garmin [100], Conduent [100], Snap [100], Mesa [100], CTS [100], GDS [100], 21Vianet [100], Clearfield [100], Silicom [100], Ouster [100]
Best Technology Stocks Year-to-Date:
MediaCo Holding[439.91%], Bakkt [182.96%], Uxin [178.17%], Smith Micro[176.03%], CXApp [160.23%], Super Micro[159.73%], SoundHound AI[105.14%], NextNav [104.27%], CuriosityStream [101.81%], MediaAlpha [89.39%], Cheetah Mobile[78.07%] Best Technology Stocks This Week:
Bakkt [1478.68%], SYLA [73.71%], MediaCo Holding[32.95%], Koninklijke Philips[27.01%], Mitcham Industries[24.94%], Phoenix New[21.71%], Harmonic [20.54%], Quantum [15.48%], Cogint [15.12%], Viomi [14.26%], Conduent [14.05%] Best Technology Stocks Daily:
SYLA [130.82%], MediaCo Holding[30.68%], A10 Networks[17.69%], Garmin [13.12%], Conduent [10.79%], AMTD Digital[10.64%], Cambium Networks[10.62%], Luna Innovations[8.50%], Arqit Quantum[8.50%], DigitalOcean [8.13%], Endava [7.76%]