
 Login Sign Up


| |||||
 |  | ||||

| 12Stocks.com Market Intelligence |
Best Tech Stocks
| In a hurry? Tech Stocks Lists: Performance & Trends, Stock Charts, FANG Stocks
Sort Tech stocks: Daily, Weekly, Year-to-Date, Market Cap & Trends. Filter Tech stocks list by size:All Tech Large Mid-Range Small and MicroCap |
| 12Stocks.com Tech Stocks Performances & Trends Daily | |||||||||
|
|  The overall Smart Investing & Trading Score is 0 (0-bearish to 100-bullish) which puts Technology sector in short term bearish trend. The Smart Investing & Trading Score from previous trading session is 21 and hence a deterioration of trend.
| ||||||||
Here are the Smart Investing & Trading Scores of the most requested Technology stocks at 12Stocks.com (click stock name for detailed review):
|


| 12Stocks.com: Investing in Technology sector with Stocks | |
|
The following table helps investors and traders sort through current performance and trends (as measured by Smart Investing & Trading Score) of various
stocks in the Tech sector. Quick View: Move mouse or cursor over stock symbol (ticker) to view short-term technical chart and over stock name to view long term chart. Click on  to add stock symbol to your watchlist and to add stock symbol to your watchlist and  to view watchlist. Click on any ticker or stock name for detailed market intelligence report for that stock. to view watchlist. Click on any ticker or stock name for detailed market intelligence report for that stock. |
12Stocks.com Performance of Stocks in Tech Sector
| Ticker | Stock Name | Watchlist | Category | Recent Price | Smart Investing & Trading Score | Change % | YTD Change% |
| ANET | Arista Networks |   | Computer | 255.21 | 17 | -0.53 | 8.36% |
| AAPL | Apple | | Electronic | 169.30 | 17 | -0.60 | -12.07% |
| SAP | SAP SE | | Software | 180.07 | 15 | -0.63 | 16.48% |
| TYL | Tyler | | Software | 458.53 | 71 | -0.65 | 9.66% |
| TXN | Texas | | Semiconductor | 175.20 | 68 | -0.69 | 2.78% |
| VZ | Verizon | | Telecom | 39.20 | 0 | -0.73 | 3.98% |
| SE | Sea | | Software | 62.72 | 64 | -0.74 | 54.86% |
| ACN | Accenture | | IT | 298.66 | 0 | -0.75 | -14.89% |
| MSI | Motorola | | Communication | 336.00 | 26 | -0.93 | 7.32% |
| PAYC | Paycom Software | | Software | 186.24 | 43 | -0.93 | -9.91% |
| IOT | Samsara | | Software - Infrastructure | 34.59 | 45 | -0.96 | 4.30% |
| FROG | JFrog | | Software | 39.48 | 0 | -1.00 | 14.04% |
| ADSK | Autodesk | | Software | 210.71 | 10 | -1.01 | -13.46% |
| ANSS | ANSYS | | Software | 321.48 | 0 | -1.05 | -11.41% |
| QCOM | QUALCOMM | | Communication | 164.11 | 38 | -1.05 | 13.47% |
| FIS | Fidelity National | | IT | 67.20 | 5 | -1.06 | 11.87% |
| IBM | IBM | | IT | 164.43 | 10 | -1.06 | 0.54% |
| LHX | L3Harris | | Communication | 211.75 | 50 | -1.07 | 0.54% |
| SPT | Sprout Social | | Software | 49.91 | 0 | -1.07 | -18.77% |
| SSNC | SS&C | | Software | 61.22 | 7 | -1.08 | 0.18% |
| NOW | ServiceNow | | IT | 685.61 | 0 | -1.11 | -2.96% |
| NICE | NICE | | Computer | 220.94 | 10 | -1.15 | 10.74% |
| NTAP | NetApp | | Data Storage | 100.99 | 51 | -1.19 | 14.55% |
| HPQ | HP | | Computer | 27.75 | 0 | -1.21 | -7.78% |
| PANW | Palo Alto | | Networking | 287.34 | 32 | -1.22 | -2.56% |
| For chart view version of above stock list: Chart View ➞ 0 - 25 , 25 - 50 , 50 - 75 , 75 - 100 , 100 - 125 , 125 - 150 , 150 - 175 , 175 - 200 | ||
 | Click To Change The Sort Order: By Market Cap or Company Size Performance: Year-to-date, Week and Day |  |
|
Get the most comprehensive stock market coverage daily at 12Stocks.com ➞ Best Stocks Today ➞ Best Stocks Weekly ➞ Best Stocks Year-to-Date ➞ Best Stocks Trends ➞  Best Stocks Today 12Stocks.com Best Nasdaq Stocks ➞ Best S&P 500 Stocks ➞ Best Tech Stocks ➞ Best Biotech Stocks ➞ |
| Detailed Overview of Tech Stocks |
| Tech Technical Overview, Leaders & Laggards, Top Tech ETF Funds & Detailed Tech Stocks List, Charts, Trends & More |
| Tech Sector: Technical Analysis, Trends & YTD Performance | |
| Technology sector is composed of stocks
from semiconductors, software, web, social media
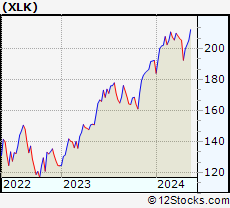
and services subsectors. Technology sector, as represented by XLK, an exchange-traded fund [ETF] that holds basket of tech stocks (e.g, Intel, Google) is up by 0.92% and is currently underperforming the overall market by -3.62% year-to-date. Below is a quick view of technical charts and trends: |
|
 XLK Weekly Chart |
|
| Long Term Trend: Not Good | |
| Medium Term Trend: Not Good | |
 XLK Daily Chart |
|
| Short Term Trend: Not Good | |
| Overall Trend Score: 0 | |
| YTD Performance: 0.92% | |
| **Trend Scores & Views Are Only For Educational Purposes And Not For Investing | |
| 12Stocks.com: Top Performing Technology Sector Stocks | ||||||||||||||||||||||||||||||||||||||||||||||||
 The top performing Technology sector stocks year to date are
Now, more recently, over last week, the top performing Technology sector stocks on the move are


|
||||||||||||||||||||||||||||||||||||||||||||||||
| 12Stocks.com: Investing in Tech Sector using Exchange Traded Funds | |
|
The following table shows list of key exchange traded funds (ETF) that
help investors track Tech Index. For detailed view, check out our ETF Funds section of our website. Quick View: Move mouse or cursor over ETF symbol (ticker) to view short-term technical chart and over ETF name to view long term chart. Click on ticker or stock name for detailed view. Click on to add stock symbol to your watchlist and to view watchlist. |
12Stocks.com List of ETFs that track Tech Index
| Ticker | ETF Name | Watchlist | Recent Price | Smart Investing & Trading Score | Change % | Week % | Year-to-date % |
| XLK | Technology | | 194.26 | 0 | -1.00 | -2.79 | 0.92% |
| QQQ | QQQ | | 421.52 | 7 | -0.72 | -2.2 | 2.93% |
| IYW | Technology | | 126.95 | 0 | -0.95 | -3.05 | 3.42% |
| VGT | Information Technology | | 489.37 | 7 | -1.08 | -2.89 | 1.11% |
| IXN | Global Tech | | 69.83 | 0 | -0.92 | -2.74 | 2.42% |
| IGV | Tech-Software | | 79.07 | 0 | 0.18 | -2.49 | -2.54% |
| XSD | Semiconductor | | 217.32 | 20 | -3.20 | -3.28 | -3.32% |
| TQQQ | QQQ | | 51.60 | 7 | -2.15 | -6.66 | 1.78% |
| SQQQ | Short QQQ | | 12.22 | 88 | 2.26 | 6.91 | -9.14% |
| SOXL | Semicondct Bull 3X | | 34.37 | 7 | -9.98 | -13.53 | 9.46% |
| SOXS | Semicondct Bear 3X | | 40.23 | 73 | 10.01 | 14.62 | 591.24% |
| SOXX | PHLX Semiconductor | | 206.76 | 7 | -3.38 | -4.67 | 7.67% |
| QTEC | First -100-Tech | | 177.34 | 0 | -1.51 | -3.61 | 1.07% |
| SMH | Semiconductor | | 207.85 | 7 | -2.91 | -4.5 | 18.86% |
| 12Stocks.com: Charts, Trends, Fundamental Data and Performances of Tech Stocks | |
|
We now take in-depth look at all Tech stocks including charts, multi-period performances and overall trends (as measured by Smart Investing & Trading Score). One can sort Tech stocks (click link to choose) by Daily, Weekly and by Year-to-Date performances. Also, one can sort by size of the company or by market capitalization. |
| Select Your Default Chart Type: | |||||
| |||||
| Click on stock symbol or name for detailed view. Click on to add stock symbol to your watchlist and to view watchlist. Quick View: Move mouse or cursor over "Daily" to quickly view daily technical stock chart and over "Weekly" to view weekly technical stock chart. | |||||


 | ANET Arista Networks, Inc. |
| Sector: Technology | |
| SubSector: Diversified Computer Systems | |
| MarketCap: 14071.2 Millions | |
| Recent Price: 255.21 Smart Investing & Trading Score: 17 | |
| Day Percent Change: -0.53% Day Change: -1.35 | |
| Week Change: -3.59% Year-to-date Change: 8.4% | |
| ANET Links: Profile News Message Board | |
| Charts:- Daily , Weekly | |
| Add ANET to Watchlist: View: Get Complete ANET Trend Analysis ➞ | |
 | AAPL Apple Inc. |
| Sector: Technology | |
| SubSector: Electronic Equipment | |
| MarketCap: 1112940 Millions | |
| Recent Price: 169.30 Smart Investing & Trading Score: 17 | |
| Day Percent Change: -0.60% Day Change: -1.03 | |
| Week Change: 0% Year-to-date Change: -12.1% | |
| AAPL Links: Profile News Message Board | |
| Charts:- Daily , Weekly | |
| Add AAPL to Watchlist: View: Get Complete AAPL Trend Analysis ➞ | |
 | SAP SAP SE |
| Sector: Technology | |
| SubSector: Application Software | |
| MarketCap: 129635 Millions | |
| Recent Price: 180.07 Smart Investing & Trading Score: 15 | |
| Day Percent Change: -0.63% Day Change: -1.14 | |
| Week Change: -3.28% Year-to-date Change: 16.5% | |
| SAP Links: Profile News Message Board | |
| Charts:- Daily , Weekly | |
| Add SAP to Watchlist: View: Get Complete SAP Trend Analysis ➞ | |
 | TYL Tyler Technologies, Inc. |
| Sector: Technology | |
| SubSector: Technical & System Software | |
| MarketCap: 10785 Millions | |
| Recent Price: 458.53 Smart Investing & Trading Score: 71 | |
| Day Percent Change: -0.65% Day Change: -3.02 | |
| Week Change: -0.48% Year-to-date Change: 9.7% | |
| TYL Links: Profile News Message Board | |
| Charts:- Daily , Weekly | |
| Add TYL to Watchlist: View: Get Complete TYL Trend Analysis ➞ | |
 | TXN Texas Instruments Incorporated |
| Sector: Technology | |
| SubSector: Semiconductor - Broad Line | |
| MarketCap: 99509.1 Millions | |
| Recent Price: 175.20 Smart Investing & Trading Score: 68 | |
| Day Percent Change: -0.69% Day Change: -1.22 | |
| Week Change: -1.28% Year-to-date Change: 2.8% | |
| TXN Links: Profile News Message Board | |
| Charts:- Daily , Weekly | |
| Add TXN to Watchlist: View: Get Complete TXN Trend Analysis ➞ | |
 | VZ Verizon Communications Inc. |
| Sector: Technology | |
| SubSector: Telecom Services - Domestic | |
| MarketCap: 229427 Millions | |
| Recent Price: 39.20 Smart Investing & Trading Score: 0 | |
| Day Percent Change: -0.73% Day Change: -0.29 | |
| Week Change: -1.21% Year-to-date Change: 4.0% | |
| VZ Links: Profile News Message Board | |
| Charts:- Daily , Weekly | |
| Add VZ to Watchlist: View: Get Complete VZ Trend Analysis ➞ | |
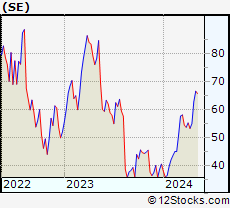 | SE Sea Limited |
| Sector: Technology | |
| SubSector: Multimedia & Graphics Software | |
| MarketCap: 20305.5 Millions | |
| Recent Price: 62.72 Smart Investing & Trading Score: 64 | |
| Day Percent Change: -0.74% Day Change: -0.47 | |
| Week Change: -0.22% Year-to-date Change: 54.9% | |
| SE Links: Profile News Message Board | |
| Charts:- Daily , Weekly | |
| Add SE to Watchlist: View: Get Complete SE Trend Analysis ➞ | |
 | ACN Accenture plc |
| Sector: Technology | |
| SubSector: Information Technology Services | |
| MarketCap: 106627 Millions | |
| Recent Price: 298.66 Smart Investing & Trading Score: 0 | |
| Day Percent Change: -0.75% Day Change: -2.25 | |
| Week Change: -3.04% Year-to-date Change: -14.9% | |
| ACN Links: Profile News Message Board | |
| Charts:- Daily , Weekly | |
| Add ACN to Watchlist: View: Get Complete ACN Trend Analysis ➞ | |
 | MSI Motorola Solutions, Inc. |
| Sector: Technology | |
| SubSector: Communication Equipment | |
| MarketCap: 26573.3 Millions | |
| Recent Price: 336.00 Smart Investing & Trading Score: 26 | |
| Day Percent Change: -0.93% Day Change: -3.15 | |
| Week Change: -3.02% Year-to-date Change: 7.3% | |
| MSI Links: Profile News Message Board | |
| Charts:- Daily , Weekly | |
| Add MSI to Watchlist: View: Get Complete MSI Trend Analysis ➞ | |
 | PAYC Paycom Software, Inc. |
| Sector: Technology | |
| SubSector: Application Software | |
| MarketCap: 13041.6 Millions | |
| Recent Price: 186.24 Smart Investing & Trading Score: 43 | |
| Day Percent Change: -0.93% Day Change: -1.74 | |
| Week Change: -1.4% Year-to-date Change: -9.9% | |
| PAYC Links: Profile News Message Board | |
| Charts:- Daily , Weekly | |
| Add PAYC to Watchlist: View: Get Complete PAYC Trend Analysis ➞ | |
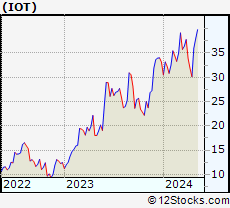 | IOT Samsara Inc. |
| Sector: Technology | |
| SubSector: Software - Infrastructure | |
| MarketCap: 14320 Millions | |
| Recent Price: 34.59 Smart Investing & Trading Score: 45 | |
| Day Percent Change: -0.96% Day Change: -0.34 | |
| Week Change: -3.88% Year-to-date Change: 4.3% | |
| IOT Links: Profile News Message Board | |
| Charts:- Daily , Weekly | |
| Add IOT to Watchlist: View: Get Complete IOT Trend Analysis ➞ | |
 | FROG JFrog Ltd. |
| Sector: Technology | |
| SubSector: Software Application | |
| MarketCap: 62287 Millions | |
| Recent Price: 39.48 Smart Investing & Trading Score: 0 | |
| Day Percent Change: -1.00% Day Change: -0.40 | |
| Week Change: -5.98% Year-to-date Change: 14.0% | |
| FROG Links: Profile News Message Board | |
| Charts:- Daily , Weekly | |
| Add FROG to Watchlist: View: Get Complete FROG Trend Analysis ➞ | |
 | ADSK Autodesk, Inc. |
| Sector: Technology | |
| SubSector: Technical & System Software | |
| MarketCap: 36975.8 Millions | |
| Recent Price: 210.71 Smart Investing & Trading Score: 10 | |
| Day Percent Change: -1.01% Day Change: -2.14 | |
| Week Change: -3.31% Year-to-date Change: -13.5% | |
| ADSK Links: Profile News Message Board | |
| Charts:- Daily , Weekly | |
| Add ADSK to Watchlist: View: Get Complete ADSK Trend Analysis ➞ | |
 | ANSS ANSYS, Inc. |
| Sector: Technology | |
| SubSector: Application Software | |
| MarketCap: 19497.4 Millions | |
| Recent Price: 321.48 Smart Investing & Trading Score: 0 | |
| Day Percent Change: -1.05% Day Change: -3.40 | |
| Week Change: -3.68% Year-to-date Change: -11.4% | |
| ANSS Links: Profile News Message Board | |
| Charts:- Daily , Weekly | |
| Add ANSS to Watchlist: View: Get Complete ANSS Trend Analysis ➞ | |
 | QCOM QUALCOMM Incorporated |
| Sector: Technology | |
| SubSector: Communication Equipment | |
| MarketCap: 77517.7 Millions | |
| Recent Price: 164.11 Smart Investing & Trading Score: 38 | |
| Day Percent Change: -1.05% Day Change: -1.74 | |
| Week Change: -0.94% Year-to-date Change: 13.5% | |
| QCOM Links: Profile News Message Board | |
| Charts:- Daily , Weekly | |
| Add QCOM to Watchlist: View: Get Complete QCOM Trend Analysis ➞ | |
 | FIS Fidelity National Information Services, Inc. |
| Sector: Technology | |
| SubSector: Information Technology Services | |
| MarketCap: 71126.8 Millions | |
| Recent Price: 67.20 Smart Investing & Trading Score: 5 | |
| Day Percent Change: -1.06% Day Change: -0.72 | |
| Week Change: -3.45% Year-to-date Change: 11.9% | |
| FIS Links: Profile News Message Board | |
| Charts:- Daily , Weekly | |
| Add FIS to Watchlist: View: Get Complete FIS Trend Analysis ➞ | |
 | IBM International Business Machines Corporation |
| Sector: Technology | |
| SubSector: Information Technology Services | |
| MarketCap: 97241.6 Millions | |
| Recent Price: 164.43 Smart Investing & Trading Score: 10 | |
| Day Percent Change: -1.06% Day Change: -1.77 | |
| Week Change: -1.62% Year-to-date Change: 0.5% | |
| IBM Links: Profile News Message Board | |
| Charts:- Daily , Weekly | |
| Add IBM to Watchlist: View: Get Complete IBM Trend Analysis ➞ | |
 | LHX L3Harris Technologies, Inc. |
| Sector: Technology | |
| SubSector: Communication Equipment | |
| MarketCap: 37906.1 Millions | |
| Recent Price: 211.75 Smart Investing & Trading Score: 50 | |
| Day Percent Change: -1.07% Day Change: -2.30 | |
| Week Change: -1.3% Year-to-date Change: 0.5% | |
| LHX Links: Profile News Message Board | |
| Charts:- Daily , Weekly | |
| Add LHX to Watchlist: View: Get Complete LHX Trend Analysis ➞ | |
 | SPT Sprout Social, Inc. |
| Sector: Technology | |
| SubSector: Software Application | |
| MarketCap: 25087 Millions | |
| Recent Price: 49.91 Smart Investing & Trading Score: 0 | |
| Day Percent Change: -1.07% Day Change: -0.54 | |
| Week Change: -2.88% Year-to-date Change: -18.8% | |
| SPT Links: Profile News Message Board | |
| Charts:- Daily , Weekly | |
| Add SPT to Watchlist: View: Get Complete SPT Trend Analysis ➞ | |
 | SSNC SS&C Technologies Holdings, Inc. |
| Sector: Technology | |
| SubSector: Business Software & Services | |
| MarketCap: 9884.08 Millions | |
| Recent Price: 61.22 Smart Investing & Trading Score: 7 | |
| Day Percent Change: -1.08% Day Change: -0.67 | |
| Week Change: -0.03% Year-to-date Change: 0.2% | |
| SSNC Links: Profile News Message Board | |
| Charts:- Daily , Weekly | |
| Add SSNC to Watchlist: View: Get Complete SSNC Trend Analysis ➞ | |
 | NOW ServiceNow, Inc. |
| Sector: Technology | |
| SubSector: Information Technology Services | |
| MarketCap: 53599.1 Millions | |
| Recent Price: 685.61 Smart Investing & Trading Score: 0 | |
| Day Percent Change: -1.11% Day Change: -7.72 | |
| Week Change: -5.24% Year-to-date Change: -3.0% | |
| NOW Links: Profile News Message Board | |
| Charts:- Daily , Weekly | |
| Add NOW to Watchlist: View: Get Complete NOW Trend Analysis ➞ | |
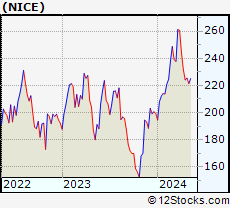 | NICE NICE Ltd. |
| Sector: Technology | |
| SubSector: Computer Peripherals | |
| MarketCap: 8637.89 Millions | |
| Recent Price: 220.94 Smart Investing & Trading Score: 10 | |
| Day Percent Change: -1.15% Day Change: -2.57 | |
| Week Change: -2.01% Year-to-date Change: 10.7% | |
| NICE Links: Profile News Message Board | |
| Charts:- Daily , Weekly | |
| Add NICE to Watchlist: View: Get Complete NICE Trend Analysis ➞ | |
 | NTAP NetApp, Inc. |
| Sector: Technology | |
| SubSector: Data Storage Devices | |
| MarketCap: 9028.89 Millions | |
| Recent Price: 100.99 Smart Investing & Trading Score: 51 | |
| Day Percent Change: -1.19% Day Change: -1.22 | |
| Week Change: -0.34% Year-to-date Change: 14.6% | |
| NTAP Links: Profile News Message Board | |
| Charts:- Daily , Weekly | |
| Add NTAP to Watchlist: View: Get Complete NTAP Trend Analysis ➞ | |
 | HPQ HP Inc. |
| Sector: Technology | |
| SubSector: Diversified Computer Systems | |
| MarketCap: 22107.8 Millions | |
| Recent Price: 27.75 Smart Investing & Trading Score: 0 | |
| Day Percent Change: -1.21% Day Change: -0.34 | |
| Week Change: -0.89% Year-to-date Change: -7.8% | |
| HPQ Links: Profile News Message Board | |
| Charts:- Daily , Weekly | |
| Add HPQ to Watchlist: View: Get Complete HPQ Trend Analysis ➞ | |
 | PANW Palo Alto Networks, Inc. |
| Sector: Technology | |
| SubSector: Networking & Communication Devices | |
| MarketCap: 16039.4 Millions | |
| Recent Price: 287.34 Smart Investing & Trading Score: 32 | |
| Day Percent Change: -1.22% Day Change: -3.55 | |
| Week Change: -1.4% Year-to-date Change: -2.6% | |
| PANW Links: Profile News Message Board | |
| Charts:- Daily , Weekly | |
| Add PANW to Watchlist: View: Get Complete PANW Trend Analysis ➞ | |
| For tabular summary view of above stock list: Summary View ➞ 0 - 25 , 25 - 50 , 50 - 75 , 75 - 100 , 100 - 125 , 125 - 150 , 150 - 175 , 175 - 200 | ||
| Click To Change The Sort Order: By Market Cap or Company Size Performance: Year-to-date, Week and Day | |
| Select Chart Type: | ||
|
Best Stocks Today 12Stocks.com |
© 2024 12Stocks.com Terms & Conditions Privacy Contact Us
All Information Provided Only For Education And Not To Be Used For Investing or Trading. See Terms & Conditions


One More Thing ... Get Best Stocks Delivered Daily!
Never Ever Miss A Move With Our Top Ten Stocks Lists
Find Best Stocks In Any Market - Bull or Bear Market
Take A Peek At Our Top Ten Stocks Lists: Daily, Weekly, Year-to-Date & Top Trends
Find Best Stocks In Any Market - Bull or Bear Market
Take A Peek At Our Top Ten Stocks Lists: Daily, Weekly, Year-to-Date & Top Trends
Technology Stocks With Best Up Trends [0-bearish to 100-bullish]: A10 Networks[100], Garmin [100], Conduent [100], Snap [100], Mesa [100], CTS [100], GDS [100], 21Vianet [100], Clearfield [100], Silicom [100], Ouster [100]
Best Technology Stocks Year-to-Date:
MediaCo Holding[439.91%], Bakkt [182.96%], Uxin [178.17%], Smith Micro[176.03%], CXApp [160.23%], Super Micro[159.73%], SoundHound AI[105.14%], NextNav [104.27%], CuriosityStream [101.81%], MediaAlpha [89.39%], Cheetah Mobile[78.07%] Best Technology Stocks This Week:
Bakkt [1478.68%], SYLA [73.71%], MediaCo Holding[32.95%], Koninklijke Philips[27.01%], Mitcham Industries[24.94%], Phoenix New[21.71%], Harmonic [20.54%], Quantum [15.48%], Cogint [15.12%], Viomi [14.26%], Conduent [14.05%] Best Technology Stocks Daily:
SYLA [130.82%], MediaCo Holding[30.68%], A10 Networks[17.69%], Garmin [13.12%], Conduent [10.79%], AMTD Digital[10.64%], Cambium Networks[10.62%], Luna Innovations[8.50%], Arqit Quantum[8.50%], DigitalOcean [8.13%], Endava [7.76%]