
 Login Sign Up


| |||||
 |  | ||||

| 12Stocks.com Market Intelligence |
Best SmallCap Stocks
|
| In a hurry? Small Cap Stock Lists: Performance Trends Table, Stock Charts
Sort Small Cap stocks: Daily, Weekly, Year-to-Date, Market Cap & Trends. Filter Small Cap stocks list by sector: Show all, Tech, Finance, Energy, Staples, Retail, Industrial, Materials, Utilities and HealthCare Filter Small Cap stocks list by size: All Large Medium Small and MicroCap |
| 12Stocks.com Small Cap Stocks Performances & Trends Daily | |||||||||
|
|  The overall Smart Investing & Trading Score is 76 (0-bearish to 100-bullish) which puts Small Cap index in short term neutral to bullish trend. The Smart Investing & Trading Score from previous trading session is 90 and hence a deterioration of trend.
| ||||||||
Here are the Smart Investing & Trading Scores of the most requested small cap stocks at 12Stocks.com (click stock name for detailed review):
|


| 12Stocks.com: Investing in Smallcap Index with Stocks | |
|
The following table helps investors and traders sort through current performance and trends (as measured by Smart Investing & Trading Score) of various
stocks in the Smallcap Index. Quick View: Move mouse or cursor over stock symbol (ticker) to view short-term technical chart and over stock name to view long term chart. Click on  to add stock symbol to your watchlist and to add stock symbol to your watchlist and  to view watchlist. Click on any ticker or stock name for detailed market intelligence report for that stock. to view watchlist. Click on any ticker or stock name for detailed market intelligence report for that stock. |
12Stocks.com Performance of Stocks in Smallcap Index
| Ticker | Stock Name | Watchlist | Category | Recent Price | Smart Investing & Trading Score | Change % | YTD Change% |
| UTL | Unitil |   | Utilities | 54.16 | 83 | -0.93 | 3.02% |
| STOK | Stoke | | Health Care | 13.90 | 88 | -0.93 | 164.26% |
| INFN | Infinera | | Technology | 5.26 | 68 | -0.94 | 10.74% |
| INMD | InMode | | Health Care | 18.46 | 50 | -0.97 | -17.00% |
| DTC | Solo Brands | | Services & Goods | 2.02 | 32 | -0.98 | -67.42% |
| PATK | Patrick Industries | | Industrials | 111.39 | 25 | -0.98 | 11.00% |
| GPI | Group 1 | | Services & Goods | 314.82 | 68 | -0.99 | 3.31% |
| SCSC | ScanSource | | Technology | 49.33 | 90 | -1.00 | 24.54% |
| CSWI | CSW Industrials | | Industrials | 240.37 | 34 | -1.00 | 15.89% |
| SFL | SFL | | Transports | 14.05 | 75 | -1.06 | 24.56% |
| GFF | Griffon | | Industrials | 67.28 | 0 | -1.10 | 10.39% |
| UONEK | Urban One | | Services & Goods | 1.80 | 62 | -1.10 | -47.67% |
| SAH | Sonic Automotive | | Services & Goods | 58.99 | 61 | -1.14 | 4.95% |
| HCAT | Health Catalyst | | Technology | 6.95 | 59 | -1.14 | -24.95% |
| MLYS | Mineralys | | Health Care | 13.00 | 33 | -1.14 | 49.08% |
| RMR | RMR Group | | Financials | 24.06 | 47 | -1.15 | -14.77% |
| FDMT | 4D Molecular | | Health Care | 25.34 | 22 | -1.17 | 22.42% |
| AIR | AAR | | Industrials | 71.24 | 68 | -1.19 | 14.17% |
| DHT | DHT | | Transports | 12.49 | 90 | -1.19 | 27.32% |
| SILK | Silk Road | | Health Care | 22.18 | 88 | -1.20 | 80.77% |
| EHAB | Enhabit | | Health Care | 8.25 | 10 | -1.20 | -20.29% |
| ARCB | ArcBest | | Transports | 113.78 | 0 | -1.21 | -5.35% |
| NTGR | NETGEAR | | Technology | 12.90 | 42 | -1.23 | -11.52% |
| TBI | TrueBlue | | Services & Goods | 11.17 | 57 | -1.24 | -27.18% |
| GLDD | Great Lakes | | Industrials | 9.48 | 83 | -1.25 | 23.44% |
| For chart view version of above stock list: Chart View ➞ 0 - 25 , 25 - 50 , 50 - 75 , 75 - 100 , 100 - 125 , 125 - 150 , 150 - 175 , 175 - 200 , 200 - 225 , 225 - 250 , 250 - 275 , 275 - 300 , 300 - 325 , 325 - 350 | ||
 | Click To Change The Sort Order: By Market Cap or Company Size Performance: Year-to-date, Week and Day |  |
| Too many stocks? View smallcap stocks filtered by marketcap & sector |
| Marketcap: All SmallCap Stocks (default-no microcap), Large, Mid-Range, Small |
| Smallcap Sector: Tech, Finance, Energy, Staples, Retail, Industrial, Materials, & Medical |
|
Get the most comprehensive stock market coverage daily at 12Stocks.com ➞ Best Stocks Today ➞ Best Stocks Weekly ➞ Best Stocks Year-to-Date ➞ Best Stocks Trends ➞  Best Stocks Today 12Stocks.com Best Nasdaq Stocks ➞ Best S&P 500 Stocks ➞ Best Tech Stocks ➞ Best Biotech Stocks ➞ |
| Detailed Overview of SmallCap Stocks |
| SmallCap Technical Overview, Leaders & Laggards, Top SmallCap ETF Funds & Detailed SmallCap Stocks List, Charts, Trends & More |
| Smallcap: Technical Analysis, Trends & YTD Performance | |
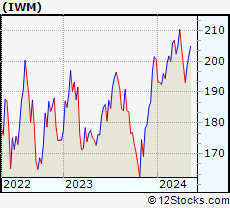
| SmallCap segment as represented by
IWM, an exchange-traded fund [ETF], holds basket of thousands of smallcap stocks from across all major sectors of the US stock market. The smallcap index (contains stocks like Riverbed & Sotheby's) is up by 3.67% and is currently underperforming the overall market by -6.9% year-to-date. Below is a quick view of technical charts and trends: | |
 IWM Weekly Chart |
|
| Long Term Trend: Very Good | |
| Medium Term Trend: Very Good | |
 IWM Daily Chart |
|
| Short Term Trend: Good | |
| Overall Trend Score: 76 | |
| YTD Performance: 3.67% | |
| **Trend Scores & Views Are Only For Educational Purposes And Not For Investing | |
| 12Stocks.com: Top Performing Small Cap Index Stocks | ||||||||||||||||||||||||||||||||||||||||||||||||
 The top performing Small Cap Index stocks year to date are
Now, more recently, over last week, the top performing Small Cap Index stocks on the move are


|
||||||||||||||||||||||||||||||||||||||||||||||||
| 12Stocks.com: Investing in Smallcap Index using Exchange Traded Funds | |
|
The following table shows list of key exchange traded funds (ETF) that
help investors track Smallcap index. The following list also includes leveraged ETF funds that track twice or thrice the daily returns of Smallcap indices. Short or inverse ETF funds move in the opposite direction to the index they track and are useful during market pullbacks or during bear markets. Quick View: Move mouse or cursor over ETF symbol (ticker) to view short-term technical chart and over ETF name to view long term chart. Click on ticker or stock name for detailed view. Click on to add stock symbol to your watchlist and to view watchlist. |
12Stocks.com List of ETFs that track Smallcap Index
| Ticker | ETF Name | Watchlist | Recent Price | Smart Investing & Trading Score | Change % | Week % | Year-to-date % |
| IWM | iShares Russell 2000 | | 208.08 | 76 | 0.07 | 1.85 | 3.67% |
| VTWO | Vanguard Russell 2000 ETF | | 84.11 | 71 | 0.00 | 1.8 | 3.71% |
| IJR | iShares Core S&P Small-Cap | | 110.39 | 68 | -0.22 | 1.29 | 1.98% |
| IWN | iShares Russell 2000 Value | | 158.71 | 76 | -0.07 | 1.61 | 2.18% |
| IWO | iShares Russell 2000 Growth | | 265.15 | 63 | -0.75 | 2.01 | 5.13% |
| IJS | iShares S&P Small-Cap 600 Value | | 101.87 | 76 | -0.15 | 1.34 | -1.16% |
| IJT | iShares S&P Small-Cap 600 Growth | | 131.34 | 71 | 0.04 | 1.14 | 4.95% |
| XSLV | PowerShares S&P SmallCap Low Volatil ETF | | 44.48 | 83 | -0.01 | 0.55 | 0.74% |
| SAA | ProShares Ultra SmallCap600 | | 24.90 | 71 | 0.50 | 2.28 | -0.18% |
| SMLV | SPDR SSGA US Small Cap Low Volatil ETF | | 113.28 | 95 | 0.43 | 1.85 | 0.68% |
| SDD | ProShares UltraShort SmallCap600 | | 17.84 | 35 | 0.96 | -2.41 | -3.19% |
| SBB | ProShares Short SmallCap600 | | 15.77 | 25 | 0.41 | -1.14 | -0.98% |
| 12Stocks.com: Charts, Trends, Fundamental Data and Performances of SmallCap Stocks | |
|
We now take in-depth look at all SmallCap stocks including charts, multi-period performances and overall trends (as measured by Smart Investing & Trading Score). One can sort SmallCap stocks (click link to choose) by Daily, Weekly and by Year-to-Date performances. Also, one can sort by size of the company or by market capitalization. |
| Select Your Default Chart Type: | |||||
| |||||
| Click on stock symbol or name for detailed view. Click on to add stock symbol to your watchlist and to view watchlist. Quick View: Move mouse or cursor over "Daily" to quickly view daily technical stock chart and over "Weekly" to view weekly technical stock chart. | |||||

 | UTL Unitil Corporation |
| Sector: Utilities | |
| SubSector: Diversified Utilities | |
| MarketCap: 756.98 Millions | |
| Recent Price: 54.16 Smart Investing & Trading Score: 83 | |
| Day Percent Change: -0.93% Day Change: -0.51 | |
| Week Change: -0.61% Year-to-date Change: 3.0% | |
| UTL Links: Profile News Message Board | |
| Charts:- Daily , Weekly | |
| Add UTL to Watchlist: View: Get Complete UTL Trend Analysis ➞ | |
 | STOK Stoke Therapeutics, Inc. |
| Sector: Health Care | |
| SubSector: Biotechnology | |
| MarketCap: 772.485 Millions | |
| Recent Price: 13.90 Smart Investing & Trading Score: 88 | |
| Day Percent Change: -0.93% Day Change: -0.13 | |
| Week Change: 22.79% Year-to-date Change: 164.3% | |
| STOK Links: Profile News Message Board | |
| Charts:- Daily , Weekly | |
| Add STOK to Watchlist: View: Get Complete STOK Trend Analysis ➞ | |
 | INFN Infinera Corporation |
| Sector: Technology | |
| SubSector: Communication Equipment | |
| MarketCap: 943 Millions | |
| Recent Price: 5.26 Smart Investing & Trading Score: 68 | |
| Day Percent Change: -0.94% Day Change: -0.05 | |
| Week Change: 3.95% Year-to-date Change: 10.7% | |
| INFN Links: Profile News Message Board | |
| Charts:- Daily , Weekly | |
| Add INFN to Watchlist: View: Get Complete INFN Trend Analysis ➞ | |
 | INMD InMode Ltd. |
| Sector: Health Care | |
| SubSector: Medical Appliances & Equipment | |
| MarketCap: 689.08 Millions | |
| Recent Price: 18.46 Smart Investing & Trading Score: 50 | |
| Day Percent Change: -0.97% Day Change: -0.18 | |
| Week Change: 1.4% Year-to-date Change: -17.0% | |
| INMD Links: Profile News Message Board | |
| Charts:- Daily , Weekly | |
| Add INMD to Watchlist: View: Get Complete INMD Trend Analysis ➞ | |
 | DTC Solo Brands, Inc. |
| Sector: Services & Goods | |
| SubSector: Internet Retail | |
| MarketCap: 525 Millions | |
| Recent Price: 2.02 Smart Investing & Trading Score: 32 | |
| Day Percent Change: -0.98% Day Change: -0.02 | |
| Week Change: -0.49% Year-to-date Change: -67.4% | |
| DTC Links: Profile News Message Board | |
| Charts:- Daily , Weekly | |
| Add DTC to Watchlist: View: Get Complete DTC Trend Analysis ➞ | |
 | PATK Patrick Industries, Inc. |
| Sector: Industrials | |
| SubSector: Lumber, Wood Production | |
| MarketCap: 565.838 Millions | |
| Recent Price: 111.39 Smart Investing & Trading Score: 25 | |
| Day Percent Change: -0.98% Day Change: -1.10 | |
| Week Change: -3.04% Year-to-date Change: 11.0% | |
| PATK Links: Profile News Message Board | |
| Charts:- Daily , Weekly | |
| Add PATK to Watchlist: View: Get Complete PATK Trend Analysis ➞ | |
 | GPI Group 1 Automotive, Inc. |
| Sector: Services & Goods | |
| SubSector: Auto Dealerships | |
| MarketCap: 921.021 Millions | |
| Recent Price: 314.82 Smart Investing & Trading Score: 68 | |
| Day Percent Change: -0.99% Day Change: -3.14 | |
| Week Change: 4.39% Year-to-date Change: 3.3% | |
| GPI Links: Profile News Message Board | |
| Charts:- Daily , Weekly | |
| Add GPI to Watchlist: View: Get Complete GPI Trend Analysis ➞ | |
 | SCSC ScanSource, Inc. |
| Sector: Technology | |
| SubSector: Technical & System Software | |
| MarketCap: 541 Millions | |
| Recent Price: 49.33 Smart Investing & Trading Score: 90 | |
| Day Percent Change: -1.00% Day Change: -0.50 | |
| Week Change: 4.23% Year-to-date Change: 24.5% | |
| SCSC Links: Profile News Message Board | |
| Charts:- Daily , Weekly | |
| Add SCSC to Watchlist: View: Get Complete SCSC Trend Analysis ➞ | |
 | CSWI CSW Industrials, Inc. |
| Sector: Industrials | |
| SubSector: Diversified Machinery | |
| MarketCap: 985.616 Millions | |
| Recent Price: 240.37 Smart Investing & Trading Score: 34 | |
| Day Percent Change: -1.00% Day Change: -2.42 | |
| Week Change: -2.93% Year-to-date Change: 15.9% | |
| CSWI Links: Profile News Message Board | |
| Charts:- Daily , Weekly | |
| Add CSWI to Watchlist: View: Get Complete CSWI Trend Analysis ➞ | |
 | SFL SFL Corporation Ltd. |
| Sector: Transports | |
| SubSector: Shipping | |
| MarketCap: 890.414 Millions | |
| Recent Price: 14.05 Smart Investing & Trading Score: 75 | |
| Day Percent Change: -1.06% Day Change: -0.15 | |
| Week Change: -1.68% Year-to-date Change: 24.6% | |
| SFL Links: Profile News Message Board | |
| Charts:- Daily , Weekly | |
| Add SFL to Watchlist: View: Get Complete SFL Trend Analysis ➞ | |
 | GFF Griffon Corporation |
| Sector: Industrials | |
| SubSector: General Building Materials | |
| MarketCap: 616 Millions | |
| Recent Price: 67.28 Smart Investing & Trading Score: 0 | |
| Day Percent Change: -1.10% Day Change: -0.75 | |
| Week Change: -5.36% Year-to-date Change: 10.4% | |
| GFF Links: Profile News Message Board | |
| Charts:- Daily , Weekly | |
| Add GFF to Watchlist: View: Get Complete GFF Trend Analysis ➞ | |
 | UONEK Urban One, Inc. |
| Sector: Services & Goods | |
| SubSector: Broadcasting - Radio | |
| MarketCap: 601.795 Millions | |
| Recent Price: 1.80 Smart Investing & Trading Score: 62 | |
| Day Percent Change: -1.10% Day Change: -0.02 | |
| Week Change: 7.14% Year-to-date Change: -47.7% | |
| UONEK Links: Profile News Message Board | |
| Charts:- Daily , Weekly | |
| Add UONEK to Watchlist: View: Get Complete UONEK Trend Analysis ➞ | |
 | SAH Sonic Automotive, Inc. |
| Sector: Services & Goods | |
| SubSector: Auto Dealerships | |
| MarketCap: 581.321 Millions | |
| Recent Price: 58.99 Smart Investing & Trading Score: 61 | |
| Day Percent Change: -1.14% Day Change: -0.68 | |
| Week Change: 1.6% Year-to-date Change: 5.0% | |
| SAH Links: Profile News Message Board | |
| Charts:- Daily , Weekly | |
| Add SAH to Watchlist: View: Get Complete SAH Trend Analysis ➞ | |
 | HCAT Health Catalyst, Inc. |
| Sector: Technology | |
| SubSector: Healthcare Information Services | |
| MarketCap: 983.955 Millions | |
| Recent Price: 6.95 Smart Investing & Trading Score: 59 | |
| Day Percent Change: -1.14% Day Change: -0.08 | |
| Week Change: 9.79% Year-to-date Change: -25.0% | |
| HCAT Links: Profile News Message Board | |
| Charts:- Daily , Weekly | |
| Add HCAT to Watchlist: View: Get Complete HCAT Trend Analysis ➞ | |
 | MLYS Mineralys Therapeutics, Inc. |
| Sector: Health Care | |
| SubSector: Biotechnology | |
| MarketCap: 719 Millions | |
| Recent Price: 13.00 Smart Investing & Trading Score: 33 | |
| Day Percent Change: -1.14% Day Change: -0.15 | |
| Week Change: -3.85% Year-to-date Change: 49.1% | |
| MLYS Links: Profile News Message Board | |
| Charts:- Daily , Weekly | |
| Add MLYS to Watchlist: View: Get Complete MLYS Trend Analysis ➞ | |
 | RMR The RMR Group Inc. |
| Sector: Financials | |
| SubSector: Real Estate Development | |
| MarketCap: 797.419 Millions | |
| Recent Price: 24.06 Smart Investing & Trading Score: 47 | |
| Day Percent Change: -1.15% Day Change: -0.28 | |
| Week Change: 1.13% Year-to-date Change: -14.8% | |
| RMR Links: Profile News Message Board | |
| Charts:- Daily , Weekly | |
| Add RMR to Watchlist: View: Get Complete RMR Trend Analysis ➞ | |
 | FDMT 4D Molecular Therapeutics, Inc. |
| Sector: Health Care | |
| SubSector: Biotechnology | |
| MarketCap: 772 Millions | |
| Recent Price: 25.34 Smart Investing & Trading Score: 22 | |
| Day Percent Change: -1.17% Day Change: -0.30 | |
| Week Change: -1.4% Year-to-date Change: 22.4% | |
| FDMT Links: Profile News Message Board | |
| Charts:- Daily , Weekly | |
| Add FDMT to Watchlist: View: Get Complete FDMT Trend Analysis ➞ | |
 | AIR AAR Corp. |
| Sector: Industrials | |
| SubSector: Aerospace/Defense Products & Services | |
| MarketCap: 591.701 Millions | |
| Recent Price: 71.24 Smart Investing & Trading Score: 68 | |
| Day Percent Change: -1.19% Day Change: -0.86 | |
| Week Change: -1.3% Year-to-date Change: 14.2% | |
| AIR Links: Profile News Message Board | |
| Charts:- Daily , Weekly | |
| Add AIR to Watchlist: View: Get Complete AIR Trend Analysis ➞ | |
 | DHT DHT Holdings, Inc. |
| Sector: Transports | |
| SubSector: Shipping | |
| MarketCap: 754.514 Millions | |
| Recent Price: 12.49 Smart Investing & Trading Score: 90 | |
| Day Percent Change: -1.19% Day Change: -0.15 | |
| Week Change: 3.22% Year-to-date Change: 27.3% | |
| DHT Links: Profile News Message Board | |
| Charts:- Daily , Weekly | |
| Add DHT to Watchlist: View: Get Complete DHT Trend Analysis ➞ | |
 | SILK Silk Road Medical, Inc |
| Sector: Health Care | |
| SubSector: Medical Appliances & Equipment | |
| MarketCap: 881.78 Millions | |
| Recent Price: 22.18 Smart Investing & Trading Score: 88 | |
| Day Percent Change: -1.20% Day Change: -0.27 | |
| Week Change: 5.87% Year-to-date Change: 80.8% | |
| SILK Links: Profile News Message Board | |
| Charts:- Daily , Weekly | |
| Add SILK to Watchlist: View: Get Complete SILK Trend Analysis ➞ | |
 | EHAB Enhabit, Inc. |
| Sector: Health Care | |
| SubSector: Medical Care Facilities | |
| MarketCap: 569 Millions | |
| Recent Price: 8.25 Smart Investing & Trading Score: 10 | |
| Day Percent Change: -1.20% Day Change: -0.10 | |
| Week Change: -1.08% Year-to-date Change: -20.3% | |
| EHAB Links: Profile News Message Board | |
| Charts:- Daily , Weekly | |
| Add EHAB to Watchlist: View: Get Complete EHAB Trend Analysis ➞ | |
 | ARCB ArcBest Corporation |
| Sector: Transports | |
| SubSector: Trucking | |
| MarketCap: 515.415 Millions | |
| Recent Price: 113.78 Smart Investing & Trading Score: 0 | |
| Day Percent Change: -1.21% Day Change: -1.39 | |
| Week Change: -3.08% Year-to-date Change: -5.4% | |
| ARCB Links: Profile News Message Board | |
| Charts:- Daily , Weekly | |
| Add ARCB to Watchlist: View: Get Complete ARCB Trend Analysis ➞ | |
 | NTGR NETGEAR, Inc. |
| Sector: Technology | |
| SubSector: Communication Equipment | |
| MarketCap: 558.839 Millions | |
| Recent Price: 12.90 Smart Investing & Trading Score: 42 | |
| Day Percent Change: -1.23% Day Change: -0.16 | |
| Week Change: 7.14% Year-to-date Change: -11.5% | |
| NTGR Links: Profile News Message Board | |
| Charts:- Daily , Weekly | |
| Add NTGR to Watchlist: View: Get Complete NTGR Trend Analysis ➞ | |
 | TBI TrueBlue, Inc. |
| Sector: Services & Goods | |
| SubSector: Staffing & Outsourcing Services | |
| MarketCap: 563.228 Millions | |
| Recent Price: 11.17 Smart Investing & Trading Score: 57 | |
| Day Percent Change: -1.24% Day Change: -0.14 | |
| Week Change: 3.23% Year-to-date Change: -27.2% | |
| TBI Links: Profile News Message Board | |
| Charts:- Daily , Weekly | |
| Add TBI to Watchlist: View: Get Complete TBI Trend Analysis ➞ | |
 | GLDD Great Lakes Dredge & Dock Corporation |
| Sector: Industrials | |
| SubSector: Heavy Construction | |
| MarketCap: 619.095 Millions | |
| Recent Price: 9.48 Smart Investing & Trading Score: 83 | |
| Day Percent Change: -1.25% Day Change: -0.12 | |
| Week Change: 4.52% Year-to-date Change: 23.4% | |
| GLDD Links: Profile News Message Board | |
| Charts:- Daily , Weekly | |
| Add GLDD to Watchlist: View: Get Complete GLDD Trend Analysis ➞ | |
| For tabular summary view of above stock list: Summary View ➞ 0 - 25 , 25 - 50 , 50 - 75 , 75 - 100 , 100 - 125 , 125 - 150 , 150 - 175 , 175 - 200 , 200 - 225 , 225 - 250 , 250 - 275 , 275 - 300 , 300 - 325 , 325 - 350 | ||
| Click To Change The Sort Order: By Market Cap or Company Size Performance: Year-to-date, Week and Day | |
| Select Chart Type: | ||
| Too many stocks? View smallcap stocks filtered by marketcap & sector |
| Marketcap: All SmallCap Stocks (default-no microcap), Large, Mid-Range, Small & MicroCap |
| Sector: Tech, Finance, Energy, Staples, Retail, Industrial, Materials, Utilities & Medical |
|
Best Stocks Today 12Stocks.com |
© 2024 12Stocks.com Terms & Conditions Privacy Contact Us
All Information Provided Only For Education And Not To Be Used For Investing or Trading. See Terms & Conditions


One More Thing ... Get Best Stocks Delivered Daily!
Never Ever Miss A Move With Our Top Ten Stocks Lists
Find Best Stocks In Any Market - Bull or Bear Market
Take A Peek At Our Top Ten Stocks Lists: Daily, Weekly, Year-to-Date & Top Trends
Find Best Stocks In Any Market - Bull or Bear Market
Take A Peek At Our Top Ten Stocks Lists: Daily, Weekly, Year-to-Date & Top Trends
Smallcap Stocks With Best Up Trends [0-bearish to 100-bullish]: CommScope Holding[100], Coeur Mining[100], Hecla Mining[100], MicroStrategy [100], Enovix [100], Rayonier Advanced[100], Nurix [100], Energy Fuels[100], NovaGold Resources[100], Piedmont Lithium[100], Wave Life[100]
Best Smallcap Stocks Year-to-Date:
CareMax [495.88%], Bakkt [413.9%], Janux [338.34%], Viking [260.02%], Alpine Immune[241.23%], Longboard [238.63%], Avidity Biosciences[226.33%], Super Micro[212.35%], Arcutis Bio[184.83%], Sweetgreen [180.97%], Novavax [171.04%] Best Smallcap Stocks This Week:
Vaxxinity [58.82%], Novavax [46.51%], Vicarious Surgical[45.62%], Harrow Health[44.48%], ProKidney [44.31%], Workhorse Group[36.06%], Maxeon Solar[35.94%], Fossil Group[35.44%], Humacyte [34.68%], MicroStrategy [34.23%], Cadiz [33.48%] Best Smallcap Stocks Daily:
Vaxxinity [45.95%], Presto Automation[31.90%], Vicarious Surgical[27.93%], Orchestra BioMed[12.77%], CommScope Holding[11.86%], Coeur Mining[11.57%], Hecla Mining[11.11%], MicroStrategy [10.04%], Tenaya [9.65%], Bakkt [9.25%], Enovix [9.25%]