
 Login Sign Up


| |||||
 |  | ||||

| 12Stocks.com Market Intelligence |
Best SmallCap Stocks
|
| In a hurry? Small Cap Stock Lists: Performance Trends Table, Stock Charts
Sort Small Cap stocks: Daily, Weekly, Year-to-Date, Market Cap & Trends. Filter Small Cap stocks list by sector: Show all, Tech, Finance, Energy, Staples, Retail, Industrial, Materials, Utilities and HealthCare Filter Small Cap stocks list by size: All Large Medium Small and MicroCap |
| 12Stocks.com Small Cap Stocks Performances & Trends Daily | |||||||||
|
|  The overall Smart Investing & Trading Score is 76 (0-bearish to 100-bullish) which puts Small Cap index in short term neutral to bullish trend. The Smart Investing & Trading Score from previous trading session is 90 and hence a deterioration of trend.
| ||||||||
Here are the Smart Investing & Trading Scores of the most requested small cap stocks at 12Stocks.com (click stock name for detailed review):
|


| 12Stocks.com: Investing in Smallcap Index with Stocks | |
|
The following table helps investors and traders sort through current performance and trends (as measured by Smart Investing & Trading Score) of various
stocks in the Smallcap Index. Quick View: Move mouse or cursor over stock symbol (ticker) to view short-term technical chart and over stock name to view long term chart. Click on  to add stock symbol to your watchlist and to add stock symbol to your watchlist and  to view watchlist. Click on any ticker or stock name for detailed market intelligence report for that stock. to view watchlist. Click on any ticker or stock name for detailed market intelligence report for that stock. |
12Stocks.com Performance of Stocks in Smallcap Index
| Ticker | Stock Name | Watchlist | Category | Recent Price | Smart Investing & Trading Score | Change % | YTD Change% |
| TRST | TrustCo Bank |   | Financials | 29.65 | 100 | 0.37 | -4.51% |
| RBCAA | Republic Bancorp | | Financials | 54.50 | 90 | 0.37 | -1.20% |
| ADUS | Addus HomeCare | | Health Care | 110.66 | 83 | 0.34 | 19.18% |
| CENTA | Central Garden | | Materials | 39.73 | 76 | 0.33 | -9.79% |
| BHLB | Berkshire Hills | | Financials | 23.46 | 90 | 0.30 | -5.52% |
| BV | BrightView | | Industrials | 13.50 | 95 | 0.30 | 60.33% |
| AMBC | Ambac Financial | | Financials | 18.10 | 68 | 0.28 | 9.83% |
| ARDX | Ardelyx | | Health Care | 7.81 | 40 | 0.26 | 25.97% |
| NTB | Bank of N.T. Butterfield & Son | | Financials | 35.72 | 83 | 0.25 | 11.59% |
| FLR | Fluor | | Industrials | 38.35 | 36 | 0.24 | -2.09% |
| AGM | Federal Agricultural | | Financials | 181.84 | 44 | 0.24 | -4.91% |
| CAC | Camden National | | Financials | 33.19 | 83 | 0.24 | -11.80% |
| UVE | Universal Insurance | | Financials | 20.58 | 78 | 0.24 | 28.79% |
| TRTX | TPG RE | | Financials | 8.87 | 90 | 0.23 | 36.46% |
| FBP | First Ban | | Financials | 18.09 | 68 | 0.22 | 9.97% |
| HSTM | HealthStream | | Technology | 27.39 | 70 | 0.22 | 1.33% |
| EGRX | Eagle | | Health Care | 4.76 | 64 | 0.21 | -8.99% |
| SKY | Skyline Champion | | Industrials | 79.68 | 37 | 0.20 | 7.30% |
| KRYS | Krystal Biotech | | Health Care | 164.10 | 78 | 0.20 | 32.27% |
| NTLA | Intellia | | Health Care | 26.22 | 57 | 0.19 | -14.00% |
| SNPO | Snap One | | Technology | 10.64 | 80 | 0.19 | 14.53% |
| GRC | Gorman-Rupp | | Industrials | 32.60 | 13 | 0.18 | -8.25% |
| IMAX | IMAX | | Services & Goods | 16.96 | 17 | 0.18 | 12.92% |
| COOP | Mr. Cooper | | Financials | 84.36 | 100 | 0.17 | 29.55% |
| PFBC | Preferred Bank | | Financials | 79.97 | 90 | 0.11 | 9.47% |
| For chart view version of above stock list: Chart View ➞ 0 - 25 , 25 - 50 , 50 - 75 , 75 - 100 , 100 - 125 , 125 - 150 , 150 - 175 , 175 - 200 , 200 - 225 , 225 - 250 , 250 - 275 , 275 - 300 , 300 - 325 , 325 - 350 | ||
 | Click To Change The Sort Order: By Market Cap or Company Size Performance: Year-to-date, Week and Day |  |
| Too many stocks? View smallcap stocks filtered by marketcap & sector |
| Marketcap: All SmallCap Stocks (default-no microcap), Large, Mid-Range, Small |
| Smallcap Sector: Tech, Finance, Energy, Staples, Retail, Industrial, Materials, & Medical |
|
Get the most comprehensive stock market coverage daily at 12Stocks.com ➞ Best Stocks Today ➞ Best Stocks Weekly ➞ Best Stocks Year-to-Date ➞ Best Stocks Trends ➞  Best Stocks Today 12Stocks.com Best Nasdaq Stocks ➞ Best S&P 500 Stocks ➞ Best Tech Stocks ➞ Best Biotech Stocks ➞ |
| Detailed Overview of SmallCap Stocks |
| SmallCap Technical Overview, Leaders & Laggards, Top SmallCap ETF Funds & Detailed SmallCap Stocks List, Charts, Trends & More |
| Smallcap: Technical Analysis, Trends & YTD Performance | |
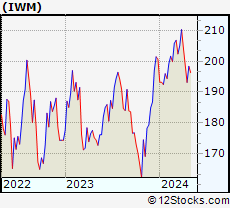
| SmallCap segment as represented by
IWM, an exchange-traded fund [ETF], holds basket of thousands of smallcap stocks from across all major sectors of the US stock market. The smallcap index (contains stocks like Riverbed & Sotheby's) is up by 3.67% and is currently underperforming the overall market by -6.9% year-to-date. Below is a quick view of technical charts and trends: | |
 IWM Weekly Chart |
|
| Long Term Trend: Very Good | |
| Medium Term Trend: Very Good | |
 IWM Daily Chart |
|
| Short Term Trend: Good | |
| Overall Trend Score: 76 | |
| YTD Performance: 3.67% | |
| **Trend Scores & Views Are Only For Educational Purposes And Not For Investing | |
| 12Stocks.com: Top Performing Small Cap Index Stocks | ||||||||||||||||||||||||||||||||||||||||||||||||
 The top performing Small Cap Index stocks year to date are
Now, more recently, over last week, the top performing Small Cap Index stocks on the move are


|
||||||||||||||||||||||||||||||||||||||||||||||||
| 12Stocks.com: Investing in Smallcap Index using Exchange Traded Funds | |
|
The following table shows list of key exchange traded funds (ETF) that
help investors track Smallcap index. The following list also includes leveraged ETF funds that track twice or thrice the daily returns of Smallcap indices. Short or inverse ETF funds move in the opposite direction to the index they track and are useful during market pullbacks or during bear markets. Quick View: Move mouse or cursor over ETF symbol (ticker) to view short-term technical chart and over ETF name to view long term chart. Click on ticker or stock name for detailed view. Click on to add stock symbol to your watchlist and to view watchlist. |
12Stocks.com List of ETFs that track Smallcap Index
| Ticker | ETF Name | Watchlist | Recent Price | Smart Investing & Trading Score | Change % | Week % | Year-to-date % |
| IWM | iShares Russell 2000 | | 208.08 | 76 | 0.07 | 1.85 | 3.67% |
| VTWO | Vanguard Russell 2000 ETF | | 84.11 | 71 | 0.00 | 1.8 | 3.71% |
| IJR | iShares Core S&P Small-Cap | | 110.39 | 68 | -0.22 | 1.29 | 1.98% |
| IWN | iShares Russell 2000 Value | | 158.71 | 76 | -0.07 | 1.61 | 2.18% |
| IWO | iShares Russell 2000 Growth | | 265.15 | 63 | -0.75 | 2.01 | 5.13% |
| IJS | iShares S&P Small-Cap 600 Value | | 101.87 | 76 | -0.15 | 1.34 | -1.16% |
| IJT | iShares S&P Small-Cap 600 Growth | | 131.34 | 71 | 0.04 | 1.14 | 4.95% |
| XSLV | PowerShares S&P SmallCap Low Volatil ETF | | 44.48 | 83 | -0.01 | 0.55 | 0.74% |
| SAA | ProShares Ultra SmallCap600 | | 24.90 | 71 | 0.50 | 2.28 | -0.18% |
| SMLV | SPDR SSGA US Small Cap Low Volatil ETF | | 113.28 | 95 | 0.43 | 1.85 | 0.68% |
| SDD | ProShares UltraShort SmallCap600 | | 17.84 | 35 | 0.96 | -2.41 | -3.19% |
| SBB | ProShares Short SmallCap600 | | 15.77 | 25 | 0.41 | -1.14 | -0.98% |
| 12Stocks.com: Charts, Trends, Fundamental Data and Performances of SmallCap Stocks | |
|
We now take in-depth look at all SmallCap stocks including charts, multi-period performances and overall trends (as measured by Smart Investing & Trading Score). One can sort SmallCap stocks (click link to choose) by Daily, Weekly and by Year-to-Date performances. Also, one can sort by size of the company or by market capitalization. |
| Select Your Default Chart Type: | |||||
| |||||
| Click on stock symbol or name for detailed view. Click on to add stock symbol to your watchlist and to view watchlist. Quick View: Move mouse or cursor over "Daily" to quickly view daily technical stock chart and over "Weekly" to view weekly technical stock chart. | |||||

 | TRST TrustCo Bank Corp NY |
| Sector: Financials | |
| SubSector: Regional - Northeast Banks | |
| MarketCap: 543.999 Millions | |
| Recent Price: 29.65 Smart Investing & Trading Score: 100 | |
| Day Percent Change: 0.37% Day Change: 0.11 | |
| Week Change: 4.73% Year-to-date Change: -4.5% | |
| TRST Links: Profile News Message Board | |
| Charts:- Daily , Weekly | |
| Add TRST to Watchlist: View: Get Complete TRST Trend Analysis ➞ | |
 | RBCAA Republic Bancorp, Inc. |
| Sector: Financials | |
| SubSector: Regional - Southeast Banks | |
| MarketCap: 671.835 Millions | |
| Recent Price: 54.50 Smart Investing & Trading Score: 90 | |
| Day Percent Change: 0.37% Day Change: 0.20 | |
| Week Change: 1.04% Year-to-date Change: -1.2% | |
| RBCAA Links: Profile News Message Board | |
| Charts:- Daily , Weekly | |
| Add RBCAA to Watchlist: View: Get Complete RBCAA Trend Analysis ➞ | |
 | ADUS Addus HomeCare Corporation |
| Sector: Health Care | |
| SubSector: Home Health Care | |
| MarketCap: 994.795 Millions | |
| Recent Price: 110.66 Smart Investing & Trading Score: 83 | |
| Day Percent Change: 0.34% Day Change: 0.37 | |
| Week Change: 1.28% Year-to-date Change: 19.2% | |
| ADUS Links: Profile News Message Board | |
| Charts:- Daily , Weekly | |
| Add ADUS to Watchlist: View: Get Complete ADUS Trend Analysis ➞ | |
 | CENTA Central Garden & Pet Company |
| Sector: Materials | |
| SubSector: Agricultural Chemicals | |
| MarketCap: 953 Millions | |
| Recent Price: 39.73 Smart Investing & Trading Score: 76 | |
| Day Percent Change: 0.33% Day Change: 0.13 | |
| Week Change: -1.24% Year-to-date Change: -9.8% | |
| CENTA Links: Profile News Message Board | |
| Charts:- Daily , Weekly | |
| Add CENTA to Watchlist: View: Get Complete CENTA Trend Analysis ➞ | |
 | BHLB Berkshire Hills Bancorp, Inc. |
| Sector: Financials | |
| SubSector: Savings & Loans | |
| MarketCap: 686.33 Millions | |
| Recent Price: 23.46 Smart Investing & Trading Score: 90 | |
| Day Percent Change: 0.30% Day Change: 0.07 | |
| Week Change: 1.3% Year-to-date Change: -5.5% | |
| BHLB Links: Profile News Message Board | |
| Charts:- Daily , Weekly | |
| Add BHLB to Watchlist: View: Get Complete BHLB Trend Analysis ➞ | |
 | BV BrightView Holdings, Inc. |
| Sector: Industrials | |
| SubSector: General Contractors | |
| MarketCap: 973.763 Millions | |
| Recent Price: 13.50 Smart Investing & Trading Score: 95 | |
| Day Percent Change: 0.30% Day Change: 0.04 | |
| Week Change: 7.4% Year-to-date Change: 60.3% | |
| BV Links: Profile News Message Board | |
| Charts:- Daily , Weekly | |
| Add BV to Watchlist: View: Get Complete BV Trend Analysis ➞ | |
 | AMBC Ambac Financial Group, Inc. |
| Sector: Financials | |
| SubSector: Surety & Title Insurance | |
| MarketCap: 587.818 Millions | |
| Recent Price: 18.10 Smart Investing & Trading Score: 68 | |
| Day Percent Change: 0.28% Day Change: 0.05 | |
| Week Change: -0.33% Year-to-date Change: 9.8% | |
| AMBC Links: Profile News Message Board | |
| Charts:- Daily , Weekly | |
| Add AMBC to Watchlist: View: Get Complete AMBC Trend Analysis ➞ | |
 | ARDX Ardelyx, Inc. |
| Sector: Health Care | |
| SubSector: Biotechnology | |
| MarketCap: 541.985 Millions | |
| Recent Price: 7.81 Smart Investing & Trading Score: 40 | |
| Day Percent Change: 0.26% Day Change: 0.02 | |
| Week Change: 0.51% Year-to-date Change: 26.0% | |
| ARDX Links: Profile News Message Board | |
| Charts:- Daily , Weekly | |
| Add ARDX to Watchlist: View: Get Complete ARDX Trend Analysis ➞ | |
 | NTB The Bank of N.T. Butterfield & Son Limited |
| Sector: Financials | |
| SubSector: Foreign Regional Banks | |
| MarketCap: 889.379 Millions | |
| Recent Price: 35.72 Smart Investing & Trading Score: 83 | |
| Day Percent Change: 0.25% Day Change: 0.09 | |
| Week Change: 1.11% Year-to-date Change: 11.6% | |
| NTB Links: Profile News Message Board | |
| Charts:- Daily , Weekly | |
| Add NTB to Watchlist: View: Get Complete NTB Trend Analysis ➞ | |
 | FLR Fluor Corporation |
| Sector: Industrials | |
| SubSector: Heavy Construction | |
| MarketCap: 891.495 Millions | |
| Recent Price: 38.35 Smart Investing & Trading Score: 36 | |
| Day Percent Change: 0.24% Day Change: 0.09 | |
| Week Change: -0.78% Year-to-date Change: -2.1% | |
| FLR Links: Profile News Message Board | |
| Charts:- Daily , Weekly | |
| Add FLR to Watchlist: View: Get Complete FLR Trend Analysis ➞ | |
 | AGM Federal Agricultural Mortgage Corporation |
| Sector: Financials | |
| SubSector: Credit Services | |
| MarketCap: 542.008 Millions | |
| Recent Price: 181.84 Smart Investing & Trading Score: 44 | |
| Day Percent Change: 0.24% Day Change: 0.44 | |
| Week Change: 1.3% Year-to-date Change: -4.9% | |
| AGM Links: Profile News Message Board | |
| Charts:- Daily , Weekly | |
| Add AGM to Watchlist: View: Get Complete AGM Trend Analysis ➞ | |
 | CAC Camden National Corporation |
| Sector: Financials | |
| SubSector: Regional - Northeast Banks | |
| MarketCap: 550.999 Millions | |
| Recent Price: 33.19 Smart Investing & Trading Score: 83 | |
| Day Percent Change: 0.24% Day Change: 0.08 | |
| Week Change: 2.47% Year-to-date Change: -11.8% | |
| CAC Links: Profile News Message Board | |
| Charts:- Daily , Weekly | |
| Add CAC to Watchlist: View: Get Complete CAC Trend Analysis ➞ | |
 | UVE Universal Insurance Holdings, Inc. |
| Sector: Financials | |
| SubSector: Property & Casualty Insurance | |
| MarketCap: 616.212 Millions | |
| Recent Price: 20.58 Smart Investing & Trading Score: 78 | |
| Day Percent Change: 0.24% Day Change: 0.05 | |
| Week Change: 0.05% Year-to-date Change: 28.8% | |
| UVE Links: Profile News Message Board | |
| Charts:- Daily , Weekly | |
| Add UVE to Watchlist: View: Get Complete UVE Trend Analysis ➞ | |
 | TRTX TPG RE Finance Trust, Inc. |
| Sector: Financials | |
| SubSector: Mortgage Investment | |
| MarketCap: 607.739 Millions | |
| Recent Price: 8.87 Smart Investing & Trading Score: 90 | |
| Day Percent Change: 0.23% Day Change: 0.02 | |
| Week Change: 3.32% Year-to-date Change: 36.5% | |
| TRTX Links: Profile News Message Board | |
| Charts:- Daily , Weekly | |
| Add TRTX to Watchlist: View: Get Complete TRTX Trend Analysis ➞ | |
 | FBP First BanCorp. |
| Sector: Financials | |
| SubSector: Foreign Regional Banks | |
| MarketCap: 913.079 Millions | |
| Recent Price: 18.09 Smart Investing & Trading Score: 68 | |
| Day Percent Change: 0.22% Day Change: 0.04 | |
| Week Change: 0% Year-to-date Change: 10.0% | |
| FBP Links: Profile News Message Board | |
| Charts:- Daily , Weekly | |
| Add FBP to Watchlist: View: Get Complete FBP Trend Analysis ➞ | |
 | HSTM HealthStream, Inc. |
| Sector: Technology | |
| SubSector: Healthcare Information Services | |
| MarketCap: 770.255 Millions | |
| Recent Price: 27.39 Smart Investing & Trading Score: 70 | |
| Day Percent Change: 0.22% Day Change: 0.06 | |
| Week Change: 2.32% Year-to-date Change: 1.3% | |
| HSTM Links: Profile News Message Board | |
| Charts:- Daily , Weekly | |
| Add HSTM to Watchlist: View: Get Complete HSTM Trend Analysis ➞ | |
 | EGRX Eagle Pharmaceuticals, Inc. |
| Sector: Health Care | |
| SubSector: Drugs - Generic | |
| MarketCap: 573.385 Millions | |
| Recent Price: 4.76 Smart Investing & Trading Score: 64 | |
| Day Percent Change: 0.21% Day Change: 0.01 | |
| Week Change: 4.85% Year-to-date Change: -9.0% | |
| EGRX Links: Profile News Message Board | |
| Charts:- Daily , Weekly | |
| Add EGRX to Watchlist: View: Get Complete EGRX Trend Analysis ➞ | |
 | SKY Skyline Champion Corporation |
| Sector: Industrials | |
| SubSector: Manufactured Housing | |
| MarketCap: 915.145 Millions | |
| Recent Price: 79.68 Smart Investing & Trading Score: 37 | |
| Day Percent Change: 0.20% Day Change: 0.16 | |
| Week Change: -0.47% Year-to-date Change: 7.3% | |
| SKY Links: Profile News Message Board | |
| Charts:- Daily , Weekly | |
| Add SKY to Watchlist: View: Get Complete SKY Trend Analysis ➞ | |
 | KRYS Krystal Biotech, Inc. |
| Sector: Health Care | |
| SubSector: Biotechnology | |
| MarketCap: 874.085 Millions | |
| Recent Price: 164.10 Smart Investing & Trading Score: 78 | |
| Day Percent Change: 0.20% Day Change: 0.32 | |
| Week Change: 5.17% Year-to-date Change: 32.3% | |
| KRYS Links: Profile News Message Board | |
| Charts:- Daily , Weekly | |
| Add KRYS to Watchlist: View: Get Complete KRYS Trend Analysis ➞ | |
 | NTLA Intellia Therapeutics, Inc. |
| Sector: Health Care | |
| SubSector: Biotechnology | |
| MarketCap: 707.185 Millions | |
| Recent Price: 26.22 Smart Investing & Trading Score: 57 | |
| Day Percent Change: 0.19% Day Change: 0.05 | |
| Week Change: 7.2% Year-to-date Change: -14.0% | |
| NTLA Links: Profile News Message Board | |
| Charts:- Daily , Weekly | |
| Add NTLA to Watchlist: View: Get Complete NTLA Trend Analysis ➞ | |
 | SNPO Snap One Holdings Corp. |
| Sector: Technology | |
| SubSector: Electronics & Computer Distribution | |
| MarketCap: 807 Millions | |
| Recent Price: 10.64 Smart Investing & Trading Score: 80 | |
| Day Percent Change: 0.19% Day Change: 0.02 | |
| Week Change: 0.28% Year-to-date Change: 14.5% | |
| SNPO Links: Profile News Message Board | |
| Charts:- Daily , Weekly | |
| Add SNPO to Watchlist: View: Get Complete SNPO Trend Analysis ➞ | |
 | GRC The Gorman-Rupp Company |
| Sector: Industrials | |
| SubSector: Diversified Machinery | |
| MarketCap: 729.616 Millions | |
| Recent Price: 32.60 Smart Investing & Trading Score: 13 | |
| Day Percent Change: 0.18% Day Change: 0.06 | |
| Week Change: -2.37% Year-to-date Change: -8.3% | |
| GRC Links: Profile News Message Board | |
| Charts:- Daily , Weekly | |
| Add GRC to Watchlist: View: Get Complete GRC Trend Analysis ➞ | |
 | IMAX IMAX Corporation |
| Sector: Services & Goods | |
| SubSector: Entertainment - Diversified | |
| MarketCap: 874.237 Millions | |
| Recent Price: 16.96 Smart Investing & Trading Score: 17 | |
| Day Percent Change: 0.18% Day Change: 0.03 | |
| Week Change: 1.98% Year-to-date Change: 12.9% | |
| IMAX Links: Profile News Message Board | |
| Charts:- Daily , Weekly | |
| Add IMAX to Watchlist: View: Get Complete IMAX Trend Analysis ➞ | |
 | COOP Mr. Cooper Group Inc. |
| Sector: Financials | |
| SubSector: Savings & Loans | |
| MarketCap: 648.33 Millions | |
| Recent Price: 84.36 Smart Investing & Trading Score: 100 | |
| Day Percent Change: 0.17% Day Change: 0.14 | |
| Week Change: 0.69% Year-to-date Change: 29.6% | |
| COOP Links: Profile News Message Board | |
| Charts:- Daily , Weekly | |
| Add COOP to Watchlist: View: Get Complete COOP Trend Analysis ➞ | |
 | PFBC Preferred Bank |
| Sector: Financials | |
| SubSector: Regional - Pacific Banks | |
| MarketCap: 559.629 Millions | |
| Recent Price: 79.97 Smart Investing & Trading Score: 90 | |
| Day Percent Change: 0.11% Day Change: 0.09 | |
| Week Change: 1.6% Year-to-date Change: 9.5% | |
| PFBC Links: Profile News Message Board | |
| Charts:- Daily , Weekly | |
| Add PFBC to Watchlist: View: Get Complete PFBC Trend Analysis ➞ | |
| For tabular summary view of above stock list: Summary View ➞ 0 - 25 , 25 - 50 , 50 - 75 , 75 - 100 , 100 - 125 , 125 - 150 , 150 - 175 , 175 - 200 , 200 - 225 , 225 - 250 , 250 - 275 , 275 - 300 , 300 - 325 , 325 - 350 | ||
| Click To Change The Sort Order: By Market Cap or Company Size Performance: Year-to-date, Week and Day | |
| Select Chart Type: | ||
| Too many stocks? View smallcap stocks filtered by marketcap & sector |
| Marketcap: All SmallCap Stocks (default-no microcap), Large, Mid-Range, Small & MicroCap |
| Sector: Tech, Finance, Energy, Staples, Retail, Industrial, Materials, Utilities & Medical |
|
Best Stocks Today 12Stocks.com |
© 2024 12Stocks.com Terms & Conditions Privacy Contact Us
All Information Provided Only For Education And Not To Be Used For Investing or Trading. See Terms & Conditions


One More Thing ... Get Best Stocks Delivered Daily!
Never Ever Miss A Move With Our Top Ten Stocks Lists
Find Best Stocks In Any Market - Bull or Bear Market
Take A Peek At Our Top Ten Stocks Lists: Daily, Weekly, Year-to-Date & Top Trends
Find Best Stocks In Any Market - Bull or Bear Market
Take A Peek At Our Top Ten Stocks Lists: Daily, Weekly, Year-to-Date & Top Trends
Smallcap Stocks With Best Up Trends [0-bearish to 100-bullish]: CommScope Holding[100], Coeur Mining[100], Hecla Mining[100], MicroStrategy [100], Enovix [100], Rayonier Advanced[100], Nurix [100], Energy Fuels[100], NovaGold Resources[100], Piedmont Lithium[100], Wave Life[100]
Best Smallcap Stocks Year-to-Date:
CareMax [495.88%], Bakkt [413.9%], Janux [338.34%], Viking [260.02%], Alpine Immune[241.23%], Longboard [238.63%], Avidity Biosciences[226.33%], Super Micro[212.35%], Arcutis Bio[184.83%], Sweetgreen [180.97%], Novavax [171.04%] Best Smallcap Stocks This Week:
Vaxxinity [58.82%], Novavax [46.51%], Vicarious Surgical[45.62%], Harrow Health[44.48%], ProKidney [44.31%], Workhorse Group[36.06%], Maxeon Solar[35.94%], Fossil Group[35.44%], Humacyte [34.68%], MicroStrategy [34.23%], Cadiz [33.48%] Best Smallcap Stocks Daily:
Vaxxinity [45.95%], Presto Automation[31.90%], Vicarious Surgical[27.93%], Orchestra BioMed[12.77%], CommScope Holding[11.86%], Coeur Mining[11.57%], Hecla Mining[11.11%], MicroStrategy [10.04%], Tenaya [9.65%], Bakkt [9.25%], Enovix [9.25%]