
 Login Sign Up


| |||||
 |  | ||||

| 12Stocks.com Market Intelligence |
Best SmallCap Stocks
|
| In a hurry? Small Cap Stock Lists: Performance Trends Table, Stock Charts
Sort Small Cap stocks: Daily, Weekly, Year-to-Date, Market Cap & Trends. Filter Small Cap stocks list by sector: Show all, Tech, Finance, Energy, Staples, Retail, Industrial, Materials, Utilities and HealthCare Filter Small Cap stocks list by size: All Large Medium Small and MicroCap |
| 12Stocks.com Small Cap Stocks Performances & Trends Daily | |||||||||
|
|  The overall Smart Investing & Trading Score is 56 (0-bearish to 100-bullish) which puts Small Cap index in short term neutral trend. The Smart Investing & Trading Score from previous trading session is 44 and hence an improvement of trend.
| ||||||||
Here are the Smart Investing & Trading Scores of the most requested small cap stocks at 12Stocks.com (click stock name for detailed review):
|


| 12Stocks.com: Investing in Smallcap Index with Stocks | |
|
The following table helps investors and traders sort through current performance and trends (as measured by Smart Investing & Trading Score) of various
stocks in the Smallcap Index. Quick View: Move mouse or cursor over stock symbol (ticker) to view short-term technical chart and over stock name to view long term chart. Click on  to add stock symbol to your watchlist and to add stock symbol to your watchlist and  to view watchlist. Click on any ticker or stock name for detailed market intelligence report for that stock. to view watchlist. Click on any ticker or stock name for detailed market intelligence report for that stock. |
12Stocks.com Performance of Stocks in Smallcap Index
| Ticker | Stock Name | Watchlist | Category | Recent Price | Smart Investing & Trading Score | Change % | YTD Change% |
| BMEA | Biomea Fusion |   | Health Care | 10.77 | 32 | 2.87 | -26.43% |
| TRUE | TrueCar | | Technology | 2.88 | 24 | 2.86 | -16.76% |
| NAT | Nordic American | | Transports | 3.97 | 49 | 2.85 | -5.48% |
| ATRO | Astronics | | Industrials | 16.58 | 32 | 2.85 | -4.82% |
| ORGO | Organogenesis | | Health Care | 2.35 | 57 | 2.84 | -42.54% |
| REI | Ring Energy | | Energy | 2.00 | 43 | 2.83 | 36.99% |
| PDFS | PDF Solutions | | Technology | 31.04 | 32 | 2.82 | -3.42% |
| SRI | Stoneridge | | Consumer Staples | 15.78 | 17 | 2.80 | -19.37% |
| AMAL | Amalgamated Bank | | Financials | 24.60 | 64 | 2.80 | -8.69% |
| VCTR | Victory Capital | | Financials | 51.58 | 80 | 2.80 | 49.77% |
| BIGC | BigCommerce | | Technology | 5.88 | 42 | 2.80 | -39.63% |
| UCTT | Ultra Clean | | Technology | 41.96 | 63 | 2.79 | 22.91% |
| IESC | IES | | Industrials | 131.11 | 80 | 2.79 | 65.50% |
| VICR | Vicor | | Technology | 34.41 | 17 | 2.78 | -23.43% |
| ELA | Envela | | Services & Goods | 4.43 | 68 | 2.78 | -8.85% |
| LICY | Li-Cycle | | Industrials | 0.68 | 61 | 2.78 | 8.62% |
| NFBK | Northfield Bancorp | | Financials | 8.52 | 42 | 2.77 | -32.27% |
| UDMY | Udemy | | Consumer Staples | 10.19 | 49 | 2.77 | -31.55% |
| KALV | KalVista | | Health Care | 10.78 | 7 | 2.76 | -12.00% |
| CRS | Carpenter | | Industrials | 84.00 | 100 | 2.75 | 18.64% |
| FOXF | Fox Factory | | Consumer Staples | 40.45 | 37 | 2.74 | -40.06% |
| BWMN | Bowman Consulting | | Industrials | 32.97 | 65 | 2.74 | -6.36% |
| SLDP | Solid Power | | Industrials | 1.69 | 68 | 2.74 | 18.25% |
| BH | Biglari | | Services & Goods | 206.85 | 83 | 2.73 | 25.42% |
| KODK | Eastman Kodak | | Technology | 4.52 | 46 | 2.73 | 15.90% |


| Too many stocks? View smallcap stocks filtered by marketcap & sector |
| Marketcap: All SmallCap Stocks (default-no microcap), Large, Mid-Range, Small |
| Smallcap Sector: Tech, Finance, Energy, Staples, Retail, Industrial, Materials, & Medical |
|
Get the most comprehensive stock market coverage daily at 12Stocks.com ➞ Best Stocks Today ➞ Best Stocks Weekly ➞ Best Stocks Year-to-Date ➞ Best Stocks Trends ➞  Best Stocks Today 12Stocks.com Best Nasdaq Stocks ➞ Best S&P 500 Stocks ➞ Best Tech Stocks ➞ Best Biotech Stocks ➞ |
| Detailed Overview of SmallCap Stocks |
| SmallCap Technical Overview, Leaders & Laggards, Top SmallCap ETF Funds & Detailed SmallCap Stocks List, Charts, Trends & More |
| Smallcap: Technical Analysis, Trends & YTD Performance | |
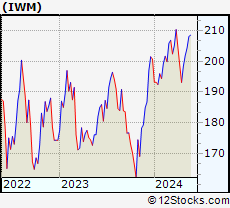
| SmallCap segment as represented by
IWM, an exchange-traded fund [ETF], holds basket of thousands of smallcap stocks from across all major sectors of the US stock market. The smallcap index (contains stocks like Riverbed & Sotheby's) is down by -1.16% and is currently underperforming the overall market by -7.3% year-to-date. Below is a quick view of technical charts and trends: | |
 IWM Weekly Chart |
|
| Long Term Trend: Good | |
| Medium Term Trend: Not Good | |
 IWM Daily Chart |
|
| Short Term Trend: Very Good | |
| Overall Trend Score: 56 | |
| YTD Performance: -1.16% | |
| **Trend Scores & Views Are Only For Educational Purposes And Not For Investing | |
| 12Stocks.com: Top Performing Small Cap Index Stocks | ||||||||||||||||||||||||||||||||||||||||||||||||
 The top performing Small Cap Index stocks year to date are
Now, more recently, over last week, the top performing Small Cap Index stocks on the move are


|
||||||||||||||||||||||||||||||||||||||||||||||||
| 12Stocks.com: Investing in Smallcap Index using Exchange Traded Funds | |
|
The following table shows list of key exchange traded funds (ETF) that
help investors track Smallcap index. The following list also includes leveraged ETF funds that track twice or thrice the daily returns of Smallcap indices. Short or inverse ETF funds move in the opposite direction to the index they track and are useful during market pullbacks or during bear markets. Quick View: Move mouse or cursor over ETF symbol (ticker) to view short-term technical chart and over ETF name to view long term chart. Click on ticker or stock name for detailed view. Click on to add stock symbol to your watchlist and to view watchlist. |
12Stocks.com List of ETFs that track Smallcap Index
| Ticker | ETF Name | Watchlist | Recent Price | Smart Investing & Trading Score | Change % | Week % | Year-to-date % |
| IWM | iShares Russell 2000 | | 198.39 | 56 | 0.97 | 2.72 | -1.16% |
| IJR | iShares Core S&P Small-Cap | | 105.65 | 85 | 0.75 | 2.35 | -2.4% |
| VTWO | Vanguard Russell 2000 ETF | | 80.22 | 70 | 0.97 | 2.74 | -1.09% |
| IWN | iShares Russell 2000 Value | | 151.14 | 75 | 0.64 | 2.27 | -2.7% |
| IWO | iShares Russell 2000 Growth | | 253.09 | 58 | 1.29 | 3.18 | 0.34% |
| IJS | iShares S&P Small-Cap 600 Value | | 97.19 | 67 | 0.52 | 1.65 | -5.7% |
| IJT | iShares S&P Small-Cap 600 Growth | | 126.09 | 70 | 0.82 | 3.17 | 0.76% |
| XSLV | PowerShares S&P SmallCap Low Volatil ETF | | 42.72 | 80 | 0.42 | 1.28 | -3.24% |
| SAA | ProShares Ultra SmallCap600 | | 23.04 | 65 | 1.68 | 5.69 | -7.66% |
| SBB | ProShares Short SmallCap600 | | 16.39 | 33 | -0.70 | -2.7 | 2.86% |
| SDD | ProShares UltraShort SmallCap600 | | 19.35 | 35 | -1.17 | -4.87 | 5.01% |
| SMLV | SPDR SSGA US Small Cap Low Volatil ETF | | 107.52 | 80 | 0.18 | 1.35 | -4.44% |
| 12Stocks.com: Charts, Trends, Fundamental Data and Performances of SmallCap Stocks | |
|
We now take in-depth look at all SmallCap stocks including charts, multi-period performances and overall trends (as measured by Smart Investing & Trading Score). One can sort SmallCap stocks (click link to choose) by Daily, Weekly and by Year-to-Date performances. Also, one can sort by size of the company or by market capitalization. |
| Select Your Default Chart Type: | |||||
| |||||
| Click on stock symbol or name for detailed view. Click on to add stock symbol to your watchlist and to view watchlist. Quick View: Move mouse or cursor over "Daily" to quickly view daily technical stock chart and over "Weekly" to view weekly technical stock chart. | |||||

 | BMEA Biomea Fusion, Inc. |
| Sector: Health Care | |
| SubSector: Biotechnology | |
| MarketCap: 818 Millions | |
| Recent Price: 10.77 Smart Investing & Trading Score: 32 | |
| Day Percent Change: 2.87% Day Change: 0.30 | |
| Week Change: -0.74% Year-to-date Change: -26.4% | |
| BMEA Links: Profile News Message Board | |
| Charts:- Daily , Weekly | |
| Add BMEA to Watchlist: View: Get Complete BMEA Trend Analysis ➞ | |
 | TRUE TrueCar, Inc. |
| Sector: Technology | |
| SubSector: Internet Service Providers | |
| MarketCap: 244.18 Millions | |
| Recent Price: 2.88 Smart Investing & Trading Score: 24 | |
| Day Percent Change: 2.86% Day Change: 0.08 | |
| Week Change: -1.03% Year-to-date Change: -16.8% | |
| TRUE Links: Profile News Message Board | |
| Charts:- Daily , Weekly | |
| Add TRUE to Watchlist: View: Get Complete TRUE Trend Analysis ➞ | |
 | NAT Nordic American Tankers Limited |
| Sector: Transports | |
| SubSector: Shipping | |
| MarketCap: 416.114 Millions | |
| Recent Price: 3.97 Smart Investing & Trading Score: 49 | |
| Day Percent Change: 2.85% Day Change: 0.11 | |
| Week Change: 4.47% Year-to-date Change: -5.5% | |
| NAT Links: Profile News Message Board | |
| Charts:- Daily , Weekly | |
| Add NAT to Watchlist: View: Get Complete NAT Trend Analysis ➞ | |
 | ATRO Astronics Corporation |
| Sector: Industrials | |
| SubSector: Aerospace/Defense Products & Services | |
| MarketCap: 287.201 Millions | |
| Recent Price: 16.58 Smart Investing & Trading Score: 32 | |
| Day Percent Change: 2.85% Day Change: 0.46 | |
| Week Change: 3.5% Year-to-date Change: -4.8% | |
| ATRO Links: Profile News Message Board | |
| Charts:- Daily , Weekly | |
| Add ATRO to Watchlist: View: Get Complete ATRO Trend Analysis ➞ | |
 | ORGO Organogenesis Holdings Inc. |
| Sector: Health Care | |
| SubSector: Drugs - Generic | |
| MarketCap: 239.685 Millions | |
| Recent Price: 2.35 Smart Investing & Trading Score: 57 | |
| Day Percent Change: 2.84% Day Change: 0.06 | |
| Week Change: -19.24% Year-to-date Change: -42.5% | |
| ORGO Links: Profile News Message Board | |
| Charts:- Daily , Weekly | |
| Add ORGO to Watchlist: View: Get Complete ORGO Trend Analysis ➞ | |
 | REI Ring Energy, Inc. |
| Sector: Energy | |
| SubSector: Oil & Gas Drilling & Exploration | |
| MarketCap: 50.8139 Millions | |
| Recent Price: 2.00 Smart Investing & Trading Score: 43 | |
| Day Percent Change: 2.83% Day Change: 0.05 | |
| Week Change: -0.99% Year-to-date Change: 37.0% | |
| REI Links: Profile News Message Board | |
| Charts:- Daily , Weekly | |
| Add REI to Watchlist: View: Get Complete REI Trend Analysis ➞ | |
 | PDFS PDF Solutions, Inc. |
| Sector: Technology | |
| SubSector: Technical & System Software | |
| MarketCap: 345.1 Millions | |
| Recent Price: 31.04 Smart Investing & Trading Score: 32 | |
| Day Percent Change: 2.82% Day Change: 0.85 | |
| Week Change: 5.01% Year-to-date Change: -3.4% | |
| PDFS Links: Profile News Message Board | |
| Charts:- Daily , Weekly | |
| Add PDFS to Watchlist: View: Get Complete PDFS Trend Analysis ➞ | |
 | SRI Stoneridge, Inc. |
| Sector: Consumer Staples | |
| SubSector: Auto Parts | |
| MarketCap: 451.839 Millions | |
| Recent Price: 15.78 Smart Investing & Trading Score: 17 | |
| Day Percent Change: 2.80% Day Change: 0.43 | |
| Week Change: 1.09% Year-to-date Change: -19.4% | |
| SRI Links: Profile News Message Board | |
| Charts:- Daily , Weekly | |
| Add SRI to Watchlist: View: Get Complete SRI Trend Analysis ➞ | |
 | AMAL Amalgamated Bank |
| Sector: Financials | |
| SubSector: Regional - Northeast Banks | |
| MarketCap: 321.899 Millions | |
| Recent Price: 24.60 Smart Investing & Trading Score: 64 | |
| Day Percent Change: 2.80% Day Change: 0.67 | |
| Week Change: 9.53% Year-to-date Change: -8.7% | |
| AMAL Links: Profile News Message Board | |
| Charts:- Daily , Weekly | |
| Add AMAL to Watchlist: View: Get Complete AMAL Trend Analysis ➞ | |
 | VCTR Victory Capital Holdings, Inc. |
| Sector: Financials | |
| SubSector: Asset Management | |
| MarketCap: 1148.33 Millions | |
| Recent Price: 51.58 Smart Investing & Trading Score: 80 | |
| Day Percent Change: 2.80% Day Change: 1.41 | |
| Week Change: 8.59% Year-to-date Change: 49.8% | |
| VCTR Links: Profile News Message Board | |
| Charts:- Daily , Weekly | |
| Add VCTR to Watchlist: View: Get Complete VCTR Trend Analysis ➞ | |
 | BIGC BigCommerce Holdings, Inc. |
| Sector: Technology | |
| SubSector: Software Application | |
| MarketCap: 47587 Millions | |
| Recent Price: 5.88 Smart Investing & Trading Score: 42 | |
| Day Percent Change: 2.80% Day Change: 0.16 | |
| Week Change: -1.09% Year-to-date Change: -39.6% | |
| BIGC Links: Profile News Message Board | |
| Charts:- Daily , Weekly | |
| Add BIGC to Watchlist: View: Get Complete BIGC Trend Analysis ➞ | |
 | UCTT Ultra Clean Holdings, Inc. |
| Sector: Technology | |
| SubSector: Semiconductor Equipment & Materials | |
| MarketCap: 528.518 Millions | |
| Recent Price: 41.96 Smart Investing & Trading Score: 63 | |
| Day Percent Change: 2.79% Day Change: 1.14 | |
| Week Change: 7.62% Year-to-date Change: 22.9% | |
| UCTT Links: Profile News Message Board | |
| Charts:- Daily , Weekly | |
| Add UCTT to Watchlist: View: Get Complete UCTT Trend Analysis ➞ | |
 | IESC IES Holdings, Inc. |
| Sector: Industrials | |
| SubSector: General Contractors | |
| MarketCap: 380.963 Millions | |
| Recent Price: 131.11 Smart Investing & Trading Score: 80 | |
| Day Percent Change: 2.79% Day Change: 3.56 | |
| Week Change: 13.51% Year-to-date Change: 65.5% | |
| IESC Links: Profile News Message Board | |
| Charts:- Daily , Weekly | |
| Add IESC to Watchlist: View: Get Complete IESC Trend Analysis ➞ | |
 | VICR Vicor Corporation |
| Sector: Technology | |
| SubSector: Diversified Electronics | |
| MarketCap: 1526.76 Millions | |
| Recent Price: 34.41 Smart Investing & Trading Score: 17 | |
| Day Percent Change: 2.78% Day Change: 0.93 | |
| Week Change: 1.59% Year-to-date Change: -23.4% | |
| VICR Links: Profile News Message Board | |
| Charts:- Daily , Weekly | |
| Add VICR to Watchlist: View: Get Complete VICR Trend Analysis ➞ | |
 | ELA Envela Corporation |
| Sector: Services & Goods | |
| SubSector: Specialty Retail, Other | |
| MarketCap: 73.5944 Millions | |
| Recent Price: 4.43 Smart Investing & Trading Score: 68 | |
| Day Percent Change: 2.78% Day Change: 0.12 | |
| Week Change: 3.5% Year-to-date Change: -8.9% | |
| ELA Links: Profile News Message Board | |
| Charts:- Daily , Weekly | |
| Add ELA to Watchlist: View: Get Complete ELA Trend Analysis ➞ | |
 | LICY Li-Cycle Holdings Corp. |
| Sector: Industrials | |
| SubSector: Waste Management | |
| MarketCap: 959 Millions | |
| Recent Price: 0.68 Smart Investing & Trading Score: 61 | |
| Day Percent Change: 2.78% Day Change: 0.02 | |
| Week Change: 1.26% Year-to-date Change: 8.6% | |
| LICY Links: Profile News Message Board | |
| Charts:- Daily , Weekly | |
| Add LICY to Watchlist: View: Get Complete LICY Trend Analysis ➞ | |
 | NFBK Northfield Bancorp, Inc. (Staten Island, NY) |
| Sector: Financials | |
| SubSector: Regional - Northeast Banks | |
| MarketCap: 540.699 Millions | |
| Recent Price: 8.52 Smart Investing & Trading Score: 42 | |
| Day Percent Change: 2.77% Day Change: 0.23 | |
| Week Change: 0.12% Year-to-date Change: -32.3% | |
| NFBK Links: Profile News Message Board | |
| Charts:- Daily , Weekly | |
| Add NFBK to Watchlist: View: Get Complete NFBK Trend Analysis ➞ | |
 | UDMY Udemy, Inc. |
| Sector: Consumer Staples | |
| SubSector: Education & Training Services | |
| MarketCap: 1570 Millions | |
| Recent Price: 10.19 Smart Investing & Trading Score: 49 | |
| Day Percent Change: 2.77% Day Change: 0.28 | |
| Week Change: 2.67% Year-to-date Change: -31.6% | |
| UDMY Links: Profile News Message Board | |
| Charts:- Daily , Weekly | |
| Add UDMY to Watchlist: View: Get Complete UDMY Trend Analysis ➞ | |
 | KALV KalVista Pharmaceuticals, Inc. |
| Sector: Health Care | |
| SubSector: Biotechnology | |
| MarketCap: 138.385 Millions | |
| Recent Price: 10.78 Smart Investing & Trading Score: 7 | |
| Day Percent Change: 2.76% Day Change: 0.29 | |
| Week Change: -6.83% Year-to-date Change: -12.0% | |
| KALV Links: Profile News Message Board | |
| Charts:- Daily , Weekly | |
| Add KALV to Watchlist: View: Get Complete KALV Trend Analysis ➞ | |
 | CRS Carpenter Technology Corporation |
| Sector: Industrials | |
| SubSector: Metal Fabrication | |
| MarketCap: 853.35 Millions | |
| Recent Price: 84.00 Smart Investing & Trading Score: 100 | |
| Day Percent Change: 2.75% Day Change: 2.25 | |
| Week Change: 7.64% Year-to-date Change: 18.6% | |
| CRS Links: Profile News Message Board | |
| Charts:- Daily , Weekly | |
| Add CRS to Watchlist: View: Get Complete CRS Trend Analysis ➞ | |
 | FOXF Fox Factory Holding Corp. |
| Sector: Consumer Staples | |
| SubSector: Recreational Vehicles | |
| MarketCap: 2093.29 Millions | |
| Recent Price: 40.45 Smart Investing & Trading Score: 37 | |
| Day Percent Change: 2.74% Day Change: 1.08 | |
| Week Change: -0.1% Year-to-date Change: -40.1% | |
| FOXF Links: Profile News Message Board | |
| Charts:- Daily , Weekly | |
| Add FOXF to Watchlist: View: Get Complete FOXF Trend Analysis ➞ | |
 | BWMN Bowman Consulting Group Ltd. |
| Sector: Industrials | |
| SubSector: Engineering & Construction | |
| MarketCap: 443 Millions | |
| Recent Price: 32.97 Smart Investing & Trading Score: 65 | |
| Day Percent Change: 2.74% Day Change: 0.88 | |
| Week Change: 8.99% Year-to-date Change: -6.4% | |
| BWMN Links: Profile News Message Board | |
| Charts:- Daily , Weekly | |
| Add BWMN to Watchlist: View: Get Complete BWMN Trend Analysis ➞ | |
 | SLDP Solid Power, Inc. |
| Sector: Industrials | |
| SubSector: Electrical Equipment & Parts | |
| MarketCap: 445 Millions | |
| Recent Price: 1.69 Smart Investing & Trading Score: 68 | |
| Day Percent Change: 2.74% Day Change: 0.05 | |
| Week Change: 2.74% Year-to-date Change: 18.3% | |
| SLDP Links: Profile News Message Board | |
| Charts:- Daily , Weekly | |
| Add SLDP to Watchlist: View: Get Complete SLDP Trend Analysis ➞ | |
 | BH Biglari Holdings Inc. |
| Sector: Services & Goods | |
| SubSector: Restaurants | |
| MarketCap: 149.07 Millions | |
| Recent Price: 206.85 Smart Investing & Trading Score: 83 | |
| Day Percent Change: 2.73% Day Change: 5.49 | |
| Week Change: 3.56% Year-to-date Change: 25.4% | |
| BH Links: Profile News Message Board | |
| Charts:- Daily , Weekly | |
| Add BH to Watchlist: View: Get Complete BH Trend Analysis ➞ | |
 | KODK Eastman Kodak Company |
| Sector: Technology | |
| SubSector: Electronic Equipment | |
| MarketCap: 78.47 Millions | |
| Recent Price: 4.52 Smart Investing & Trading Score: 46 | |
| Day Percent Change: 2.73% Day Change: 0.12 | |
| Week Change: -2.16% Year-to-date Change: 15.9% | |
| KODK Links: Profile News Message Board | |
| Charts:- Daily , Weekly | |
| Add KODK to Watchlist: View: Get Complete KODK Trend Analysis ➞ | |
| Too many stocks? View smallcap stocks filtered by marketcap & sector |
| Marketcap: All SmallCap Stocks (default-no microcap), Large, Mid-Range, Small & MicroCap |
| Sector: Tech, Finance, Energy, Staples, Retail, Industrial, Materials, Utilities & Medical |
|
Best Stocks Today 12Stocks.com |
© 2024 12Stocks.com Terms & Conditions Privacy Contact Us
All Information Provided Only For Education And Not To Be Used For Investing or Trading. See Terms & Conditions


One More Thing ... Get Best Stocks Delivered Daily!
Never Ever Miss A Move With Our Top Ten Stocks Lists
Find Best Stocks In Any Market - Bull or Bear Market
Take A Peek At Our Top Ten Stocks Lists: Daily, Weekly, Year-to-Date & Top Trends
Find Best Stocks In Any Market - Bull or Bear Market
Take A Peek At Our Top Ten Stocks Lists: Daily, Weekly, Year-to-Date & Top Trends
Smallcap Stocks With Best Up Trends [0-bearish to 100-bullish]: Cullinan Oncology[100], NextNav [100], MBIA [100], Reservoir Media[100], B. Riley[100], Braemar Hotels[100], Pactiv Evergreen[100], Wolverine World[100], Haemonetics [100], Benchmark Electronics[100], Uniti Group[100]
Best Smallcap Stocks Year-to-Date:
CareMax [568.04%], Janux [341.65%], Viking [299.3%], Alpine Immune[239.21%], Longboard [222.09%], Super Micro[201.64%], Avidity Biosciences[166.81%], Arcutis Bio[162.23%], Vera [156.27%], Cullinan Oncology[147.08%], Hippo [141.6%] Best Smallcap Stocks This Week:
Matterport [170.98%], B. Riley[84.19%], Cullinan Oncology[60.86%], Seres [47.35%], Zura Bio[38.67%], Universal Logistics[36.84%], Tutor Perini[33.89%], Riot Blockchain[30.67%], IGM Biosciences[30.56%], Impinj [29.74%], Sonic Automotive[28.14%] Best Smallcap Stocks Daily:
Universal Logistics[39.37%], Zura Bio[31.90%], Cullinan Oncology[30.86%], Tutor Perini[28.01%], IGM Biosciences[23.36%], U.S. Silica[21.67%], Maxeon Solar[20.17%], Exponent [19.49%], TPI Composites[16.32%], OptimizeRx [14.84%], Solaris Oilfield[13.95%]