
 Login Sign Up


| |||||
 |  | ||||

| 12Stocks.com Market Intelligence |
Best SmallCap Stocks
|
| In a hurry? Small Cap Stock Lists: Performance Trends Table, Stock Charts
Sort Small Cap stocks: Daily, Weekly, Year-to-Date, Market Cap & Trends. Filter Small Cap stocks list by sector: Show all, Tech, Finance, Energy, Staples, Retail, Industrial, Materials, Utilities and HealthCare Filter Small Cap stocks list by size: All Large Medium Small and MicroCap |
| 12Stocks.com Small Cap Stocks Performances & Trends Daily | |||||||||
|
|  The overall Smart Investing & Trading Score is 23 (0-bearish to 100-bullish) which puts Small Cap index in short term bearish to neutral trend. The Smart Investing & Trading Score from previous trading session is 13 and an improvement of trend continues.
| ||||||||
Here are the Smart Investing & Trading Scores of the most requested small cap stocks at 12Stocks.com (click stock name for detailed review):
|


| 12Stocks.com: Investing in Smallcap Index with Stocks | |
|
The following table helps investors and traders sort through current performance and trends (as measured by Smart Investing & Trading Score) of various
stocks in the Smallcap Index. Quick View: Move mouse or cursor over stock symbol (ticker) to view short-term technical chart and over stock name to view long term chart. Click on  to add stock symbol to your watchlist and to add stock symbol to your watchlist and  to view watchlist. Click on any ticker or stock name for detailed market intelligence report for that stock. to view watchlist. Click on any ticker or stock name for detailed market intelligence report for that stock. |
12Stocks.com Performance of Stocks in Smallcap Index
| Ticker | Stock Name | Watchlist | Category | Recent Price | Smart Investing & Trading Score | Change % | YTD Change% |
| BBUC | Brookfield Business |   | Financials | 20.91 | 32 | -0.29 | -9.83% |
| BKE | Buckle | | Services & Goods | 36.57 | 25 | -0.30 | -23.04% |
| BCC | Boise Cascade | | Industrials | 134.24 | 0 | -0.30 | 3.77% |
| HRI | Herc | | Transports | 150.32 | 36 | -0.30 | 0.96% |
| PSN | Parsons | | Industrials | 77.56 | 41 | -0.30 | 23.69% |
| AIT | Applied Industrial | | Services & Goods | 183.43 | 36 | -0.31 | 6.22% |
| OVID | Ovid | | Health Care | 3.22 | 40 | -0.31 | 0.00% |
| VITL | Vital Farms | | Consumer Staples | 25.14 | 59 | -0.32 | 60.13% |
| AMWD | American Woodmark | | Consumer Staples | 89.80 | 10 | -0.34 | -3.29% |
| ETNB | 89bio | | Health Care | 8.85 | 10 | -0.34 | -20.77% |
| WEYS | Weyco Group | | Consumer Staples | 28.29 | 25 | -0.35 | -9.79% |
| PHR | Phreesia | | Technology | 22.54 | 10 | -0.35 | -2.63% |
| SMTC | Semtech | | Technology | 31.93 | 56 | -0.36 | 45.76% |
| EDIT | Editas Medicine | | Health Care | 5.53 | 10 | -0.36 | -45.41% |
| MORF | Morphic Holding | | Health Care | 27.41 | 10 | -0.36 | -5.09% |
| GEO | GEO Group | | Financials | 14.72 | 51 | -0.37 | 35.87% |
| TTGT | TechTarget | | Technology | 27.15 | 20 | -0.37 | -22.12% |
| FOXF | Fox Factory | | Consumer Staples | 40.59 | 20 | -0.37 | -39.85% |
| CSWI | CSW Industrials | | Industrials | 233.10 | 46 | -0.37 | 12.39% |
| VZIO | VIZIO Holding | | Technology | 10.74 | 54 | -0.37 | 39.36% |
| COHU | Cohu | | Technology | 29.13 | 10 | -0.38 | -17.69% |
| UFPT | UFP | | Consumer Staples | 216.92 | 41 | -0.38 | 26.09% |
| ADUS | Addus HomeCare | | Health Care | 96.80 | 61 | -0.38 | 4.25% |
| ARLO | Arlo | | Technology | 10.53 | 36 | -0.38 | 10.61% |
| USCB | USCB Financial | | Financials | 10.59 | 25 | -0.38 | -13.76% |
| For chart view version of above stock list: Chart View ➞ 0 - 25 , 25 - 50 , 50 - 75 , 75 - 100 , 100 - 125 , 125 - 150 , 150 - 175 , 175 - 200 , 200 - 225 , 225 - 250 , 250 - 275 , 275 - 300 , 300 - 325 , 325 - 350 , 350 - 375 , 375 - 400 , 400 - 425 , 425 - 450 , 450 - 475 , 475 - 500 , 500 - 525 , 525 - 550 , 550 - 575 , 575 - 600 , 600 - 625 , 625 - 650 , 650 - 675 , 675 - 700 , 700 - 725 , 725 - 750 , 750 - 775 , 775 - 800 , 800 - 825 , 825 - 850 , 850 - 875 , 875 - 900 , 900 - 925 , 925 - 950 , 950 - 975 , 975 - 1000 , 1000 - 1025 , 1025 - 1050 , 1050 - 1075 , 1075 - 1100 , 1100 - 1125 , 1125 - 1150 , 1150 - 1175 , 1175 - 1200 , 1200 - 1225 , 1225 - 1250 , 1250 - 1275 , 1275 - 1300 , 1300 - 1325 , 1325 - 1350 , 1350 - 1375 , 1375 - 1400 , 1400 - 1425 , 1425 - 1450 , 1450 - 1475 , 1475 - 1500 , 1500 - 1525 , 1525 - 1550 , 1550 - 1575 , 1575 - 1600 , 1600 - 1625 | ||
 | Click To Change The Sort Order: By Market Cap or Company Size Performance: Year-to-date, Week and Day |  |
| Too many stocks? View smallcap stocks filtered by marketcap & sector |
| Marketcap: All SmallCap Stocks (default-no microcap), Large, Mid-Range, Small |
| Smallcap Sector: Tech, Finance, Energy, Staples, Retail, Industrial, Materials, & Medical |
|
Get the most comprehensive stock market coverage daily at 12Stocks.com ➞ Best Stocks Today ➞ Best Stocks Weekly ➞ Best Stocks Year-to-Date ➞ Best Stocks Trends ➞  Best Stocks Today 12Stocks.com Best Nasdaq Stocks ➞ Best S&P 500 Stocks ➞ Best Tech Stocks ➞ Best Biotech Stocks ➞ |
| Detailed Overview of SmallCap Stocks |
| SmallCap Technical Overview, Leaders & Laggards, Top SmallCap ETF Funds & Detailed SmallCap Stocks List, Charts, Trends & More |
| Smallcap: Technical Analysis, Trends & YTD Performance | |
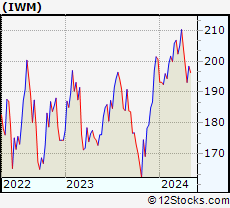
| SmallCap segment as represented by
IWM, an exchange-traded fund [ETF], holds basket of thousands of smallcap stocks from across all major sectors of the US stock market. The smallcap index (contains stocks like Riverbed & Sotheby's) is down by -3.67% and is currently underperforming the overall market by -7.75% year-to-date. Below is a quick view of technical charts and trends: | |
 IWM Weekly Chart |
|
| Long Term Trend: Good | |
| Medium Term Trend: Not Good | |
 IWM Daily Chart |
|
| Short Term Trend: Deteriorating | |
| Overall Trend Score: 23 | |
| YTD Performance: -3.67% | |
| **Trend Scores & Views Are Only For Educational Purposes And Not For Investing | |
| 12Stocks.com: Top Performing Small Cap Index Stocks | ||||||||||||||||||||||||||||||||||||||||||||||||
 The top performing Small Cap Index stocks year to date are
Now, more recently, over last week, the top performing Small Cap Index stocks on the move are


|
||||||||||||||||||||||||||||||||||||||||||||||||
| 12Stocks.com: Investing in Smallcap Index using Exchange Traded Funds | |
|
The following table shows list of key exchange traded funds (ETF) that
help investors track Smallcap index. The following list also includes leveraged ETF funds that track twice or thrice the daily returns of Smallcap indices. Short or inverse ETF funds move in the opposite direction to the index they track and are useful during market pullbacks or during bear markets. Quick View: Move mouse or cursor over ETF symbol (ticker) to view short-term technical chart and over ETF name to view long term chart. Click on ticker or stock name for detailed view. Click on to add stock symbol to your watchlist and to view watchlist. |
12Stocks.com List of ETFs that track Smallcap Index
| Ticker | ETF Name | Watchlist | Recent Price | Smart Investing & Trading Score | Change % | Week % | Year-to-date % |
| IWM | iShares Russell 2000 | | 193.34 | 23 | 0.26 | -2.69 | -3.67% |
| SAA | ProShares Ultra SmallCap600 | | 21.83 | 18 | 0.97 | -3.24 | -12.51% |
| SDD | ProShares UltraShort SmallCap600 | | 20.42 | 76 | -1.30 | 2.97 | 10.82% |
| SMLV | SPDR SSGA US Small Cap Low Volatil ETF | | 105.38 | 32 | 1.49 | 0.35 | -6.35% |
| SBB | ProShares Short SmallCap600 | | 16.80 | 76 | -1.08 | 1.51 | 5.44% |
| 12Stocks.com: Charts, Trends, Fundamental Data and Performances of SmallCap Stocks | |
|
We now take in-depth look at all SmallCap stocks including charts, multi-period performances and overall trends (as measured by Smart Investing & Trading Score). One can sort SmallCap stocks (click link to choose) by Daily, Weekly and by Year-to-Date performances. Also, one can sort by size of the company or by market capitalization. |
| Select Your Default Chart Type: | |||||
| |||||
| Click on stock symbol or name for detailed view. Click on to add stock symbol to your watchlist and to view watchlist. Quick View: Move mouse or cursor over "Daily" to quickly view daily technical stock chart and over "Weekly" to view weekly technical stock chart. | |||||

 | BBUC Brookfield Business Corporation |
| Sector: Financials | |
| SubSector: Asset Management | |
| MarketCap: 1810 Millions | |
| Recent Price: 20.91 Smart Investing & Trading Score: 32 | |
| Day Percent Change: -0.29% Day Change: -0.06 | |
| Week Change: 0.48% Year-to-date Change: -9.8% | |
| BBUC Links: Profile News Message Board | |
| Charts:- Daily , Weekly | |
| Add BBUC to Watchlist: View: Get Complete BBUC Trend Analysis ➞ | |
 | BKE The Buckle, Inc. |
| Sector: Services & Goods | |
| SubSector: Apparel Stores | |
| MarketCap: 913.808 Millions | |
| Recent Price: 36.57 Smart Investing & Trading Score: 25 | |
| Day Percent Change: -0.30% Day Change: -0.11 | |
| Week Change: -0.71% Year-to-date Change: -23.0% | |
| BKE Links: Profile News Message Board | |
| Charts:- Daily , Weekly | |
| Add BKE to Watchlist: View: Get Complete BKE Trend Analysis ➞ | |
 | BCC Boise Cascade Company |
| Sector: Industrials | |
| SubSector: Lumber, Wood Production | |
| MarketCap: 963.938 Millions | |
| Recent Price: 134.24 Smart Investing & Trading Score: 0 | |
| Day Percent Change: -0.30% Day Change: -0.41 | |
| Week Change: -10.5% Year-to-date Change: 3.8% | |
| BCC Links: Profile News Message Board | |
| Charts:- Daily , Weekly | |
| Add BCC to Watchlist: View: Get Complete BCC Trend Analysis ➞ | |
 | HRI Herc Holdings Inc. |
| Sector: Transports | |
| SubSector: Rental & Leasing Services | |
| MarketCap: 469.344 Millions | |
| Recent Price: 150.32 Smart Investing & Trading Score: 36 | |
| Day Percent Change: -0.30% Day Change: -0.45 | |
| Week Change: -4.77% Year-to-date Change: 1.0% | |
| HRI Links: Profile News Message Board | |
| Charts:- Daily , Weekly | |
| Add HRI to Watchlist: View: Get Complete HRI Trend Analysis ➞ | |
 | PSN Parsons Corporation |
| Sector: Industrials | |
| SubSector: Diversified Machinery | |
| MarketCap: 3021.16 Millions | |
| Recent Price: 77.56 Smart Investing & Trading Score: 41 | |
| Day Percent Change: -0.30% Day Change: -0.23 | |
| Week Change: -3.54% Year-to-date Change: 23.7% | |
| PSN Links: Profile News Message Board | |
| Charts:- Daily , Weekly | |
| Add PSN to Watchlist: View: Get Complete PSN Trend Analysis ➞ | |
 | AIT Applied Industrial Technologies, Inc. |
| Sector: Services & Goods | |
| SubSector: Industrial Equipment Wholesale | |
| MarketCap: 1531.58 Millions | |
| Recent Price: 183.43 Smart Investing & Trading Score: 36 | |
| Day Percent Change: -0.31% Day Change: -0.56 | |
| Week Change: -4.01% Year-to-date Change: 6.2% | |
| AIT Links: Profile News Message Board | |
| Charts:- Daily , Weekly | |
| Add AIT to Watchlist: View: Get Complete AIT Trend Analysis ➞ | |
 | OVID Ovid Therapeutics Inc. |
| Sector: Health Care | |
| SubSector: Biotechnology | |
| MarketCap: 130.385 Millions | |
| Recent Price: 3.22 Smart Investing & Trading Score: 40 | |
| Day Percent Change: -0.31% Day Change: -0.01 | |
| Week Change: 0.63% Year-to-date Change: 0.0% | |
| OVID Links: Profile News Message Board | |
| Charts:- Daily , Weekly | |
| Add OVID to Watchlist: View: Get Complete OVID Trend Analysis ➞ | |
 | VITL Vital Farms, Inc. |
| Sector: Consumer Staples | |
| SubSector: Farm Products | |
| MarketCap: 10347 Millions | |
| Recent Price: 25.14 Smart Investing & Trading Score: 59 | |
| Day Percent Change: -0.32% Day Change: -0.08 | |
| Week Change: 0.28% Year-to-date Change: 60.1% | |
| VITL Links: Profile News Message Board | |
| Charts:- Daily , Weekly | |
| Add VITL to Watchlist: View: Get Complete VITL Trend Analysis ➞ | |
 | AMWD American Woodmark Corporation |
| Sector: Consumer Staples | |
| SubSector: Home Furnishings & Fixtures | |
| MarketCap: 958.435 Millions | |
| Recent Price: 89.80 Smart Investing & Trading Score: 10 | |
| Day Percent Change: -0.34% Day Change: -0.30 | |
| Week Change: -6.48% Year-to-date Change: -3.3% | |
| AMWD Links: Profile News Message Board | |
| Charts:- Daily , Weekly | |
| Add AMWD to Watchlist: View: Get Complete AMWD Trend Analysis ➞ | |
 | ETNB 89bio, Inc. |
| Sector: Health Care | |
| SubSector: Biotechnology | |
| MarketCap: 517.485 Millions | |
| Recent Price: 8.85 Smart Investing & Trading Score: 10 | |
| Day Percent Change: -0.34% Day Change: -0.03 | |
| Week Change: -12.72% Year-to-date Change: -20.8% | |
| ETNB Links: Profile News Message Board | |
| Charts:- Daily , Weekly | |
| Add ETNB to Watchlist: View: Get Complete ETNB Trend Analysis ➞ | |
 | WEYS Weyco Group, Inc. |
| Sector: Consumer Staples | |
| SubSector: Textile - Apparel Footwear & Accessories | |
| MarketCap: 198.87 Millions | |
| Recent Price: 28.29 Smart Investing & Trading Score: 25 | |
| Day Percent Change: -0.35% Day Change: -0.10 | |
| Week Change: -2.75% Year-to-date Change: -9.8% | |
| WEYS Links: Profile News Message Board | |
| Charts:- Daily , Weekly | |
| Add WEYS to Watchlist: View: Get Complete WEYS Trend Analysis ➞ | |
 | PHR Phreesia, Inc. |
| Sector: Technology | |
| SubSector: Healthcare Information Services | |
| MarketCap: 810.255 Millions | |
| Recent Price: 22.54 Smart Investing & Trading Score: 10 | |
| Day Percent Change: -0.35% Day Change: -0.08 | |
| Week Change: -4.41% Year-to-date Change: -2.6% | |
| PHR Links: Profile News Message Board | |
| Charts:- Daily , Weekly | |
| Add PHR to Watchlist: View: Get Complete PHR Trend Analysis ➞ | |
 | SMTC Semtech Corporation |
| Sector: Technology | |
| SubSector: Semiconductor - Integrated Circuits | |
| MarketCap: 2285 Millions | |
| Recent Price: 31.93 Smart Investing & Trading Score: 56 | |
| Day Percent Change: -0.36% Day Change: -0.11 | |
| Week Change: -2.16% Year-to-date Change: 45.8% | |
| SMTC Links: Profile News Message Board | |
| Charts:- Daily , Weekly | |
| Add SMTC to Watchlist: View: Get Complete SMTC Trend Analysis ➞ | |
 | EDIT Editas Medicine, Inc. |
| Sector: Health Care | |
| SubSector: Biotechnology | |
| MarketCap: 1194.95 Millions | |
| Recent Price: 5.53 Smart Investing & Trading Score: 10 | |
| Day Percent Change: -0.36% Day Change: -0.02 | |
| Week Change: -10.95% Year-to-date Change: -45.4% | |
| EDIT Links: Profile News Message Board | |
| Charts:- Daily , Weekly | |
| Add EDIT to Watchlist: View: Get Complete EDIT Trend Analysis ➞ | |
 | MORF Morphic Holding, Inc. |
| Sector: Health Care | |
| SubSector: Biotechnology | |
| MarketCap: 484.885 Millions | |
| Recent Price: 27.41 Smart Investing & Trading Score: 10 | |
| Day Percent Change: -0.36% Day Change: -0.10 | |
| Week Change: -4.36% Year-to-date Change: -5.1% | |
| MORF Links: Profile News Message Board | |
| Charts:- Daily , Weekly | |
| Add MORF to Watchlist: View: Get Complete MORF Trend Analysis ➞ | |
 | GEO The GEO Group, Inc. |
| Sector: Financials | |
| SubSector: REIT - Healthcare Facilities | |
| MarketCap: 1678.34 Millions | |
| Recent Price: 14.72 Smart Investing & Trading Score: 51 | |
| Day Percent Change: -0.37% Day Change: -0.05 | |
| Week Change: -4.26% Year-to-date Change: 35.9% | |
| GEO Links: Profile News Message Board | |
| Charts:- Daily , Weekly | |
| Add GEO to Watchlist: View: Get Complete GEO Trend Analysis ➞ | |
 | TTGT TechTarget, Inc. |
| Sector: Technology | |
| SubSector: Internet Information Providers | |
| MarketCap: 560.78 Millions | |
| Recent Price: 27.15 Smart Investing & Trading Score: 20 | |
| Day Percent Change: -0.37% Day Change: -0.10 | |
| Week Change: -2.65% Year-to-date Change: -22.1% | |
| TTGT Links: Profile News Message Board | |
| Charts:- Daily , Weekly | |
| Add TTGT to Watchlist: View: Get Complete TTGT Trend Analysis ➞ | |
 | FOXF Fox Factory Holding Corp. |
| Sector: Consumer Staples | |
| SubSector: Recreational Vehicles | |
| MarketCap: 2093.29 Millions | |
| Recent Price: 40.59 Smart Investing & Trading Score: 20 | |
| Day Percent Change: -0.37% Day Change: -0.15 | |
| Week Change: -4.94% Year-to-date Change: -39.9% | |
| FOXF Links: Profile News Message Board | |
| Charts:- Daily , Weekly | |
| Add FOXF to Watchlist: View: Get Complete FOXF Trend Analysis ➞ | |
 | CSWI CSW Industrials, Inc. |
| Sector: Industrials | |
| SubSector: Diversified Machinery | |
| MarketCap: 985.616 Millions | |
| Recent Price: 233.10 Smart Investing & Trading Score: 46 | |
| Day Percent Change: -0.37% Day Change: -0.88 | |
| Week Change: -1.24% Year-to-date Change: 12.4% | |
| CSWI Links: Profile News Message Board | |
| Charts:- Daily , Weekly | |
| Add CSWI to Watchlist: View: Get Complete CSWI Trend Analysis ➞ | |
 | VZIO VIZIO Holding Corp. |
| Sector: Technology | |
| SubSector: Consumer Electronics | |
| MarketCap: 1300 Millions | |
| Recent Price: 10.74 Smart Investing & Trading Score: 54 | |
| Day Percent Change: -0.37% Day Change: -0.04 | |
| Week Change: 0.51% Year-to-date Change: 39.4% | |
| VZIO Links: Profile News Message Board | |
| Charts:- Daily , Weekly | |
| Add VZIO to Watchlist: View: Get Complete VZIO Trend Analysis ➞ | |
 | COHU Cohu, Inc. |
| Sector: Technology | |
| SubSector: Semiconductor Equipment & Materials | |
| MarketCap: 519.518 Millions | |
| Recent Price: 29.13 Smart Investing & Trading Score: 10 | |
| Day Percent Change: -0.38% Day Change: -0.11 | |
| Week Change: -6.84% Year-to-date Change: -17.7% | |
| COHU Links: Profile News Message Board | |
| Charts:- Daily , Weekly | |
| Add COHU to Watchlist: View: Get Complete COHU Trend Analysis ➞ | |
 | UFPT UFP Technologies, Inc. |
| Sector: Consumer Staples | |
| SubSector: Packaging & Containers | |
| MarketCap: 284.053 Millions | |
| Recent Price: 216.92 Smart Investing & Trading Score: 41 | |
| Day Percent Change: -0.38% Day Change: -0.82 | |
| Week Change: -5.13% Year-to-date Change: 26.1% | |
| UFPT Links: Profile News Message Board | |
| Charts:- Daily , Weekly | |
| Add UFPT to Watchlist: View: Get Complete UFPT Trend Analysis ➞ | |
 | ADUS Addus HomeCare Corporation |
| Sector: Health Care | |
| SubSector: Home Health Care | |
| MarketCap: 994.795 Millions | |
| Recent Price: 96.80 Smart Investing & Trading Score: 61 | |
| Day Percent Change: -0.38% Day Change: -0.36 | |
| Week Change: -1.08% Year-to-date Change: 4.3% | |
| ADUS Links: Profile News Message Board | |
| Charts:- Daily , Weekly | |
| Add ADUS to Watchlist: View: Get Complete ADUS Trend Analysis ➞ | |
 | ARLO Arlo Technologies, Inc. |
| Sector: Technology | |
| SubSector: Security Software & Services | |
| MarketCap: 163.317 Millions | |
| Recent Price: 10.53 Smart Investing & Trading Score: 36 | |
| Day Percent Change: -0.38% Day Change: -0.04 | |
| Week Change: -6.9% Year-to-date Change: 10.6% | |
| ARLO Links: Profile News Message Board | |
| Charts:- Daily , Weekly | |
| Add ARLO to Watchlist: View: Get Complete ARLO Trend Analysis ➞ | |
 | USCB USCB Financial Holdings, Inc. |
| Sector: Financials | |
| SubSector: Banks - Regional | |
| MarketCap: 198 Millions | |
| Recent Price: 10.59 Smart Investing & Trading Score: 25 | |
| Day Percent Change: -0.38% Day Change: -0.04 | |
| Week Change: 0.86% Year-to-date Change: -13.8% | |
| USCB Links: Profile News Message Board | |
| Charts:- Daily , Weekly | |
| Add USCB to Watchlist: View: Get Complete USCB Trend Analysis ➞ | |
| Too many stocks? View smallcap stocks filtered by marketcap & sector |
| Marketcap: All SmallCap Stocks (default-no microcap), Large, Mid-Range, Small & MicroCap |
| Sector: Tech, Finance, Energy, Staples, Retail, Industrial, Materials, Utilities & Medical |
|
Best Stocks Today 12Stocks.com |
© 2024 12Stocks.com Terms & Conditions Privacy Contact Us
All Information Provided Only For Education And Not To Be Used For Investing or Trading. See Terms & Conditions


One More Thing ... Get Best Stocks Delivered Daily!
Never Ever Miss A Move With Our Top Ten Stocks Lists
Find Best Stocks In Any Market - Bull or Bear Market
Take A Peek At Our Top Ten Stocks Lists: Daily, Weekly, Year-to-Date & Top Trends
Find Best Stocks In Any Market - Bull or Bear Market
Take A Peek At Our Top Ten Stocks Lists: Daily, Weekly, Year-to-Date & Top Trends
Smallcap Stocks With Best Up Trends [0-bearish to 100-bullish]: Humacyte [100], Victory Capital[100], Century Aluminum[100], Oscar Health[100], Mercury General[100], United Fire[100], Gannett Co[100], Old Second[100], Portland General[100], Lantheus [100], Target Hospitality[100]
Best Smallcap Stocks Year-to-Date:
Agenus [581.24%], CareMax [456.7%], Janux [343.37%], Alpine Immune[238.42%], Longboard [194.11%], Arcutis Bio[184.06%], Super Micro[176.22%], Avidity Biosciences[153.65%], Vera [147.87%], Hippo [123.38%], Stoke [121.48%] Best Smallcap Stocks This Week:
Macatawa Bank[44.89%], Humacyte [39.24%], ProKidney [37.43%], Snap One[29.79%], ALX Oncology[22.49%], 23andMe Holding[22.09%], Vanda [21.12%], ContextLogic [20%], Badger Meter[17.13%], Oscar Health[15.4%], Accolade [13.45%] Best Smallcap Stocks Daily:
Humacyte [23.57%], Metropolitan Bank[17.73%], Agenus [13.48%], Origin Materials[11.12%], Chemung Financial[9.48%], Pacific Biosciences[8.56%], Cohen & Steers[8.35%], Urban One[8.21%], Riot Blockchain[7.84%], Bar Harbor[7.71%], CareMax [7.57%]