
 Login Sign Up


| |||||
 |  | ||||

| 12Stocks.com Market Intelligence |
Best SmallCap Stocks
|
| In a hurry? Small Cap Stock Lists: Performance Trends Table, Stock Charts
Sort Small Cap stocks: Daily, Weekly, Year-to-Date, Market Cap & Trends. Filter Small Cap stocks list by sector: Show all, Tech, Finance, Energy, Staples, Retail, Industrial, Materials, Utilities and HealthCare Filter Small Cap stocks list by size: All Large Medium Small and MicroCap |
| 12Stocks.com Small Cap Stocks Performances & Trends Daily | |||||||||
|
|  The overall Smart Investing & Trading Score is 44 (0-bearish to 100-bullish) which puts Small Cap index in short term neutral trend. The Smart Investing & Trading Score from previous trading session is 58 and hence a deterioration of trend.
| ||||||||
Here are the Smart Investing & Trading Scores of the most requested small cap stocks at 12Stocks.com (click stock name for detailed review):
|


| 12Stocks.com: Investing in Smallcap Index with Stocks | |
|
The following table helps investors and traders sort through current performance and trends (as measured by Smart Investing & Trading Score) of various
stocks in the Smallcap Index. Quick View: Move mouse or cursor over stock symbol (ticker) to view short-term technical chart and over stock name to view long term chart. Click on  to add stock symbol to your watchlist and to add stock symbol to your watchlist and  to view watchlist. Click on any ticker or stock name for detailed market intelligence report for that stock. to view watchlist. Click on any ticker or stock name for detailed market intelligence report for that stock. |
12Stocks.com Performance of Stocks in Smallcap Index
| Ticker | Stock Name | Watchlist | Category | Recent Price | Smart Investing & Trading Score | Change % | YTD Change% |
| BOH | Bank of Hawaii |   | Financials | 59.11 | 40 | 0.75 | -18.42% |
| PFBC | Preferred Bank | | Financials | 77.47 | 93 | 0.75 | 6.05% |
| SSBK | Southern States | | Financials | 24.18 | 34 | 0.75 | -17.87% |
| DNUT | Krispy Kreme | | Consumer Staples | 13.10 | 17 | 0.73 | -13.79% |
| ORRF | Orrstown Financial | | Financials | 26.43 | 57 | 0.72 | -10.41% |
| STER | Sterling Check | | Technology | 15.38 | 63 | 0.72 | 10.41% |
| SSD | Simpson | | Industrials | 170.82 | 0 | 0.71 | -13.72% |
| MGRC | McGrath RentCorp | | Transports | 109.30 | 17 | 0.71 | -8.63% |
| UHG | United Homes | | Services & Goods | 6.40 | 28 | 0.71 | -23.72% |
| GOGO | Gogo | | Technology | 8.79 | 74 | 0.69 | -13.23% |
| TK | Teekay | | Transports | 7.35 | 35 | 0.68 | 2.80% |
| ENS | EnerSys | | Industrials | 90.99 | 28 | 0.67 | -9.88% |
| OBIO | Orchestra BioMed | | Health Care | 4.52 | 17 | 0.67 | -50.38% |
| TARO | Taro Pharmaceutical | | Health Care | 42.48 | 32 | 0.66 | 1.68% |
| SRI | Stoneridge | | Consumer Staples | 15.35 | 10 | 0.66 | -21.56% |
| OMER | Omeros | | Health Care | 3.06 | 8 | 0.66 | -6.42% |
| FNKO | Funko | | Consumer Staples | 6.22 | 67 | 0.65 | -19.53% |
| MGY | Magnolia Oil | | Energy | 26.28 | 46 | 0.65 | 23.44% |
| RYI | Ryerson Holding | | Industrials | 9.45 | 10 | 0.64 | -10.47% |
| VSTO | Vista Outdoor | | Consumer Staples | 34.68 | 93 | 0.64 | 17.28% |
| WTTR | Select Energy | | Industrials | 9.42 | 61 | 0.64 | 24.11% |
| OMGA | Omega | | Health Care | 2.35 | 10 | 0.64 | -21.93% |
| ATMU | Atmus Filtration | | Industrials | 30.86 | 54 | 0.64 | 32.05% |
| BATRA | Liberty Braves | | Services & Goods | 41.25 | 35 | 0.63 | -3.58% |
| SAMG | Silvercrest Asset | | Financials | 14.84 | 42 | 0.61 | -12.71% |


| Too many stocks? View smallcap stocks filtered by marketcap & sector |
| Marketcap: All SmallCap Stocks (default-no microcap), Large, Mid-Range, Small |
| Smallcap Sector: Tech, Finance, Energy, Staples, Retail, Industrial, Materials, & Medical |
|
Get the most comprehensive stock market coverage daily at 12Stocks.com ➞ Best Stocks Today ➞ Best Stocks Weekly ➞ Best Stocks Year-to-Date ➞ Best Stocks Trends ➞  Best Stocks Today 12Stocks.com Best Nasdaq Stocks ➞ Best S&P 500 Stocks ➞ Best Tech Stocks ➞ Best Biotech Stocks ➞ |
| Detailed Overview of SmallCap Stocks |
| SmallCap Technical Overview, Leaders & Laggards, Top SmallCap ETF Funds & Detailed SmallCap Stocks List, Charts, Trends & More |
| Smallcap: Technical Analysis, Trends & YTD Performance | |
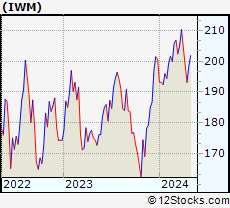
| SmallCap segment as represented by
IWM, an exchange-traded fund [ETF], holds basket of thousands of smallcap stocks from across all major sectors of the US stock market. The smallcap index (contains stocks like Riverbed & Sotheby's) is down by -2.11% and is currently underperforming the overall market by -7.27% year-to-date. Below is a quick view of technical charts and trends: | |
 IWM Weekly Chart |
|
| Long Term Trend: Good | |
| Medium Term Trend: Not Good | |
 IWM Daily Chart |
|
| Short Term Trend: Very Good | |
| Overall Trend Score: 44 | |
| YTD Performance: -2.11% | |
| **Trend Scores & Views Are Only For Educational Purposes And Not For Investing | |
| 12Stocks.com: Top Performing Small Cap Index Stocks | ||||||||||||||||||||||||||||||||||||||||||||||||
 The top performing Small Cap Index stocks year to date are
Now, more recently, over last week, the top performing Small Cap Index stocks on the move are


|
||||||||||||||||||||||||||||||||||||||||||||||||
| 12Stocks.com: Investing in Smallcap Index using Exchange Traded Funds | |
|
The following table shows list of key exchange traded funds (ETF) that
help investors track Smallcap index. The following list also includes leveraged ETF funds that track twice or thrice the daily returns of Smallcap indices. Short or inverse ETF funds move in the opposite direction to the index they track and are useful during market pullbacks or during bear markets. Quick View: Move mouse or cursor over ETF symbol (ticker) to view short-term technical chart and over ETF name to view long term chart. Click on ticker or stock name for detailed view. Click on to add stock symbol to your watchlist and to view watchlist. |
12Stocks.com List of ETFs that track Smallcap Index
| Ticker | ETF Name | Watchlist | Recent Price | Smart Investing & Trading Score | Change % | Week % | Year-to-date % |
| IWM | iShares Russell 2000 | | 196.48 | 44 | -0.61 | 1.73 | -2.11% |
| IJR | iShares Core S&P Small-Cap | | 104.86 | 78 | -0.80 | 1.59 | -3.13% |
| VTWO | Vanguard Russell 2000 ETF | | 79.45 | 63 | -0.60 | 1.75 | -2.03% |
| IWN | iShares Russell 2000 Value | | 150.18 | 68 | -0.73 | 1.62 | -3.32% |
| IWO | iShares Russell 2000 Growth | | 249.86 | 51 | -0.56 | 1.86 | -0.94% |
| IJS | iShares S&P Small-Cap 600 Value | | 96.69 | 60 | -1.04 | 1.13 | -6.19% |
| IJT | iShares S&P Small-Cap 600 Growth | | 125.06 | 63 | -0.25 | 2.33 | -0.06% |
| XSLV | PowerShares S&P SmallCap Low Volatil ETF | | 42.54 | 73 | -0.93 | 0.85 | -3.65% |
| SDD | ProShares UltraShort SmallCap600 | | 19.58 | 42 | 0.46 | -3.74 | 6.26% |
| SBB | ProShares Short SmallCap600 | | 16.50 | 40 | 0.79 | -2.02 | 3.58% |
| SMLV | SPDR SSGA US Small Cap Low Volatil ETF | | 107.33 | 73 | -1.01 | 1.17 | -4.61% |
| SAA | ProShares Ultra SmallCap600 | | 22.66 | 58 | -1.52 | 3.94 | -9.18% |
| 12Stocks.com: Charts, Trends, Fundamental Data and Performances of SmallCap Stocks | |
|
We now take in-depth look at all SmallCap stocks including charts, multi-period performances and overall trends (as measured by Smart Investing & Trading Score). One can sort SmallCap stocks (click link to choose) by Daily, Weekly and by Year-to-Date performances. Also, one can sort by size of the company or by market capitalization. |
| Select Your Default Chart Type: | |||||
| |||||
| Click on stock symbol or name for detailed view. Click on to add stock symbol to your watchlist and to view watchlist. Quick View: Move mouse or cursor over "Daily" to quickly view daily technical stock chart and over "Weekly" to view weekly technical stock chart. | |||||

 | BOH Bank of Hawaii Corporation |
| Sector: Financials | |
| SubSector: Regional - Pacific Banks | |
| MarketCap: 2305.19 Millions | |
| Recent Price: 59.11 Smart Investing & Trading Score: 40 | |
| Day Percent Change: 0.75% Day Change: 0.44 | |
| Week Change: 1.22% Year-to-date Change: -18.4% | |
| BOH Links: Profile News Message Board | |
| Charts:- Daily , Weekly | |
| Add BOH to Watchlist: View: Get Complete BOH Trend Analysis ➞ | |
 | PFBC Preferred Bank |
| Sector: Financials | |
| SubSector: Regional - Pacific Banks | |
| MarketCap: 559.629 Millions | |
| Recent Price: 77.47 Smart Investing & Trading Score: 93 | |
| Day Percent Change: 0.75% Day Change: 0.58 | |
| Week Change: 4.27% Year-to-date Change: 6.1% | |
| PFBC Links: Profile News Message Board | |
| Charts:- Daily , Weekly | |
| Add PFBC to Watchlist: View: Get Complete PFBC Trend Analysis ➞ | |
 | SSBK Southern States Bancshares, Inc. |
| Sector: Financials | |
| SubSector: Banks - Regional | |
| MarketCap: 187 Millions | |
| Recent Price: 24.18 Smart Investing & Trading Score: 34 | |
| Day Percent Change: 0.75% Day Change: 0.18 | |
| Week Change: 0.75% Year-to-date Change: -17.9% | |
| SSBK Links: Profile News Message Board | |
| Charts:- Daily , Weekly | |
| Add SSBK to Watchlist: View: Get Complete SSBK Trend Analysis ➞ | |
 | DNUT Krispy Kreme, Inc. |
| Sector: Consumer Staples | |
| SubSector: Grocery Stores | |
| MarketCap: 2480 Millions | |
| Recent Price: 13.10 Smart Investing & Trading Score: 17 | |
| Day Percent Change: 0.73% Day Change: 0.09 | |
| Week Change: -3.96% Year-to-date Change: -13.8% | |
| DNUT Links: Profile News Message Board | |
| Charts:- Daily , Weekly | |
| Add DNUT to Watchlist: View: Get Complete DNUT Trend Analysis ➞ | |
 | ORRF Orrstown Financial Services, Inc. |
| Sector: Financials | |
| SubSector: Regional - Northeast Banks | |
| MarketCap: 159.999 Millions | |
| Recent Price: 26.43 Smart Investing & Trading Score: 57 | |
| Day Percent Change: 0.72% Day Change: 0.19 | |
| Week Change: 1.81% Year-to-date Change: -10.4% | |
| ORRF Links: Profile News Message Board | |
| Charts:- Daily , Weekly | |
| Add ORRF to Watchlist: View: Get Complete ORRF Trend Analysis ➞ | |
 | STER Sterling Check Corp. |
| Sector: Technology | |
| SubSector: Software - Infrastructure | |
| MarketCap: 1180 Millions | |
| Recent Price: 15.38 Smart Investing & Trading Score: 63 | |
| Day Percent Change: 0.72% Day Change: 0.11 | |
| Week Change: 2.67% Year-to-date Change: 10.4% | |
| STER Links: Profile News Message Board | |
| Charts:- Daily , Weekly | |
| Add STER to Watchlist: View: Get Complete STER Trend Analysis ➞ | |
 | SSD Simpson Manufacturing Co., Inc. |
| Sector: Industrials | |
| SubSector: Small Tools & Accessories | |
| MarketCap: 2850.16 Millions | |
| Recent Price: 170.82 Smart Investing & Trading Score: 0 | |
| Day Percent Change: 0.71% Day Change: 1.20 | |
| Week Change: -7.35% Year-to-date Change: -13.7% | |
| SSD Links: Profile News Message Board | |
| Charts:- Daily , Weekly | |
| Add SSD to Watchlist: View: Get Complete SSD Trend Analysis ➞ | |
 | MGRC McGrath RentCorp |
| Sector: Transports | |
| SubSector: Rental & Leasing Services | |
| MarketCap: 1289.04 Millions | |
| Recent Price: 109.30 Smart Investing & Trading Score: 17 | |
| Day Percent Change: 0.71% Day Change: 0.77 | |
| Week Change: -0.99% Year-to-date Change: -8.6% | |
| MGRC Links: Profile News Message Board | |
| Charts:- Daily , Weekly | |
| Add MGRC to Watchlist: View: Get Complete MGRC Trend Analysis ➞ | |
 | UHG United Homes Group, Inc. |
| Sector: Services & Goods | |
| SubSector: Residential Construction | |
| MarketCap: 566 Millions | |
| Recent Price: 6.40 Smart Investing & Trading Score: 28 | |
| Day Percent Change: 0.71% Day Change: 0.04 | |
| Week Change: 0.79% Year-to-date Change: -23.7% | |
| UHG Links: Profile News Message Board | |
| Charts:- Daily , Weekly | |
| Add UHG to Watchlist: View: Get Complete UHG Trend Analysis ➞ | |
 | GOGO Gogo Inc. |
| Sector: Technology | |
| SubSector: Diversified Communication Services | |
| MarketCap: 307.064 Millions | |
| Recent Price: 8.79 Smart Investing & Trading Score: 74 | |
| Day Percent Change: 0.69% Day Change: 0.06 | |
| Week Change: 5.27% Year-to-date Change: -13.2% | |
| GOGO Links: Profile News Message Board | |
| Charts:- Daily , Weekly | |
| Add GOGO to Watchlist: View: Get Complete GOGO Trend Analysis ➞ | |
 | TK Teekay Corporation |
| Sector: Transports | |
| SubSector: Shipping | |
| MarketCap: 257.914 Millions | |
| Recent Price: 7.35 Smart Investing & Trading Score: 35 | |
| Day Percent Change: 0.68% Day Change: 0.05 | |
| Week Change: 1.24% Year-to-date Change: 2.8% | |
| TK Links: Profile News Message Board | |
| Charts:- Daily , Weekly | |
| Add TK to Watchlist: View: Get Complete TK Trend Analysis ➞ | |
 | ENS EnerSys |
| Sector: Industrials | |
| SubSector: Industrial Electrical Equipment | |
| MarketCap: 2068.79 Millions | |
| Recent Price: 90.99 Smart Investing & Trading Score: 28 | |
| Day Percent Change: 0.67% Day Change: 0.61 | |
| Week Change: 0.54% Year-to-date Change: -9.9% | |
| ENS Links: Profile News Message Board | |
| Charts:- Daily , Weekly | |
| Add ENS to Watchlist: View: Get Complete ENS Trend Analysis ➞ | |
 | OBIO Orchestra BioMed Holdings, Inc. |
| Sector: Health Care | |
| SubSector: Biotechnology | |
| MarketCap: 271 Millions | |
| Recent Price: 4.52 Smart Investing & Trading Score: 17 | |
| Day Percent Change: 0.67% Day Change: 0.03 | |
| Week Change: -2.59% Year-to-date Change: -50.4% | |
| OBIO Links: Profile News Message Board | |
| Charts:- Daily , Weekly | |
| Add OBIO to Watchlist: View: Get Complete OBIO Trend Analysis ➞ | |
 | TARO Taro Pharmaceutical Industries Ltd. |
| Sector: Health Care | |
| SubSector: Drug Manufacturers - Other | |
| MarketCap: 2379.33 Millions | |
| Recent Price: 42.48 Smart Investing & Trading Score: 32 | |
| Day Percent Change: 0.66% Day Change: 0.28 | |
| Week Change: 0.54% Year-to-date Change: 1.7% | |
| TARO Links: Profile News Message Board | |
| Charts:- Daily , Weekly | |
| Add TARO to Watchlist: View: Get Complete TARO Trend Analysis ➞ | |
 | SRI Stoneridge, Inc. |
| Sector: Consumer Staples | |
| SubSector: Auto Parts | |
| MarketCap: 451.839 Millions | |
| Recent Price: 15.35 Smart Investing & Trading Score: 10 | |
| Day Percent Change: 0.66% Day Change: 0.10 | |
| Week Change: -1.67% Year-to-date Change: -21.6% | |
| SRI Links: Profile News Message Board | |
| Charts:- Daily , Weekly | |
| Add SRI to Watchlist: View: Get Complete SRI Trend Analysis ➞ | |
 | OMER Omeros Corporation |
| Sector: Health Care | |
| SubSector: Biotechnology | |
| MarketCap: 759.585 Millions | |
| Recent Price: 3.06 Smart Investing & Trading Score: 8 | |
| Day Percent Change: 0.66% Day Change: 0.02 | |
| Week Change: 0.33% Year-to-date Change: -6.4% | |
| OMER Links: Profile News Message Board | |
| Charts:- Daily , Weekly | |
| Add OMER to Watchlist: View: Get Complete OMER Trend Analysis ➞ | |
 | FNKO Funko, Inc. |
| Sector: Consumer Staples | |
| SubSector: Toys & Games | |
| MarketCap: 246.38 Millions | |
| Recent Price: 6.22 Smart Investing & Trading Score: 67 | |
| Day Percent Change: 0.65% Day Change: 0.04 | |
| Week Change: 3.49% Year-to-date Change: -19.5% | |
| FNKO Links: Profile News Message Board | |
| Charts:- Daily , Weekly | |
| Add FNKO to Watchlist: View: Get Complete FNKO Trend Analysis ➞ | |
 | MGY Magnolia Oil & Gas Corporation |
| Sector: Energy | |
| SubSector: Independent Oil & Gas | |
| MarketCap: 1088.93 Millions | |
| Recent Price: 26.28 Smart Investing & Trading Score: 46 | |
| Day Percent Change: 0.65% Day Change: 0.17 | |
| Week Change: 2.58% Year-to-date Change: 23.4% | |
| MGY Links: Profile News Message Board | |
| Charts:- Daily , Weekly | |
| Add MGY to Watchlist: View: Get Complete MGY Trend Analysis ➞ | |
 | RYI Ryerson Holding Corporation |
| Sector: Industrials | |
| SubSector: Metal Fabrication | |
| MarketCap: 202.55 Millions | |
| Recent Price: 9.45 Smart Investing & Trading Score: 10 | |
| Day Percent Change: 0.64% Day Change: 0.06 | |
| Week Change: -2.97% Year-to-date Change: -10.5% | |
| RYI Links: Profile News Message Board | |
| Charts:- Daily , Weekly | |
| Add RYI to Watchlist: View: Get Complete RYI Trend Analysis ➞ | |
 | VSTO Vista Outdoor Inc. |
| Sector: Consumer Staples | |
| SubSector: Sporting Goods | |
| MarketCap: 405.144 Millions | |
| Recent Price: 34.68 Smart Investing & Trading Score: 93 | |
| Day Percent Change: 0.64% Day Change: 0.22 | |
| Week Change: 7.17% Year-to-date Change: 17.3% | |
| VSTO Links: Profile News Message Board | |
| Charts:- Daily , Weekly | |
| Add VSTO to Watchlist: View: Get Complete VSTO Trend Analysis ➞ | |
 | WTTR Select Energy Services, Inc. |
| Sector: Industrials | |
| SubSector: Pollution & Treatment Controls | |
| MarketCap: 347.075 Millions | |
| Recent Price: 9.42 Smart Investing & Trading Score: 61 | |
| Day Percent Change: 0.64% Day Change: 0.06 | |
| Week Change: 0.86% Year-to-date Change: 24.1% | |
| WTTR Links: Profile News Message Board | |
| Charts:- Daily , Weekly | |
| Add WTTR to Watchlist: View: Get Complete WTTR Trend Analysis ➞ | |
 | OMGA Omega Therapeutics, Inc. |
| Sector: Health Care | |
| SubSector: Biotechnology | |
| MarketCap: 304 Millions | |
| Recent Price: 2.35 Smart Investing & Trading Score: 10 | |
| Day Percent Change: 0.64% Day Change: 0.02 | |
| Week Change: -2.08% Year-to-date Change: -21.9% | |
| OMGA Links: Profile News Message Board | |
| Charts:- Daily , Weekly | |
| Add OMGA to Watchlist: View: Get Complete OMGA Trend Analysis ➞ | |
 | ATMU Atmus Filtration Technologies Inc. |
| Sector: Industrials | |
| SubSector: Pollution & Treatment Controls | |
| MarketCap: 1830 Millions | |
| Recent Price: 30.86 Smart Investing & Trading Score: 54 | |
| Day Percent Change: 0.64% Day Change: 0.20 | |
| Week Change: -0.03% Year-to-date Change: 32.1% | |
| ATMU Links: Profile News Message Board | |
| Charts:- Daily , Weekly | |
| Add ATMU to Watchlist: View: Get Complete ATMU Trend Analysis ➞ | |
 | BATRA The Liberty Braves Group |
| Sector: Services & Goods | |
| SubSector: Broadcasting - TV | |
| MarketCap: 18873.5 Millions | |
| Recent Price: 41.25 Smart Investing & Trading Score: 35 | |
| Day Percent Change: 0.63% Day Change: 0.26 | |
| Week Change: 2.38% Year-to-date Change: -3.6% | |
| BATRA Links: Profile News Message Board | |
| Charts:- Daily , Weekly | |
| Add BATRA to Watchlist: View: Get Complete BATRA Trend Analysis ➞ | |
 | SAMG Silvercrest Asset Management Group Inc. |
| Sector: Financials | |
| SubSector: Asset Management | |
| MarketCap: 116.303 Millions | |
| Recent Price: 14.84 Smart Investing & Trading Score: 42 | |
| Day Percent Change: 0.61% Day Change: 0.09 | |
| Week Change: 1.5% Year-to-date Change: -12.7% | |
| SAMG Links: Profile News Message Board | |
| Charts:- Daily , Weekly | |
| Add SAMG to Watchlist: View: Get Complete SAMG Trend Analysis ➞ | |
| Too many stocks? View smallcap stocks filtered by marketcap & sector |
| Marketcap: All SmallCap Stocks (default-no microcap), Large, Mid-Range, Small & MicroCap |
| Sector: Tech, Finance, Energy, Staples, Retail, Industrial, Materials, Utilities & Medical |
|
Best Stocks Today 12Stocks.com |
© 2024 12Stocks.com Terms & Conditions Privacy Contact Us
All Information Provided Only For Education And Not To Be Used For Investing or Trading. See Terms & Conditions


One More Thing ... Get Best Stocks Delivered Daily!
Never Ever Miss A Move With Our Top Ten Stocks Lists
Find Best Stocks In Any Market - Bull or Bear Market
Take A Peek At Our Top Ten Stocks Lists: Daily, Weekly, Year-to-Date & Top Trends
Find Best Stocks In Any Market - Bull or Bear Market
Take A Peek At Our Top Ten Stocks Lists: Daily, Weekly, Year-to-Date & Top Trends
Smallcap Stocks With Best Up Trends [0-bearish to 100-bullish]: B. Riley[100], Central Pacific[100], California Water[100], Cricut [100], Carpenter [100], Haemonetics [100], Sanmina [100], Trustmark [100], Comstock Resources[100], EchoStar [100], Mueller Industries[100]
Best Smallcap Stocks Year-to-Date:
CareMax [490.72%], Janux [338.34%], Viking [270.02%], Alpine Immune[239.52%], Longboard [218%], Super Micro[177%], Arcutis Bio[166.56%], Avidity Biosciences[159.79%], Vera [149.94%], Hippo [128.87%], Stoke [122.15%] Best Smallcap Stocks This Week:
Matterport [168.97%], B. Riley[73.54%], Impinj [33.73%], ProKidney [32.84%], Seres [32.65%], Riot Blockchain[32.64%], Ribbon [25.58%], Cullinan Oncology[22.92%], P.A.M. Transportation[22.85%], NuScale Power[21.44%], Hibbett Sports[21.03%] Best Smallcap Stocks Daily:
Impinj [28.65%], P.A.M. Transportation[17.95%], B. Riley[16.61%], Strategic Education[16.28%], OptiNose [14.56%], JELD-WEN Holding[11.54%], Sonic Automotive[10.86%], Intevac [10.54%], SiTime [8.84%], Noodles & [8.08%], ProKidney [7.75%]