
 Login Sign Up


| |||||
 |  | ||||

| 12Stocks.com Market Intelligence |
Best SmallCap Stocks
|
| In a hurry? Small Cap Stock Lists: Performance Trends Table, Stock Charts
Sort Small Cap stocks: Daily, Weekly, Year-to-Date, Market Cap & Trends. Filter Small Cap stocks list by sector: Show all, Tech, Finance, Energy, Staples, Retail, Industrial, Materials, Utilities and HealthCare Filter Small Cap stocks list by size: All Large Medium Small and MicroCap |
| 12Stocks.com Small Cap Stocks Performances & Trends Daily | |||||||||
|
|  The overall Smart Investing & Trading Score is 44 (0-bearish to 100-bullish) which puts Small Cap index in short term neutral trend. The Smart Investing & Trading Score from previous trading session is 58 and hence a deterioration of trend.
| ||||||||
Here are the Smart Investing & Trading Scores of the most requested small cap stocks at 12Stocks.com (click stock name for detailed review):
|


| 12Stocks.com: Investing in Smallcap Index with Stocks | |
|
The following table helps investors and traders sort through current performance and trends (as measured by Smart Investing & Trading Score) of various
stocks in the Smallcap Index. Quick View: Move mouse or cursor over stock symbol (ticker) to view short-term technical chart and over stock name to view long term chart. Click on  to add stock symbol to your watchlist and to add stock symbol to your watchlist and  to view watchlist. Click on any ticker or stock name for detailed market intelligence report for that stock. to view watchlist. Click on any ticker or stock name for detailed market intelligence report for that stock. |
12Stocks.com Performance of Stocks in Smallcap Index
| Ticker | Stock Name | Watchlist | Category | Recent Price | Smart Investing & Trading Score | Change % | YTD Change% |
| UVE | Universal Insurance |   | Financials | 20.30 | 93 | 0.20 | 27.03% |
| WEST | Westrock Coffee | | Consumer Staples | 9.93 | 24 | 0.20 | -2.26% |
| FSBW | FS Bancorp | | Financials | 31.44 | 25 | 0.19 | -14.94% |
| NRDY | Nerdy | | Technology | 2.60 | 25 | 0.19 | -24.31% |
| CARS | Cars.com | | Services & Goods | 16.89 | 49 | 0.18 | -10.96% |
| RMNI | Rimini Street | | Technology | 2.81 | 17 | 0.18 | -14.22% |
| GNW | Genworth Financial | | Financials | 6.01 | 7 | 0.17 | -10.03% |
| PGC | Peapack-Gladstone Financial | | Financials | 22.92 | 20 | 0.17 | -23.14% |
| OSW | OneSpaWorld | | Services & Goods | 12.54 | 42 | 0.16 | -11.06% |
| HELE | Helen of Troy | | Consumer Staples | 90.85 | 0 | 0.15 | -24.80% |
| ASB | Associated Banc-Corp | | Financials | 21.37 | 93 | 0.14 | -0.09% |
| HRT | HireRight | | Industrials | 14.29 | 68 | 0.14 | 6.25% |
| ARL | American Realty | | Financials | 13.85 | 10 | 0.14 | -20.45% |
| MTRN | Materion | | Materials | 118.63 | 36 | 0.14 | -8.84% |
| RKLB | Rocket Lab | | Industrials | 3.65 | 20 | 0.14 | -33.76% |
| SXI | Standex | | Industrials | 171.60 | 59 | 0.13 | 8.35% |
| BELFB | Bel Fuse | | Technology | 60.78 | 49 | 0.13 | -8.97% |
| OFLX | Omega Flex | | Industrials | 67.59 | 42 | 0.13 | -4.14% |
| AKYA | Akoya Biosciences | | Health Care | 3.82 | 30 | 0.13 | -21.88% |
| VERA | Vera | | Health Care | 38.69 | 68 | 0.13 | 149.94% |
| LZ | LegalZoom.com | | Industrials | 12.27 | 63 | 0.12 | 8.06% |
| EVBN | Evans Bancorp | | Financials | 26.03 | 10 | 0.12 | -17.44% |
| RGNX | REGENXBIO | | Health Care | 16.06 | 36 | 0.12 | -10.53% |
| CVGW | Calavo Growers | | Consumer Staples | 27.41 | 80 | 0.11 | -6.80% |
| ENV | Envestnet | | Services & Goods | 62.36 | 63 | 0.11 | 25.93% |


| Too many stocks? View smallcap stocks filtered by marketcap & sector |
| Marketcap: All SmallCap Stocks (default-no microcap), Large, Mid-Range, Small |
| Smallcap Sector: Tech, Finance, Energy, Staples, Retail, Industrial, Materials, & Medical |
|
Get the most comprehensive stock market coverage daily at 12Stocks.com ➞ Best Stocks Today ➞ Best Stocks Weekly ➞ Best Stocks Year-to-Date ➞ Best Stocks Trends ➞  Best Stocks Today 12Stocks.com Best Nasdaq Stocks ➞ Best S&P 500 Stocks ➞ Best Tech Stocks ➞ Best Biotech Stocks ➞ |
| Detailed Overview of SmallCap Stocks |
| SmallCap Technical Overview, Leaders & Laggards, Top SmallCap ETF Funds & Detailed SmallCap Stocks List, Charts, Trends & More |
| Smallcap: Technical Analysis, Trends & YTD Performance | |
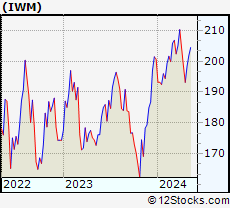
| SmallCap segment as represented by
IWM, an exchange-traded fund [ETF], holds basket of thousands of smallcap stocks from across all major sectors of the US stock market. The smallcap index (contains stocks like Riverbed & Sotheby's) is down by -2.11% and is currently underperforming the overall market by -7.27% year-to-date. Below is a quick view of technical charts and trends: | |
 IWM Weekly Chart |
|
| Long Term Trend: Good | |
| Medium Term Trend: Not Good | |
 IWM Daily Chart |
|
| Short Term Trend: Very Good | |
| Overall Trend Score: 44 | |
| YTD Performance: -2.11% | |
| **Trend Scores & Views Are Only For Educational Purposes And Not For Investing | |
| 12Stocks.com: Top Performing Small Cap Index Stocks | ||||||||||||||||||||||||||||||||||||||||||||||||
 The top performing Small Cap Index stocks year to date are
Now, more recently, over last week, the top performing Small Cap Index stocks on the move are


|
||||||||||||||||||||||||||||||||||||||||||||||||
| 12Stocks.com: Investing in Smallcap Index using Exchange Traded Funds | |
|
The following table shows list of key exchange traded funds (ETF) that
help investors track Smallcap index. The following list also includes leveraged ETF funds that track twice or thrice the daily returns of Smallcap indices. Short or inverse ETF funds move in the opposite direction to the index they track and are useful during market pullbacks or during bear markets. Quick View: Move mouse or cursor over ETF symbol (ticker) to view short-term technical chart and over ETF name to view long term chart. Click on ticker or stock name for detailed view. Click on to add stock symbol to your watchlist and to view watchlist. |
12Stocks.com List of ETFs that track Smallcap Index
| Ticker | ETF Name | Watchlist | Recent Price | Smart Investing & Trading Score | Change % | Week % | Year-to-date % |
| IWM | iShares Russell 2000 | | 196.48 | 44 | -0.61 | 1.73 | -2.11% |
| IJR | iShares Core S&P Small-Cap | | 104.86 | 78 | -0.80 | 1.59 | -3.13% |
| VTWO | Vanguard Russell 2000 ETF | | 79.45 | 63 | -0.60 | 1.75 | -2.03% |
| IWN | iShares Russell 2000 Value | | 150.18 | 68 | -0.73 | 1.62 | -3.32% |
| IWO | iShares Russell 2000 Growth | | 249.86 | 51 | -0.56 | 1.86 | -0.94% |
| IJS | iShares S&P Small-Cap 600 Value | | 96.69 | 60 | -1.04 | 1.13 | -6.19% |
| IJT | iShares S&P Small-Cap 600 Growth | | 125.06 | 63 | -0.25 | 2.33 | -0.06% |
| XSLV | PowerShares S&P SmallCap Low Volatil ETF | | 42.54 | 73 | -0.93 | 0.85 | -3.65% |
| SDD | ProShares UltraShort SmallCap600 | | 19.58 | 42 | 0.46 | -3.74 | 6.26% |
| SBB | ProShares Short SmallCap600 | | 16.50 | 40 | 0.79 | -2.02 | 3.58% |
| SMLV | SPDR SSGA US Small Cap Low Volatil ETF | | 107.33 | 73 | -1.01 | 1.17 | -4.61% |
| SAA | ProShares Ultra SmallCap600 | | 22.66 | 58 | -1.52 | 3.94 | -9.18% |
| 12Stocks.com: Charts, Trends, Fundamental Data and Performances of SmallCap Stocks | |
|
We now take in-depth look at all SmallCap stocks including charts, multi-period performances and overall trends (as measured by Smart Investing & Trading Score). One can sort SmallCap stocks (click link to choose) by Daily, Weekly and by Year-to-Date performances. Also, one can sort by size of the company or by market capitalization. |
| Select Your Default Chart Type: | |||||
| |||||
| Click on stock symbol or name for detailed view. Click on to add stock symbol to your watchlist and to view watchlist. Quick View: Move mouse or cursor over "Daily" to quickly view daily technical stock chart and over "Weekly" to view weekly technical stock chart. | |||||

 | UVE Universal Insurance Holdings, Inc. |
| Sector: Financials | |
| SubSector: Property & Casualty Insurance | |
| MarketCap: 616.212 Millions | |
| Recent Price: 20.30 Smart Investing & Trading Score: 93 | |
| Day Percent Change: 0.20% Day Change: 0.04 | |
| Week Change: 3.47% Year-to-date Change: 27.0% | |
| UVE Links: Profile News Message Board | |
| Charts:- Daily , Weekly | |
| Add UVE to Watchlist: View: Get Complete UVE Trend Analysis ➞ | |
 | WEST Westrock Coffee Company, LLC |
| Sector: Consumer Staples | |
| SubSector: Packaged Foods | |
| MarketCap: 799 Millions | |
| Recent Price: 9.93 Smart Investing & Trading Score: 24 | |
| Day Percent Change: 0.20% Day Change: 0.02 | |
| Week Change: -2.93% Year-to-date Change: -2.3% | |
| WEST Links: Profile News Message Board | |
| Charts:- Daily , Weekly | |
| Add WEST to Watchlist: View: Get Complete WEST Trend Analysis ➞ | |
 | FSBW FS Bancorp, Inc. |
| Sector: Financials | |
| SubSector: Regional - Pacific Banks | |
| MarketCap: 140.429 Millions | |
| Recent Price: 31.44 Smart Investing & Trading Score: 25 | |
| Day Percent Change: 0.19% Day Change: 0.06 | |
| Week Change: -0.19% Year-to-date Change: -14.9% | |
| FSBW Links: Profile News Message Board | |
| Charts:- Daily , Weekly | |
| Add FSBW to Watchlist: View: Get Complete FSBW Trend Analysis ➞ | |
 | NRDY Nerdy, Inc. |
| Sector: Technology | |
| SubSector: Software - Application | |
| MarketCap: 683 Millions | |
| Recent Price: 2.60 Smart Investing & Trading Score: 25 | |
| Day Percent Change: 0.19% Day Change: 0.00 | |
| Week Change: 2.77% Year-to-date Change: -24.3% | |
| NRDY Links: Profile News Message Board | |
| Charts:- Daily , Weekly | |
| Add NRDY to Watchlist: View: Get Complete NRDY Trend Analysis ➞ | |
 | CARS Cars.com Inc. |
| Sector: Services & Goods | |
| SubSector: Auto Dealerships | |
| MarketCap: 290.321 Millions | |
| Recent Price: 16.89 Smart Investing & Trading Score: 49 | |
| Day Percent Change: 0.18% Day Change: 0.03 | |
| Week Change: 2.74% Year-to-date Change: -11.0% | |
| CARS Links: Profile News Message Board | |
| Charts:- Daily , Weekly | |
| Add CARS to Watchlist: View: Get Complete CARS Trend Analysis ➞ | |
 | RMNI Rimini Street, Inc. |
| Sector: Technology | |
| SubSector: Application Software | |
| MarketCap: 288.762 Millions | |
| Recent Price: 2.81 Smart Investing & Trading Score: 17 | |
| Day Percent Change: 0.18% Day Change: 0.01 | |
| Week Change: -1.75% Year-to-date Change: -14.2% | |
| RMNI Links: Profile News Message Board | |
| Charts:- Daily , Weekly | |
| Add RMNI to Watchlist: View: Get Complete RMNI Trend Analysis ➞ | |
 | GNW Genworth Financial, Inc. |
| Sector: Financials | |
| SubSector: Life Insurance | |
| MarketCap: 1719.76 Millions | |
| Recent Price: 6.01 Smart Investing & Trading Score: 7 | |
| Day Percent Change: 0.17% Day Change: 0.01 | |
| Week Change: 0.33% Year-to-date Change: -10.0% | |
| GNW Links: Profile News Message Board | |
| Charts:- Daily , Weekly | |
| Add GNW to Watchlist: View: Get Complete GNW Trend Analysis ➞ | |
 | PGC Peapack-Gladstone Financial Corporation |
| Sector: Financials | |
| SubSector: Regional - Northeast Banks | |
| MarketCap: 284.399 Millions | |
| Recent Price: 22.92 Smart Investing & Trading Score: 20 | |
| Day Percent Change: 0.17% Day Change: 0.04 | |
| Week Change: -5.01% Year-to-date Change: -23.1% | |
| PGC Links: Profile News Message Board | |
| Charts:- Daily , Weekly | |
| Add PGC to Watchlist: View: Get Complete PGC Trend Analysis ➞ | |
 | OSW OneSpaWorld Holdings Limited |
| Sector: Services & Goods | |
| SubSector: Resorts & Casinos | |
| MarketCap: 228.394 Millions | |
| Recent Price: 12.54 Smart Investing & Trading Score: 42 | |
| Day Percent Change: 0.16% Day Change: 0.02 | |
| Week Change: 1.87% Year-to-date Change: -11.1% | |
| OSW Links: Profile News Message Board | |
| Charts:- Daily , Weekly | |
| Add OSW to Watchlist: View: Get Complete OSW Trend Analysis ➞ | |
 | HELE Helen of Troy Limited |
| Sector: Consumer Staples | |
| SubSector: Housewares & Accessories | |
| MarketCap: 3199.53 Millions | |
| Recent Price: 90.85 Smart Investing & Trading Score: 0 | |
| Day Percent Change: 0.15% Day Change: 0.14 | |
| Week Change: -9.15% Year-to-date Change: -24.8% | |
| HELE Links: Profile News Message Board | |
| Charts:- Daily , Weekly | |
| Add HELE to Watchlist: View: Get Complete HELE Trend Analysis ➞ | |
 | ASB Associated Banc-Corp |
| Sector: Financials | |
| SubSector: Regional - Midwest Banks | |
| MarketCap: 1904.8 Millions | |
| Recent Price: 21.37 Smart Investing & Trading Score: 93 | |
| Day Percent Change: 0.14% Day Change: 0.03 | |
| Week Change: 3.99% Year-to-date Change: -0.1% | |
| ASB Links: Profile News Message Board | |
| Charts:- Daily , Weekly | |
| Add ASB to Watchlist: View: Get Complete ASB Trend Analysis ➞ | |
 | HRT HireRight Holdings Corporation |
| Sector: Industrials | |
| SubSector: Staffing & Employment Services | |
| MarketCap: 823 Millions | |
| Recent Price: 14.29 Smart Investing & Trading Score: 68 | |
| Day Percent Change: 0.14% Day Change: 0.02 | |
| Week Change: 0.35% Year-to-date Change: 6.3% | |
| HRT Links: Profile News Message Board | |
| Charts:- Daily , Weekly | |
| Add HRT to Watchlist: View: Get Complete HRT Trend Analysis ➞ | |
 | ARL American Realty Investors, Inc. |
| Sector: Financials | |
| SubSector: Property Management | |
| MarketCap: 132.242 Millions | |
| Recent Price: 13.85 Smart Investing & Trading Score: 10 | |
| Day Percent Change: 0.14% Day Change: 0.02 | |
| Week Change: -6.42% Year-to-date Change: -20.5% | |
| ARL Links: Profile News Message Board | |
| Charts:- Daily , Weekly | |
| Add ARL to Watchlist: View: Get Complete ARL Trend Analysis ➞ | |
 | MTRN Materion Corporation |
| Sector: Materials | |
| SubSector: Industrial Metals & Minerals | |
| MarketCap: 703.71 Millions | |
| Recent Price: 118.63 Smart Investing & Trading Score: 36 | |
| Day Percent Change: 0.14% Day Change: 0.17 | |
| Week Change: -0.71% Year-to-date Change: -8.8% | |
| MTRN Links: Profile News Message Board | |
| Charts:- Daily , Weekly | |
| Add MTRN to Watchlist: View: Get Complete MTRN Trend Analysis ➞ | |
 | RKLB Rocket Lab USA, Inc. |
| Sector: Industrials | |
| SubSector: Aerospace & Defense | |
| MarketCap: 2820 Millions | |
| Recent Price: 3.65 Smart Investing & Trading Score: 20 | |
| Day Percent Change: 0.14% Day Change: 0.00 | |
| Week Change: 2.82% Year-to-date Change: -33.8% | |
| RKLB Links: Profile News Message Board | |
| Charts:- Daily , Weekly | |
| Add RKLB to Watchlist: View: Get Complete RKLB Trend Analysis ➞ | |
 | SXI Standex International Corporation |
| Sector: Industrials | |
| SubSector: Industrial Equipment & Components | |
| MarketCap: 644.109 Millions | |
| Recent Price: 171.60 Smart Investing & Trading Score: 59 | |
| Day Percent Change: 0.13% Day Change: 0.23 | |
| Week Change: 2.42% Year-to-date Change: 8.4% | |
| SXI Links: Profile News Message Board | |
| Charts:- Daily , Weekly | |
| Add SXI to Watchlist: View: Get Complete SXI Trend Analysis ➞ | |
 | BELFB Bel Fuse Inc. |
| Sector: Technology | |
| SubSector: Diversified Electronics | |
| MarketCap: 77.0396 Millions | |
| Recent Price: 60.78 Smart Investing & Trading Score: 49 | |
| Day Percent Change: 0.13% Day Change: 0.08 | |
| Week Change: 7.44% Year-to-date Change: -9.0% | |
| BELFB Links: Profile News Message Board | |
| Charts:- Daily , Weekly | |
| Add BELFB to Watchlist: View: Get Complete BELFB Trend Analysis ➞ | |
 | OFLX Omega Flex, Inc. |
| Sector: Industrials | |
| SubSector: Industrial Equipment & Components | |
| MarketCap: 590.609 Millions | |
| Recent Price: 67.59 Smart Investing & Trading Score: 42 | |
| Day Percent Change: 0.13% Day Change: 0.09 | |
| Week Change: 0.88% Year-to-date Change: -4.1% | |
| OFLX Links: Profile News Message Board | |
| Charts:- Daily , Weekly | |
| Add OFLX to Watchlist: View: Get Complete OFLX Trend Analysis ➞ | |
 | AKYA Akoya Biosciences, Inc. |
| Sector: Health Care | |
| SubSector: Medical Instruments & Supplies | |
| MarketCap: 340 Millions | |
| Recent Price: 3.82 Smart Investing & Trading Score: 30 | |
| Day Percent Change: 0.13% Day Change: 0.00 | |
| Week Change: 0.53% Year-to-date Change: -21.9% | |
| AKYA Links: Profile News Message Board | |
| Charts:- Daily , Weekly | |
| Add AKYA to Watchlist: View: Get Complete AKYA Trend Analysis ➞ | |
 | VERA Vera Therapeutics, Inc. |
| Sector: Health Care | |
| SubSector: Biotechnology | |
| MarketCap: 746 Millions | |
| Recent Price: 38.69 Smart Investing & Trading Score: 68 | |
| Day Percent Change: 0.13% Day Change: 0.05 | |
| Week Change: 1.82% Year-to-date Change: 149.9% | |
| VERA Links: Profile News Message Board | |
| Charts:- Daily , Weekly | |
| Add VERA to Watchlist: View: Get Complete VERA Trend Analysis ➞ | |
 | LZ LegalZoom.com, Inc. |
| Sector: Industrials | |
| SubSector: Specialty Business Services | |
| MarketCap: 2330 Millions | |
| Recent Price: 12.27 Smart Investing & Trading Score: 63 | |
| Day Percent Change: 0.12% Day Change: 0.01 | |
| Week Change: 4.6% Year-to-date Change: 8.1% | |
| LZ Links: Profile News Message Board | |
| Charts:- Daily , Weekly | |
| Add LZ to Watchlist: View: Get Complete LZ Trend Analysis ➞ | |
 | EVBN Evans Bancorp, Inc. |
| Sector: Financials | |
| SubSector: Regional - Northeast Banks | |
| MarketCap: 124.899 Millions | |
| Recent Price: 26.03 Smart Investing & Trading Score: 10 | |
| Day Percent Change: 0.12% Day Change: 0.03 | |
| Week Change: -0.61% Year-to-date Change: -17.4% | |
| EVBN Links: Profile News Message Board | |
| Charts:- Daily , Weekly | |
| Add EVBN to Watchlist: View: Get Complete EVBN Trend Analysis ➞ | |
 | RGNX REGENXBIO Inc. |
| Sector: Health Care | |
| SubSector: Biotechnology | |
| MarketCap: 1232.85 Millions | |
| Recent Price: 16.06 Smart Investing & Trading Score: 36 | |
| Day Percent Change: 0.12% Day Change: 0.02 | |
| Week Change: 2.36% Year-to-date Change: -10.5% | |
| RGNX Links: Profile News Message Board | |
| Charts:- Daily , Weekly | |
| Add RGNX to Watchlist: View: Get Complete RGNX Trend Analysis ➞ | |
 | CVGW Calavo Growers, Inc. |
| Sector: Consumer Staples | |
| SubSector: Farm Products | |
| MarketCap: 935.287 Millions | |
| Recent Price: 27.41 Smart Investing & Trading Score: 80 | |
| Day Percent Change: 0.11% Day Change: 0.03 | |
| Week Change: -3.52% Year-to-date Change: -6.8% | |
| CVGW Links: Profile News Message Board | |
| Charts:- Daily , Weekly | |
| Add CVGW to Watchlist: View: Get Complete CVGW Trend Analysis ➞ | |
 | ENV Envestnet, Inc. |
| Sector: Services & Goods | |
| SubSector: Business Services | |
| MarketCap: 3114.02 Millions | |
| Recent Price: 62.36 Smart Investing & Trading Score: 63 | |
| Day Percent Change: 0.11% Day Change: 0.07 | |
| Week Change: -1.53% Year-to-date Change: 25.9% | |
| ENV Links: Profile News Message Board | |
| Charts:- Daily , Weekly | |
| Add ENV to Watchlist: View: Get Complete ENV Trend Analysis ➞ | |
| Too many stocks? View smallcap stocks filtered by marketcap & sector |
| Marketcap: All SmallCap Stocks (default-no microcap), Large, Mid-Range, Small & MicroCap |
| Sector: Tech, Finance, Energy, Staples, Retail, Industrial, Materials, Utilities & Medical |
|
Best Stocks Today 12Stocks.com |
© 2024 12Stocks.com Terms & Conditions Privacy Contact Us
All Information Provided Only For Education And Not To Be Used For Investing or Trading. See Terms & Conditions


One More Thing ... Get Best Stocks Delivered Daily!
Never Ever Miss A Move With Our Top Ten Stocks Lists
Find Best Stocks In Any Market - Bull or Bear Market
Take A Peek At Our Top Ten Stocks Lists: Daily, Weekly, Year-to-Date & Top Trends
Find Best Stocks In Any Market - Bull or Bear Market
Take A Peek At Our Top Ten Stocks Lists: Daily, Weekly, Year-to-Date & Top Trends
Smallcap Stocks With Best Up Trends [0-bearish to 100-bullish]: B. Riley[100], Central Pacific[100], California Water[100], Cricut [100], Carpenter [100], Haemonetics [100], Sanmina [100], Trustmark [100], Comstock Resources[100], EchoStar [100], Mueller Industries[100]
Best Smallcap Stocks Year-to-Date:
CareMax [490.72%], Janux [338.34%], Viking [270.02%], Alpine Immune[239.52%], Longboard [218%], Super Micro[177%], Arcutis Bio[166.56%], Avidity Biosciences[159.79%], Vera [149.94%], Hippo [128.87%], Stoke [122.15%] Best Smallcap Stocks This Week:
Matterport [168.97%], B. Riley[73.54%], Impinj [33.73%], ProKidney [32.84%], Seres [32.65%], Riot Blockchain[32.64%], Ribbon [25.58%], Cullinan Oncology[22.92%], P.A.M. Transportation[22.85%], NuScale Power[21.44%], Hibbett Sports[21.03%] Best Smallcap Stocks Daily:
Impinj [28.65%], P.A.M. Transportation[17.95%], B. Riley[16.61%], Strategic Education[16.28%], OptiNose [14.56%], JELD-WEN Holding[11.54%], Sonic Automotive[10.86%], Intevac [10.54%], SiTime [8.84%], Noodles & [8.08%], ProKidney [7.75%]