
 Login Sign Up


| |||||
 |  | ||||

| 12Stocks.com Market Intelligence |
Best SmallCap Stocks
|
| In a hurry? Small Cap Stock Lists: Performance Trends Table, Stock Charts
Sort Small Cap stocks: Daily, Weekly, Year-to-Date, Market Cap & Trends. Filter Small Cap stocks list by sector: Show all, Tech, Finance, Energy, Staples, Retail, Industrial, Materials, Utilities and HealthCare Filter Small Cap stocks list by size: All Large Medium Small and MicroCap |
| 12Stocks.com Small Cap Stocks Performances & Trends Daily | |||||||||
|
|  The overall Smart Investing & Trading Score is 44 (0-bearish to 100-bullish) which puts Small Cap index in short term neutral trend. The Smart Investing & Trading Score from previous trading session is 58 and hence a deterioration of trend.
| ||||||||
Here are the Smart Investing & Trading Scores of the most requested small cap stocks at 12Stocks.com (click stock name for detailed review):
|


| 12Stocks.com: Investing in Smallcap Index with Stocks | |
|
The following table helps investors and traders sort through current performance and trends (as measured by Smart Investing & Trading Score) of various
stocks in the Smallcap Index. Quick View: Move mouse or cursor over stock symbol (ticker) to view short-term technical chart and over stock name to view long term chart. Click on  to add stock symbol to your watchlist and to add stock symbol to your watchlist and  to view watchlist. Click on any ticker or stock name for detailed market intelligence report for that stock. to view watchlist. Click on any ticker or stock name for detailed market intelligence report for that stock. |
12Stocks.com Performance of Stocks in Smallcap Index
| Ticker | Stock Name | Watchlist | Category | Recent Price | Smart Investing & Trading Score | Change % | YTD Change% |
| MNTK | Montauk Renewables |   | Utilities | 3.79 | 42 | 5.13 | -57.65% |
| LRN | K12 | | Services & Goods | 66.36 | 90 | 4.95 | 11.77% |
| ATLC | Atlanticus | | Financials | 26.10 | 42 | 4.90 | -32.51% |
| SNBR | Sleep Number | | Consumer Staples | 14.23 | 75 | 4.86 | -4.05% |
| SG | Sweetgreen | | Services & Goods | 22.76 | 61 | 4.79 | 101.42% |
| BYND | Beyond Meat | | Consumer Staples | 6.34 | 22 | 4.70 | -28.71% |
| SANA | Sana | | Health Care | 8.50 | 63 | 4.68 | 105.56% |
| VICR | Vicor | | Technology | 33.48 | 10 | 4.53 | -25.50% |
| EXFY | Expensify | | Technology | 1.64 | 37 | 4.46 | -34.92% |
| SMCI | Super Micro | | Technology | 787.40 | 58 | 4.33 | 177.00% |
| EYEN | Eyenovia | | Health Care | 0.61 | 49 | 4.27 | -70.58% |
| CARA | Cara | | Health Care | 0.70 | 61 | 4.23 | -5.79% |
| SGH | SMART Global | | Technology | 18.51 | 17 | 4.22 | -2.22% |
| LVWR | LiveWire Group | | Services & Goods | 7.08 | 25 | 4.12 | -39.18% |
| SLAB | Silicon | | Technology | 118.93 | 0 | 4.09 | -10.09% |
| CUTR | Cutera | | Health Care | 2.04 | 52 | 4.08 | -42.13% |
| CPF | Central Pacific | | Financials | 20.76 | 100 | 4.06 | 5.49% |
| LYTS | LSI Industries | | Industrials | 15.18 | 44 | 4.04 | 7.81% |
| ARCH | Arch Coal | | Materials | 165.43 | 32 | 3.89 | -0.31% |
| FGEN | FibroGen | | Health Care | 1.02 | 20 | 3.63 | 15.09% |
| CASH | Meta Financial | | Financials | 52.92 | 62 | 3.58 | -0.02% |
| PRLD | Prelude | | Health Care | 4.05 | 63 | 3.58 | -6.90% |
| PLXS | Plexus | | Technology | 99.09 | 93 | 3.57 | -8.36% |
| DC | Dakota Gold | | Materials | 2.44 | 43 | 3.38 | -5.96% |
| CLB | Core | | Energy | 17.07 | 50 | 3.27 | -3.34% |


| Too many stocks? View smallcap stocks filtered by marketcap & sector |
| Marketcap: All SmallCap Stocks (default-no microcap), Large, Mid-Range, Small |
| Smallcap Sector: Tech, Finance, Energy, Staples, Retail, Industrial, Materials, & Medical |
|
Get the most comprehensive stock market coverage daily at 12Stocks.com ➞ Best Stocks Today ➞ Best Stocks Weekly ➞ Best Stocks Year-to-Date ➞ Best Stocks Trends ➞  Best Stocks Today 12Stocks.com Best Nasdaq Stocks ➞ Best S&P 500 Stocks ➞ Best Tech Stocks ➞ Best Biotech Stocks ➞ |
| Detailed Overview of SmallCap Stocks |
| SmallCap Technical Overview, Leaders & Laggards, Top SmallCap ETF Funds & Detailed SmallCap Stocks List, Charts, Trends & More |
| Smallcap: Technical Analysis, Trends & YTD Performance | |
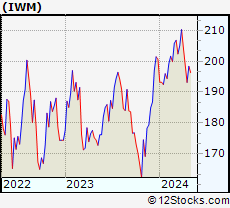
| SmallCap segment as represented by
IWM, an exchange-traded fund [ETF], holds basket of thousands of smallcap stocks from across all major sectors of the US stock market. The smallcap index (contains stocks like Riverbed & Sotheby's) is down by -2.11% and is currently underperforming the overall market by -7.27% year-to-date. Below is a quick view of technical charts and trends: | |
 IWM Weekly Chart |
|
| Long Term Trend: Good | |
| Medium Term Trend: Not Good | |
 IWM Daily Chart |
|
| Short Term Trend: Very Good | |
| Overall Trend Score: 44 | |
| YTD Performance: -2.11% | |
| **Trend Scores & Views Are Only For Educational Purposes And Not For Investing | |
| 12Stocks.com: Top Performing Small Cap Index Stocks | ||||||||||||||||||||||||||||||||||||||||||||||||
 The top performing Small Cap Index stocks year to date are
Now, more recently, over last week, the top performing Small Cap Index stocks on the move are


|
||||||||||||||||||||||||||||||||||||||||||||||||
| 12Stocks.com: Investing in Smallcap Index using Exchange Traded Funds | |
|
The following table shows list of key exchange traded funds (ETF) that
help investors track Smallcap index. The following list also includes leveraged ETF funds that track twice or thrice the daily returns of Smallcap indices. Short or inverse ETF funds move in the opposite direction to the index they track and are useful during market pullbacks or during bear markets. Quick View: Move mouse or cursor over ETF symbol (ticker) to view short-term technical chart and over ETF name to view long term chart. Click on ticker or stock name for detailed view. Click on to add stock symbol to your watchlist and to view watchlist. |
12Stocks.com List of ETFs that track Smallcap Index
| Ticker | ETF Name | Watchlist | Recent Price | Smart Investing & Trading Score | Change % | Week % | Year-to-date % |
| IWM | iShares Russell 2000 | | 196.48 | 44 | -0.61 | 1.73 | -2.11% |
| IJR | iShares Core S&P Small-Cap | | 104.86 | 78 | -0.80 | 1.59 | -3.13% |
| VTWO | Vanguard Russell 2000 ETF | | 79.45 | 63 | -0.60 | 1.75 | -2.03% |
| IWN | iShares Russell 2000 Value | | 150.18 | 68 | -0.73 | 1.62 | -3.32% |
| IWO | iShares Russell 2000 Growth | | 249.86 | 51 | -0.56 | 1.86 | -0.94% |
| IJS | iShares S&P Small-Cap 600 Value | | 96.69 | 60 | -1.04 | 1.13 | -6.19% |
| IJT | iShares S&P Small-Cap 600 Growth | | 125.06 | 63 | -0.25 | 2.33 | -0.06% |
| XSLV | PowerShares S&P SmallCap Low Volatil ETF | | 42.54 | 73 | -0.93 | 0.85 | -3.65% |
| SDD | ProShares UltraShort SmallCap600 | | 19.58 | 42 | 0.46 | -3.74 | 6.26% |
| SBB | ProShares Short SmallCap600 | | 16.50 | 40 | 0.79 | -2.02 | 3.58% |
| SMLV | SPDR SSGA US Small Cap Low Volatil ETF | | 107.33 | 73 | -1.01 | 1.17 | -4.61% |
| SAA | ProShares Ultra SmallCap600 | | 22.66 | 58 | -1.52 | 3.94 | -9.18% |
| 12Stocks.com: Charts, Trends, Fundamental Data and Performances of SmallCap Stocks | |
|
We now take in-depth look at all SmallCap stocks including charts, multi-period performances and overall trends (as measured by Smart Investing & Trading Score). One can sort SmallCap stocks (click link to choose) by Daily, Weekly and by Year-to-Date performances. Also, one can sort by size of the company or by market capitalization. |
| Select Your Default Chart Type: | |||||
| |||||
| Click on stock symbol or name for detailed view. Click on to add stock symbol to your watchlist and to view watchlist. Quick View: Move mouse or cursor over "Daily" to quickly view daily technical stock chart and over "Weekly" to view weekly technical stock chart. | |||||

 | MNTK Montauk Renewables, Inc. |
| Sector: Utilities | |
| SubSector: Utilities - Diversified | |
| MarketCap: 1020 Millions | |
| Recent Price: 3.79 Smart Investing & Trading Score: 42 | |
| Day Percent Change: 5.13% Day Change: 0.19 | |
| Week Change: 8.91% Year-to-date Change: -57.7% | |
| MNTK Links: Profile News Message Board | |
| Charts:- Daily , Weekly | |
| Add MNTK to Watchlist: View: Get Complete MNTK Trend Analysis ➞ | |
 | LRN K12 Inc. |
| Sector: Services & Goods | |
| SubSector: Education & Training Services | |
| MarketCap: 549.606 Millions | |
| Recent Price: 66.36 Smart Investing & Trading Score: 90 | |
| Day Percent Change: 4.95% Day Change: 3.13 | |
| Week Change: 17.39% Year-to-date Change: 11.8% | |
| LRN Links: Profile News Message Board | |
| Charts:- Daily , Weekly | |
| Add LRN to Watchlist: View: Get Complete LRN Trend Analysis ➞ | |
 | ATLC Atlanticus Holdings Corporation |
| Sector: Financials | |
| SubSector: Credit Services | |
| MarketCap: 122.008 Millions | |
| Recent Price: 26.10 Smart Investing & Trading Score: 42 | |
| Day Percent Change: 4.90% Day Change: 1.22 | |
| Week Change: 7.23% Year-to-date Change: -32.5% | |
| ATLC Links: Profile News Message Board | |
| Charts:- Daily , Weekly | |
| Add ATLC to Watchlist: View: Get Complete ATLC Trend Analysis ➞ | |
 | SNBR Sleep Number Corporation |
| Sector: Consumer Staples | |
| SubSector: Home Furnishings & Fixtures | |
| MarketCap: 692.735 Millions | |
| Recent Price: 14.23 Smart Investing & Trading Score: 75 | |
| Day Percent Change: 4.86% Day Change: 0.66 | |
| Week Change: 4.56% Year-to-date Change: -4.1% | |
| SNBR Links: Profile News Message Board | |
| Charts:- Daily , Weekly | |
| Add SNBR to Watchlist: View: Get Complete SNBR Trend Analysis ➞ | |
 | SG Sweetgreen, Inc. |
| Sector: Services & Goods | |
| SubSector: Restaurants | |
| MarketCap: 1420 Millions | |
| Recent Price: 22.76 Smart Investing & Trading Score: 61 | |
| Day Percent Change: 4.79% Day Change: 1.04 | |
| Week Change: 10.22% Year-to-date Change: 101.4% | |
| SG Links: Profile News Message Board | |
| Charts:- Daily , Weekly | |
| Add SG to Watchlist: View: Get Complete SG Trend Analysis ➞ | |
 | BYND Beyond Meat, Inc. |
| Sector: Consumer Staples | |
| SubSector: Processed & Packaged Goods | |
| MarketCap: 3987.98 Millions | |
| Recent Price: 6.34 Smart Investing & Trading Score: 22 | |
| Day Percent Change: 4.70% Day Change: 0.29 | |
| Week Change: -1.01% Year-to-date Change: -28.7% | |
| BYND Links: Profile News Message Board | |
| Charts:- Daily , Weekly | |
| Add BYND to Watchlist: View: Get Complete BYND Trend Analysis ➞ | |
 | SANA Sana Biotechnology, Inc. |
| Sector: Health Care | |
| SubSector: Biotechnology | |
| MarketCap: 1210 Millions | |
| Recent Price: 8.50 Smart Investing & Trading Score: 63 | |
| Day Percent Change: 4.68% Day Change: 0.38 | |
| Week Change: 11.7% Year-to-date Change: 105.6% | |
| SANA Links: Profile News Message Board | |
| Charts:- Daily , Weekly | |
| Add SANA to Watchlist: View: Get Complete SANA Trend Analysis ➞ | |
 | VICR Vicor Corporation |
| Sector: Technology | |
| SubSector: Diversified Electronics | |
| MarketCap: 1526.76 Millions | |
| Recent Price: 33.48 Smart Investing & Trading Score: 10 | |
| Day Percent Change: 4.53% Day Change: 1.45 | |
| Week Change: -1.15% Year-to-date Change: -25.5% | |
| VICR Links: Profile News Message Board | |
| Charts:- Daily , Weekly | |
| Add VICR to Watchlist: View: Get Complete VICR Trend Analysis ➞ | |
 | EXFY Expensify, Inc. |
| Sector: Technology | |
| SubSector: Software - Application | |
| MarketCap: 678 Millions | |
| Recent Price: 1.64 Smart Investing & Trading Score: 37 | |
| Day Percent Change: 4.46% Day Change: 0.07 | |
| Week Change: 0% Year-to-date Change: -34.9% | |
| EXFY Links: Profile News Message Board | |
| Charts:- Daily , Weekly | |
| Add EXFY to Watchlist: View: Get Complete EXFY Trend Analysis ➞ | |
 | SMCI Super Micro Computer, Inc. |
| Sector: Technology | |
| SubSector: Networking & Communication Devices | |
| MarketCap: 1200.02 Millions | |
| Recent Price: 787.40 Smart Investing & Trading Score: 58 | |
| Day Percent Change: 4.33% Day Change: 32.68 | |
| Week Change: 10.33% Year-to-date Change: 177.0% | |
| SMCI Links: Profile News Message Board | |
| Charts:- Daily , Weekly | |
| Add SMCI to Watchlist: View: Get Complete SMCI Trend Analysis ➞ | |
 | EYEN Eyenovia, Inc. |
| Sector: Health Care | |
| SubSector: Biotechnology | |
| MarketCap: 52.2785 Millions | |
| Recent Price: 0.61 Smart Investing & Trading Score: 49 | |
| Day Percent Change: 4.27% Day Change: 0.03 | |
| Week Change: 7.13% Year-to-date Change: -70.6% | |
| EYEN Links: Profile News Message Board | |
| Charts:- Daily , Weekly | |
| Add EYEN to Watchlist: View: Get Complete EYEN Trend Analysis ➞ | |
 | CARA Cara Therapeutics, Inc. |
| Sector: Health Care | |
| SubSector: Biotechnology | |
| MarketCap: 597.985 Millions | |
| Recent Price: 0.70 Smart Investing & Trading Score: 61 | |
| Day Percent Change: 4.23% Day Change: 0.03 | |
| Week Change: 5.9% Year-to-date Change: -5.8% | |
| CARA Links: Profile News Message Board | |
| Charts:- Daily , Weekly | |
| Add CARA to Watchlist: View: Get Complete CARA Trend Analysis ➞ | |
 | SGH SMART Global Holdings, Inc. |
| Sector: Technology | |
| SubSector: Semiconductor- Memory Chips | |
| MarketCap: 657.8 Millions | |
| Recent Price: 18.51 Smart Investing & Trading Score: 17 | |
| Day Percent Change: 4.22% Day Change: 0.75 | |
| Week Change: 9.4% Year-to-date Change: -2.2% | |
| SGH Links: Profile News Message Board | |
| Charts:- Daily , Weekly | |
| Add SGH to Watchlist: View: Get Complete SGH Trend Analysis ➞ | |
 | LVWR LiveWire Group, Inc. |
| Sector: Services & Goods | |
| SubSector: Auto Manufacturers | |
| MarketCap: 2400 Millions | |
| Recent Price: 7.08 Smart Investing & Trading Score: 25 | |
| Day Percent Change: 4.12% Day Change: 0.28 | |
| Week Change: -6.35% Year-to-date Change: -39.2% | |
| LVWR Links: Profile News Message Board | |
| Charts:- Daily , Weekly | |
| Add LVWR to Watchlist: View: Get Complete LVWR Trend Analysis ➞ | |
 | SLAB Silicon Laboratories Inc. |
| Sector: Technology | |
| SubSector: Semiconductor - Integrated Circuits | |
| MarketCap: 3710.2 Millions | |
| Recent Price: 118.93 Smart Investing & Trading Score: 0 | |
| Day Percent Change: 4.09% Day Change: 4.67 | |
| Week Change: 3.25% Year-to-date Change: -10.1% | |
| SLAB Links: Profile News Message Board | |
| Charts:- Daily , Weekly | |
| Add SLAB to Watchlist: View: Get Complete SLAB Trend Analysis ➞ | |
 | CUTR Cutera, Inc. |
| Sector: Health Care | |
| SubSector: Medical Appliances & Equipment | |
| MarketCap: 143.68 Millions | |
| Recent Price: 2.04 Smart Investing & Trading Score: 52 | |
| Day Percent Change: 4.08% Day Change: 0.08 | |
| Week Change: 4.62% Year-to-date Change: -42.1% | |
| CUTR Links: Profile News Message Board | |
| Charts:- Daily , Weekly | |
| Add CUTR to Watchlist: View: Get Complete CUTR Trend Analysis ➞ | |
 | CPF Central Pacific Financial Corp. |
| Sector: Financials | |
| SubSector: Regional - Pacific Banks | |
| MarketCap: 407.429 Millions | |
| Recent Price: 20.76 Smart Investing & Trading Score: 100 | |
| Day Percent Change: 4.06% Day Change: 0.81 | |
| Week Change: 7.62% Year-to-date Change: 5.5% | |
| CPF Links: Profile News Message Board | |
| Charts:- Daily , Weekly | |
| Add CPF to Watchlist: View: Get Complete CPF Trend Analysis ➞ | |
 | LYTS LSI Industries Inc. |
| Sector: Industrials | |
| SubSector: Industrial Electrical Equipment | |
| MarketCap: 85.7879 Millions | |
| Recent Price: 15.18 Smart Investing & Trading Score: 44 | |
| Day Percent Change: 4.04% Day Change: 0.59 | |
| Week Change: 3.27% Year-to-date Change: 7.8% | |
| LYTS Links: Profile News Message Board | |
| Charts:- Daily , Weekly | |
| Add LYTS to Watchlist: View: Get Complete LYTS Trend Analysis ➞ | |
 | ARCH Arch Coal, Inc. |
| Sector: Materials | |
| SubSector: Industrial Metals & Minerals | |
| MarketCap: 547.21 Millions | |
| Recent Price: 165.43 Smart Investing & Trading Score: 32 | |
| Day Percent Change: 3.89% Day Change: 6.19 | |
| Week Change: 1.38% Year-to-date Change: -0.3% | |
| ARCH Links: Profile News Message Board | |
| Charts:- Daily , Weekly | |
| Add ARCH to Watchlist: View: Get Complete ARCH Trend Analysis ➞ | |
 | FGEN FibroGen, Inc. |
| Sector: Health Care | |
| SubSector: Biotechnology | |
| MarketCap: 2502.95 Millions | |
| Recent Price: 1.02 Smart Investing & Trading Score: 20 | |
| Day Percent Change: 3.63% Day Change: 0.04 | |
| Week Change: -11.3% Year-to-date Change: 15.1% | |
| FGEN Links: Profile News Message Board | |
| Charts:- Daily , Weekly | |
| Add FGEN to Watchlist: View: Get Complete FGEN Trend Analysis ➞ | |
 | CASH Meta Financial Group, Inc. |
| Sector: Financials | |
| SubSector: Savings & Loans | |
| MarketCap: 849.33 Millions | |
| Recent Price: 52.92 Smart Investing & Trading Score: 62 | |
| Day Percent Change: 3.58% Day Change: 1.83 | |
| Week Change: 5.02% Year-to-date Change: 0.0% | |
| CASH Links: Profile News Message Board | |
| Charts:- Daily , Weekly | |
| Add CASH to Watchlist: View: Get Complete CASH Trend Analysis ➞ | |
 | PRLD Prelude Therapeutics Incorporated |
| Sector: Health Care | |
| SubSector: Biotechnology | |
| MarketCap: 26087 Millions | |
| Recent Price: 4.05 Smart Investing & Trading Score: 63 | |
| Day Percent Change: 3.58% Day Change: 0.14 | |
| Week Change: 13.45% Year-to-date Change: -6.9% | |
| PRLD Links: Profile News Message Board | |
| Charts:- Daily , Weekly | |
| Add PRLD to Watchlist: View: Get Complete PRLD Trend Analysis ➞ | |
 | PLXS Plexus Corp. |
| Sector: Technology | |
| SubSector: Printed Circuit Boards | |
| MarketCap: 1457.15 Millions | |
| Recent Price: 99.09 Smart Investing & Trading Score: 93 | |
| Day Percent Change: 3.57% Day Change: 3.42 | |
| Week Change: 6.27% Year-to-date Change: -8.4% | |
| PLXS Links: Profile News Message Board | |
| Charts:- Daily , Weekly | |
| Add PLXS to Watchlist: View: Get Complete PLXS Trend Analysis ➞ | |
 | DC Dakota Gold Corp. |
| Sector: Materials | |
| SubSector: Gold | |
| MarketCap: 218 Millions | |
| Recent Price: 2.44 Smart Investing & Trading Score: 43 | |
| Day Percent Change: 3.38% Day Change: 0.08 | |
| Week Change: -2.98% Year-to-date Change: -6.0% | |
| DC Links: Profile News Message Board | |
| Charts:- Daily , Weekly | |
| Add DC to Watchlist: View: Get Complete DC Trend Analysis ➞ | |
 | CLB Core Laboratories N.V. |
| Sector: Energy | |
| SubSector: Oil & Gas Equipment & Services | |
| MarketCap: 599.661 Millions | |
| Recent Price: 17.07 Smart Investing & Trading Score: 50 | |
| Day Percent Change: 3.27% Day Change: 0.54 | |
| Week Change: -0.64% Year-to-date Change: -3.3% | |
| CLB Links: Profile News Message Board | |
| Charts:- Daily , Weekly | |
| Add CLB to Watchlist: View: Get Complete CLB Trend Analysis ➞ | |
| Too many stocks? View smallcap stocks filtered by marketcap & sector |
| Marketcap: All SmallCap Stocks (default-no microcap), Large, Mid-Range, Small & MicroCap |
| Sector: Tech, Finance, Energy, Staples, Retail, Industrial, Materials, Utilities & Medical |
|
Best Stocks Today 12Stocks.com |
© 2024 12Stocks.com Terms & Conditions Privacy Contact Us
All Information Provided Only For Education And Not To Be Used For Investing or Trading. See Terms & Conditions


One More Thing ... Get Best Stocks Delivered Daily!
Never Ever Miss A Move With Our Top Ten Stocks Lists
Find Best Stocks In Any Market - Bull or Bear Market
Take A Peek At Our Top Ten Stocks Lists: Daily, Weekly, Year-to-Date & Top Trends
Find Best Stocks In Any Market - Bull or Bear Market
Take A Peek At Our Top Ten Stocks Lists: Daily, Weekly, Year-to-Date & Top Trends
Smallcap Stocks With Best Up Trends [0-bearish to 100-bullish]: B. Riley[100], Central Pacific[100], California Water[100], Cricut [100], Carpenter [100], Haemonetics [100], Sanmina [100], Trustmark [100], Comstock Resources[100], EchoStar [100], Mueller Industries[100]
Best Smallcap Stocks Year-to-Date:
CareMax [490.72%], Janux [338.34%], Viking [270.02%], Alpine Immune[239.52%], Longboard [218%], Super Micro[177%], Arcutis Bio[166.56%], Avidity Biosciences[159.79%], Vera [149.94%], Hippo [128.87%], Stoke [122.15%] Best Smallcap Stocks This Week:
Matterport [168.97%], B. Riley[73.54%], Impinj [33.73%], ProKidney [32.84%], Seres [32.65%], Riot Blockchain[32.64%], Ribbon [25.58%], Cullinan Oncology[22.92%], P.A.M. Transportation[22.85%], NuScale Power[21.44%], Hibbett Sports[21.03%] Best Smallcap Stocks Daily:
Impinj [28.65%], P.A.M. Transportation[17.95%], B. Riley[16.61%], Strategic Education[16.28%], OptiNose [14.56%], JELD-WEN Holding[11.54%], Sonic Automotive[10.86%], Intevac [10.54%], SiTime [8.84%], Noodles & [8.08%], ProKidney [7.75%]