
 Login Sign Up


| |||||
 |  | ||||

| 12Stocks.com Market Intelligence |
Best SmallCap Stocks
|
| In a hurry? Small Cap Stock Lists: Performance Trends Table, Stock Charts
Sort Small Cap stocks: Daily, Weekly, Year-to-Date, Market Cap & Trends. Filter Small Cap stocks list by sector: Show all, Tech, Finance, Energy, Staples, Retail, Industrial, Materials, Utilities and HealthCare Filter Small Cap stocks list by size: All Large Medium Small and MicroCap |
| 12Stocks.com Small Cap Stocks Performances & Trends Daily | |||||||||
|
|  The overall Smart Investing & Trading Score is 56 (0-bearish to 100-bullish) which puts Small Cap index in short term neutral trend. The Smart Investing & Trading Score from previous trading session is 44 and hence an improvement of trend.
| ||||||||
Here are the Smart Investing & Trading Scores of the most requested small cap stocks at 12Stocks.com (click stock name for detailed review):
|


| 12Stocks.com: Investing in Smallcap Index with Stocks | |
|
The following table helps investors and traders sort through current performance and trends (as measured by Smart Investing & Trading Score) of various
stocks in the Smallcap Index. Quick View: Move mouse or cursor over stock symbol (ticker) to view short-term technical chart and over stock name to view long term chart. Click on  to add stock symbol to your watchlist and to add stock symbol to your watchlist and  to view watchlist. Click on any ticker or stock name for detailed market intelligence report for that stock. to view watchlist. Click on any ticker or stock name for detailed market intelligence report for that stock. |
12Stocks.com Performance of Stocks in Smallcap Index
| Ticker | Stock Name | Watchlist | Category | Recent Price | Smart Investing & Trading Score | Change % | YTD Change% |
| NSIT | Insight Enterprises |   | Technology | 182.75 | 62 | 0.10 | 3.14% |
| SHO | Sunstone Hotel | | Financials | 10.30 | 25 | 0.10 | -4.01% |
| FSBW | FS Bancorp | | Financials | 31.47 | 25 | 0.10 | -14.85% |
| KE | Kimball Electronics | | Technology | 20.82 | 57 | 0.10 | -22.75% |
| MCFT | MasterCraft Boat | | Consumer Staples | 20.55 | 54 | 0.10 | -9.23% |
| AGTI | Agiliti | | Health Care | 10.05 | 54 | 0.10 | 27.54% |
| NJR | New Jersey | | Utilities | 43.34 | 100 | 0.09 | -2.78% |
| MMI | Marcus & Millichap | | Financials | 32.27 | 49 | 0.09 | -26.12% |
| RLJ | RLJ Lodging | | Financials | 11.11 | 47 | 0.09 | -5.20% |
| RHP | Ryman Hospitality | | Financials | 107.06 | 32 | 0.09 | -2.73% |
| SNPO | Snap One | | Technology | 10.58 | 69 | 0.09 | 13.89% |
| BWFG | Bankwell Financial | | Financials | 23.84 | 50 | 0.08 | -21.01% |
| TRST | TrustCo Bank | | Financials | 27.08 | 54 | 0.07 | -12.79% |
| ERII | Energy Recovery | | Industrials | 14.20 | 42 | 0.07 | -24.63% |
| SEM | Select Medical | | Health Care | 27.41 | 61 | 0.07 | 16.64% |
| MODN | Model N | | Technology | 29.64 | 64 | 0.07 | 10.06% |
| EYE | National Vision | | Services & Goods | 17.88 | 27 | 0.06 | -14.57% |
| FCBC | First Community | | Financials | 33.51 | 42 | 0.06 | -9.68% |
| HIBB | Hibbett Sports | | Services & Goods | 86.15 | 93 | 0.06 | 19.62% |
| BMRC | Bank of Marin Bancorp | | Financials | 15.44 | 67 | 0.06 | -29.88% |
| FOR | Forestar Group | | Financials | 31.33 | 30 | 0.06 | -5.26% |
| ETNB | 89bio | | Health Care | 8.26 | 17 | 0.06 | -26.05% |
| CDRE | Cadre | | Industrials | 33.12 | 32 | 0.06 | 0.45% |
| SPTN | SpartanNash | | Consumer Staples | 19.31 | 47 | 0.05 | -15.86% |
| MYE | Myers Industries | | Consumer Staples | 22.04 | 75 | 0.05 | 12.74% |


| Too many stocks? View smallcap stocks filtered by marketcap & sector |
| Marketcap: All SmallCap Stocks (default-no microcap), Large, Mid-Range, Small |
| Smallcap Sector: Tech, Finance, Energy, Staples, Retail, Industrial, Materials, & Medical |
|
Get the most comprehensive stock market coverage daily at 12Stocks.com ➞ Best Stocks Today ➞ Best Stocks Weekly ➞ Best Stocks Year-to-Date ➞ Best Stocks Trends ➞  Best Stocks Today 12Stocks.com Best Nasdaq Stocks ➞ Best S&P 500 Stocks ➞ Best Tech Stocks ➞ Best Biotech Stocks ➞ |
| Detailed Overview of SmallCap Stocks |
| SmallCap Technical Overview, Leaders & Laggards, Top SmallCap ETF Funds & Detailed SmallCap Stocks List, Charts, Trends & More |
| Smallcap: Technical Analysis, Trends & YTD Performance | |
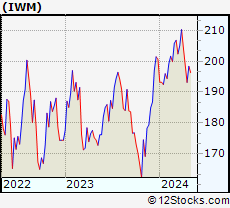
| SmallCap segment as represented by
IWM, an exchange-traded fund [ETF], holds basket of thousands of smallcap stocks from across all major sectors of the US stock market. The smallcap index (contains stocks like Riverbed & Sotheby's) is down by -1.16% and is currently underperforming the overall market by -7.3% year-to-date. Below is a quick view of technical charts and trends: | |
 IWM Weekly Chart |
|
| Long Term Trend: Good | |
| Medium Term Trend: Not Good | |
 IWM Daily Chart |
|
| Short Term Trend: Very Good | |
| Overall Trend Score: 56 | |
| YTD Performance: -1.16% | |
| **Trend Scores & Views Are Only For Educational Purposes And Not For Investing | |
| 12Stocks.com: Top Performing Small Cap Index Stocks | ||||||||||||||||||||||||||||||||||||||||||||||||
 The top performing Small Cap Index stocks year to date are
Now, more recently, over last week, the top performing Small Cap Index stocks on the move are


|
||||||||||||||||||||||||||||||||||||||||||||||||
| 12Stocks.com: Investing in Smallcap Index using Exchange Traded Funds | |
|
The following table shows list of key exchange traded funds (ETF) that
help investors track Smallcap index. The following list also includes leveraged ETF funds that track twice or thrice the daily returns of Smallcap indices. Short or inverse ETF funds move in the opposite direction to the index they track and are useful during market pullbacks or during bear markets. Quick View: Move mouse or cursor over ETF symbol (ticker) to view short-term technical chart and over ETF name to view long term chart. Click on ticker or stock name for detailed view. Click on to add stock symbol to your watchlist and to view watchlist. |
12Stocks.com List of ETFs that track Smallcap Index
| Ticker | ETF Name | Watchlist | Recent Price | Smart Investing & Trading Score | Change % | Week % | Year-to-date % |
| IWM | iShares Russell 2000 | | 198.39 | 56 | 0.97 | 2.72 | -1.16% |
| IJR | iShares Core S&P Small-Cap | | 105.65 | 85 | 0.75 | 2.35 | -2.4% |
| VTWO | Vanguard Russell 2000 ETF | | 80.22 | 70 | 0.97 | 2.74 | -1.09% |
| IWN | iShares Russell 2000 Value | | 151.14 | 75 | 0.64 | 2.27 | -2.7% |
| IWO | iShares Russell 2000 Growth | | 253.09 | 58 | 1.29 | 3.18 | 0.34% |
| IJS | iShares S&P Small-Cap 600 Value | | 97.19 | 67 | 0.52 | 1.65 | -5.7% |
| IJT | iShares S&P Small-Cap 600 Growth | | 126.09 | 70 | 0.82 | 3.17 | 0.76% |
| XSLV | PowerShares S&P SmallCap Low Volatil ETF | | 42.72 | 80 | 0.42 | 1.28 | -3.24% |
| SAA | ProShares Ultra SmallCap600 | | 23.04 | 65 | 1.68 | 5.69 | -7.66% |
| SBB | ProShares Short SmallCap600 | | 16.39 | 33 | -0.70 | -2.7 | 2.86% |
| SDD | ProShares UltraShort SmallCap600 | | 19.35 | 35 | -1.17 | -4.87 | 5.01% |
| SMLV | SPDR SSGA US Small Cap Low Volatil ETF | | 107.52 | 80 | 0.18 | 1.35 | -4.44% |
| 12Stocks.com: Charts, Trends, Fundamental Data and Performances of SmallCap Stocks | |
|
We now take in-depth look at all SmallCap stocks including charts, multi-period performances and overall trends (as measured by Smart Investing & Trading Score). One can sort SmallCap stocks (click link to choose) by Daily, Weekly and by Year-to-Date performances. Also, one can sort by size of the company or by market capitalization. |
| Select Your Default Chart Type: | |||||
| |||||
| Click on stock symbol or name for detailed view. Click on to add stock symbol to your watchlist and to view watchlist. Quick View: Move mouse or cursor over "Daily" to quickly view daily technical stock chart and over "Weekly" to view weekly technical stock chart. | |||||

 | NSIT Insight Enterprises, Inc. |
| Sector: Technology | |
| SubSector: Information Technology Services | |
| MarketCap: 1498.48 Millions | |
| Recent Price: 182.75 Smart Investing & Trading Score: 62 | |
| Day Percent Change: 0.10% Day Change: 0.18 | |
| Week Change: 0.09% Year-to-date Change: 3.1% | |
| NSIT Links: Profile News Message Board | |
| Charts:- Daily , Weekly | |
| Add NSIT to Watchlist: View: Get Complete NSIT Trend Analysis ➞ | |
 | SHO Sunstone Hotel Investors, Inc. |
| Sector: Financials | |
| SubSector: REIT - Hotel/Motel | |
| MarketCap: 1861.04 Millions | |
| Recent Price: 10.30 Smart Investing & Trading Score: 25 | |
| Day Percent Change: 0.10% Day Change: 0.01 | |
| Week Change: 0.88% Year-to-date Change: -4.0% | |
| SHO Links: Profile News Message Board | |
| Charts:- Daily , Weekly | |
| Add SHO to Watchlist: View: Get Complete SHO Trend Analysis ➞ | |
 | FSBW FS Bancorp, Inc. |
| Sector: Financials | |
| SubSector: Regional - Pacific Banks | |
| MarketCap: 140.429 Millions | |
| Recent Price: 31.47 Smart Investing & Trading Score: 25 | |
| Day Percent Change: 0.10% Day Change: 0.03 | |
| Week Change: -0.1% Year-to-date Change: -14.9% | |
| FSBW Links: Profile News Message Board | |
| Charts:- Daily , Weekly | |
| Add FSBW to Watchlist: View: Get Complete FSBW Trend Analysis ➞ | |
 | KE Kimball Electronics, Inc. |
| Sector: Technology | |
| SubSector: Diversified Electronics | |
| MarketCap: 308.896 Millions | |
| Recent Price: 20.82 Smart Investing & Trading Score: 57 | |
| Day Percent Change: 0.10% Day Change: 0.02 | |
| Week Change: 0.19% Year-to-date Change: -22.8% | |
| KE Links: Profile News Message Board | |
| Charts:- Daily , Weekly | |
| Add KE to Watchlist: View: Get Complete KE Trend Analysis ➞ | |
 | MCFT MasterCraft Boat Holdings, Inc. |
| Sector: Consumer Staples | |
| SubSector: Recreational Vehicles | |
| MarketCap: 152.059 Millions | |
| Recent Price: 20.55 Smart Investing & Trading Score: 54 | |
| Day Percent Change: 0.10% Day Change: 0.02 | |
| Week Change: -2.61% Year-to-date Change: -9.2% | |
| MCFT Links: Profile News Message Board | |
| Charts:- Daily , Weekly | |
| Add MCFT to Watchlist: View: Get Complete MCFT Trend Analysis ➞ | |
 | AGTI Agiliti, Inc. |
| Sector: Health Care | |
| SubSector: Health Information Services | |
| MarketCap: 2270 Millions | |
| Recent Price: 10.05 Smart Investing & Trading Score: 54 | |
| Day Percent Change: 0.10% Day Change: 0.01 | |
| Week Change: 0.1% Year-to-date Change: 27.5% | |
| AGTI Links: Profile News Message Board | |
| Charts:- Daily , Weekly | |
| Add AGTI to Watchlist: View: Get Complete AGTI Trend Analysis ➞ | |
 | NJR New Jersey Resources Corporation |
| Sector: Utilities | |
| SubSector: Gas Utilities | |
| MarketCap: 3320.27 Millions | |
| Recent Price: 43.34 Smart Investing & Trading Score: 100 | |
| Day Percent Change: 0.09% Day Change: 0.04 | |
| Week Change: -0.05% Year-to-date Change: -2.8% | |
| NJR Links: Profile News Message Board | |
| Charts:- Daily , Weekly | |
| Add NJR to Watchlist: View: Get Complete NJR Trend Analysis ➞ | |
 | MMI Marcus & Millichap, Inc. |
| Sector: Financials | |
| SubSector: Real Estate Development | |
| MarketCap: 1005.19 Millions | |
| Recent Price: 32.27 Smart Investing & Trading Score: 49 | |
| Day Percent Change: 0.09% Day Change: 0.03 | |
| Week Change: 4.03% Year-to-date Change: -26.1% | |
| MMI Links: Profile News Message Board | |
| Charts:- Daily , Weekly | |
| Add MMI to Watchlist: View: Get Complete MMI Trend Analysis ➞ | |
 | RLJ RLJ Lodging Trust |
| Sector: Financials | |
| SubSector: REIT - Hotel/Motel | |
| MarketCap: 1019.34 Millions | |
| Recent Price: 11.11 Smart Investing & Trading Score: 47 | |
| Day Percent Change: 0.09% Day Change: 0.01 | |
| Week Change: 0.63% Year-to-date Change: -5.2% | |
| RLJ Links: Profile News Message Board | |
| Charts:- Daily , Weekly | |
| Add RLJ to Watchlist: View: Get Complete RLJ Trend Analysis ➞ | |
 | RHP Ryman Hospitality Properties, Inc. |
| Sector: Financials | |
| SubSector: REIT - Hotel/Motel | |
| MarketCap: 1519.74 Millions | |
| Recent Price: 107.06 Smart Investing & Trading Score: 32 | |
| Day Percent Change: 0.09% Day Change: 0.10 | |
| Week Change: 2.52% Year-to-date Change: -2.7% | |
| RHP Links: Profile News Message Board | |
| Charts:- Daily , Weekly | |
| Add RHP to Watchlist: View: Get Complete RHP Trend Analysis ➞ | |
 | SNPO Snap One Holdings Corp. |
| Sector: Technology | |
| SubSector: Electronics & Computer Distribution | |
| MarketCap: 807 Millions | |
| Recent Price: 10.58 Smart Investing & Trading Score: 69 | |
| Day Percent Change: 0.09% Day Change: 0.01 | |
| Week Change: 0.19% Year-to-date Change: 13.9% | |
| SNPO Links: Profile News Message Board | |
| Charts:- Daily , Weekly | |
| Add SNPO to Watchlist: View: Get Complete SNPO Trend Analysis ➞ | |
 | BWFG Bankwell Financial Group, Inc. |
| Sector: Financials | |
| SubSector: Regional - Northeast Banks | |
| MarketCap: 142.899 Millions | |
| Recent Price: 23.84 Smart Investing & Trading Score: 50 | |
| Day Percent Change: 0.08% Day Change: 0.02 | |
| Week Change: -3.17% Year-to-date Change: -21.0% | |
| BWFG Links: Profile News Message Board | |
| Charts:- Daily , Weekly | |
| Add BWFG to Watchlist: View: Get Complete BWFG Trend Analysis ➞ | |
 | TRST TrustCo Bank Corp NY |
| Sector: Financials | |
| SubSector: Regional - Northeast Banks | |
| MarketCap: 543.999 Millions | |
| Recent Price: 27.08 Smart Investing & Trading Score: 54 | |
| Day Percent Change: 0.07% Day Change: 0.02 | |
| Week Change: 0.56% Year-to-date Change: -12.8% | |
| TRST Links: Profile News Message Board | |
| Charts:- Daily , Weekly | |
| Add TRST to Watchlist: View: Get Complete TRST Trend Analysis ➞ | |
 | ERII Energy Recovery, Inc. |
| Sector: Industrials | |
| SubSector: Pollution & Treatment Controls | |
| MarketCap: 429.375 Millions | |
| Recent Price: 14.20 Smart Investing & Trading Score: 42 | |
| Day Percent Change: 0.07% Day Change: 0.01 | |
| Week Change: 3.57% Year-to-date Change: -24.6% | |
| ERII Links: Profile News Message Board | |
| Charts:- Daily , Weekly | |
| Add ERII to Watchlist: View: Get Complete ERII Trend Analysis ➞ | |
 | SEM Select Medical Holdings Corporation |
| Sector: Health Care | |
| SubSector: Hospitals | |
| MarketCap: 1765.96 Millions | |
| Recent Price: 27.41 Smart Investing & Trading Score: 61 | |
| Day Percent Change: 0.07% Day Change: 0.02 | |
| Week Change: 1.29% Year-to-date Change: 16.6% | |
| SEM Links: Profile News Message Board | |
| Charts:- Daily , Weekly | |
| Add SEM to Watchlist: View: Get Complete SEM Trend Analysis ➞ | |
 | MODN Model N, Inc. |
| Sector: Technology | |
| SubSector: Application Software | |
| MarketCap: 670.162 Millions | |
| Recent Price: 29.64 Smart Investing & Trading Score: 64 | |
| Day Percent Change: 0.07% Day Change: 0.02 | |
| Week Change: 0.07% Year-to-date Change: 10.1% | |
| MODN Links: Profile News Message Board | |
| Charts:- Daily , Weekly | |
| Add MODN to Watchlist: View: Get Complete MODN Trend Analysis ➞ | |
 | EYE National Vision Holdings, Inc. |
| Sector: Services & Goods | |
| SubSector: Specialty Retail, Other | |
| MarketCap: 1290.84 Millions | |
| Recent Price: 17.88 Smart Investing & Trading Score: 27 | |
| Day Percent Change: 0.06% Day Change: 0.01 | |
| Week Change: -4.89% Year-to-date Change: -14.6% | |
| EYE Links: Profile News Message Board | |
| Charts:- Daily , Weekly | |
| Add EYE to Watchlist: View: Get Complete EYE Trend Analysis ➞ | |
 | FCBC First Community Bankshares, Inc. |
| Sector: Financials | |
| SubSector: Regional - Mid-Atlantic Banks | |
| MarketCap: 393.459 Millions | |
| Recent Price: 33.51 Smart Investing & Trading Score: 42 | |
| Day Percent Change: 0.06% Day Change: 0.02 | |
| Week Change: 1.24% Year-to-date Change: -9.7% | |
| FCBC Links: Profile News Message Board | |
| Charts:- Daily , Weekly | |
| Add FCBC to Watchlist: View: Get Complete FCBC Trend Analysis ➞ | |
 | HIBB Hibbett Sports, Inc. |
| Sector: Services & Goods | |
| SubSector: Sporting Goods Stores | |
| MarketCap: 183 Millions | |
| Recent Price: 86.15 Smart Investing & Trading Score: 93 | |
| Day Percent Change: 0.06% Day Change: 0.05 | |
| Week Change: 21.1% Year-to-date Change: 19.6% | |
| HIBB Links: Profile News Message Board | |
| Charts:- Daily , Weekly | |
| Add HIBB to Watchlist: View: Get Complete HIBB Trend Analysis ➞ | |
 | BMRC Bank of Marin Bancorp |
| Sector: Financials | |
| SubSector: Regional - Pacific Banks | |
| MarketCap: 367.929 Millions | |
| Recent Price: 15.44 Smart Investing & Trading Score: 67 | |
| Day Percent Change: 0.06% Day Change: 0.01 | |
| Week Change: -0.52% Year-to-date Change: -29.9% | |
| BMRC Links: Profile News Message Board | |
| Charts:- Daily , Weekly | |
| Add BMRC to Watchlist: View: Get Complete BMRC Trend Analysis ➞ | |
 | FOR Forestar Group Inc. |
| Sector: Financials | |
| SubSector: Real Estate Development | |
| MarketCap: 661.019 Millions | |
| Recent Price: 31.33 Smart Investing & Trading Score: 30 | |
| Day Percent Change: 0.06% Day Change: 0.02 | |
| Week Change: -0.89% Year-to-date Change: -5.3% | |
| FOR Links: Profile News Message Board | |
| Charts:- Daily , Weekly | |
| Add FOR to Watchlist: View: Get Complete FOR Trend Analysis ➞ | |
 | ETNB 89bio, Inc. |
| Sector: Health Care | |
| SubSector: Biotechnology | |
| MarketCap: 517.485 Millions | |
| Recent Price: 8.26 Smart Investing & Trading Score: 17 | |
| Day Percent Change: 0.06% Day Change: 0.00 | |
| Week Change: -9.03% Year-to-date Change: -26.1% | |
| ETNB Links: Profile News Message Board | |
| Charts:- Daily , Weekly | |
| Add ETNB to Watchlist: View: Get Complete ETNB Trend Analysis ➞ | |
 | CDRE Cadre Holdings, Inc. |
| Sector: Industrials | |
| SubSector: Aerospace & Defense | |
| MarketCap: 817 Millions | |
| Recent Price: 33.12 Smart Investing & Trading Score: 32 | |
| Day Percent Change: 0.06% Day Change: 0.02 | |
| Week Change: 0.79% Year-to-date Change: 0.5% | |
| CDRE Links: Profile News Message Board | |
| Charts:- Daily , Weekly | |
| Add CDRE to Watchlist: View: Get Complete CDRE Trend Analysis ➞ | |
 | SPTN SpartanNash Company |
| Sector: Consumer Staples | |
| SubSector: Food Wholesale | |
| MarketCap: 671.229 Millions | |
| Recent Price: 19.31 Smart Investing & Trading Score: 47 | |
| Day Percent Change: 0.05% Day Change: 0.01 | |
| Week Change: -1.83% Year-to-date Change: -15.9% | |
| SPTN Links: Profile News Message Board | |
| Charts:- Daily , Weekly | |
| Add SPTN to Watchlist: View: Get Complete SPTN Trend Analysis ➞ | |
 | MYE Myers Industries, Inc. |
| Sector: Consumer Staples | |
| SubSector: Rubber & Plastics | |
| MarketCap: 347.57 Millions | |
| Recent Price: 22.04 Smart Investing & Trading Score: 75 | |
| Day Percent Change: 0.05% Day Change: 0.01 | |
| Week Change: 2.18% Year-to-date Change: 12.7% | |
| MYE Links: Profile News Message Board | |
| Charts:- Daily , Weekly | |
| Add MYE to Watchlist: View: Get Complete MYE Trend Analysis ➞ | |
| Too many stocks? View smallcap stocks filtered by marketcap & sector |
| Marketcap: All SmallCap Stocks (default-no microcap), Large, Mid-Range, Small & MicroCap |
| Sector: Tech, Finance, Energy, Staples, Retail, Industrial, Materials, Utilities & Medical |
|
Best Stocks Today 12Stocks.com |
© 2024 12Stocks.com Terms & Conditions Privacy Contact Us
All Information Provided Only For Education And Not To Be Used For Investing or Trading. See Terms & Conditions


One More Thing ... Get Best Stocks Delivered Daily!
Never Ever Miss A Move With Our Top Ten Stocks Lists
Find Best Stocks In Any Market - Bull or Bear Market
Take A Peek At Our Top Ten Stocks Lists: Daily, Weekly, Year-to-Date & Top Trends
Find Best Stocks In Any Market - Bull or Bear Market
Take A Peek At Our Top Ten Stocks Lists: Daily, Weekly, Year-to-Date & Top Trends
Smallcap Stocks With Best Up Trends [0-bearish to 100-bullish]: Cullinan Oncology[100], NextNav [100], MBIA [100], Reservoir Media[100], B. Riley[100], Braemar Hotels[100], Wolverine World[100], Haemonetics [100], Pactiv Evergreen[100], Benchmark Electronics[100], Uniti Group[100]
Best Smallcap Stocks Year-to-Date:
CareMax [543.3%], Janux [341.65%], Viking [299.3%], Alpine Immune[239.08%], Longboard [222.75%], Super Micro[201.64%], Avidity Biosciences[169.47%], Arcutis Bio[162.23%], Vera [156.27%], Cullinan Oncology[148.16%], Hippo [139.52%] Best Smallcap Stocks This Week:
Matterport [170.98%], B. Riley[84.19%], Cullinan Oncology[61.56%], Seres [47.35%], Universal Logistics[36.84%], Tutor Perini[33.89%], Zura Bio[33.23%], Riot Blockchain[30.67%], IGM Biosciences[30.56%], Impinj [29.74%], Sonic Automotive[28.14%] Best Smallcap Stocks Daily:
Universal Logistics[39.37%], Cullinan Oncology[31.43%], Tutor Perini[28.01%], Zura Bio[26.72%], IGM Biosciences[23.36%], U.S. Silica[21.67%], Maxeon Solar[20.46%], Exponent [19.49%], TPI Composites[16.32%], OptimizeRx [15.07%], NextNav [13.97%]