
 Login Sign Up


| |||||
 |  | ||||

| 12Stocks.com Market Intelligence |
Best SmallCap Stocks
|
| In a hurry? Small Cap Stock Lists: Performance Trends Table, Stock Charts
Sort Small Cap stocks: Daily, Weekly, Year-to-Date, Market Cap & Trends. Filter Small Cap stocks list by sector: Show all, Tech, Finance, Energy, Staples, Retail, Industrial, Materials, Utilities and HealthCare Filter Small Cap stocks list by size: All Large Medium Small and MicroCap |
| 12Stocks.com Small Cap Stocks Performances & Trends Daily | |||||||||
|
|  The overall Smart Investing & Trading Score is 88 (0-bearish to 100-bullish) which puts Small Cap index in short term bullish trend. The Smart Investing & Trading Score from previous trading session is 56 and hence an improvement of trend.
| ||||||||
Here are the Smart Investing & Trading Scores of the most requested small cap stocks at 12Stocks.com (click stock name for detailed review):
|


| 12Stocks.com: Investing in Smallcap Index with Stocks | |
|
The following table helps investors and traders sort through current performance and trends (as measured by Smart Investing & Trading Score) of various
stocks in the Smallcap Index. Quick View: Move mouse or cursor over stock symbol (ticker) to view short-term technical chart and over stock name to view long term chart. Click on  to add stock symbol to your watchlist and to add stock symbol to your watchlist and  to view watchlist. Click on any ticker or stock name for detailed market intelligence report for that stock. to view watchlist. Click on any ticker or stock name for detailed market intelligence report for that stock. |
12Stocks.com Performance of Stocks in Smallcap Index
| Ticker | Stock Name | Watchlist | Category | Recent Price | Smart Investing & Trading Score | Change % | Weekly Change% |
| TMHC | Taylor Morrison |   | Industrials | 57.70 | 80 | 0.24% | 0.24% |
| ONTO | Onto Innovation | | Technology | 190.22 | 95 | 0.24% | 0.24% |
| RYI | Ryerson Holding | | Industrials | 30.73 | 20 | 0.23% | 0.23% |
| RYI | Ryerson Holding | | Industrials | 9.45 | 20 | 0.64% | 0.23% |
| IDCC | InterDigital | | Technology | 100.94 | 59 | 0.23% | 0.23% |
| CCBG | Capital City | | Financials | 27.08 | 55 | 0.22% | 0.22% |
| ITI | Iteris | | Technology | 4.49 | 25 | 0.22% | 0.22% |
| PUMP | ProPetro Holding | | Energy | 9.00 | 100 | 0.22% | 0.22% |
| NNOX | Nano X | | Health Care | 8.98 | 53 | 0.22% | 0.22% |
| HRT | HireRight | | Industrials | 14.32 | 75 | 0.21% | 0.21% |
| ANIP | ANI | | Health Care | 65.50 | 51 | 0.21% | 0.21% |
| PECO | Phillips Edison | | Financials | 32.68 | 35 | 0.21% | 0.21% |
| LGIH | LGI Homes | | Financials | 96.04 | 42 | 0.20% | 0.20% |
| TARO | Taro Pharmaceutical | | Health Care | 42.48 | 57 | 0.19% | 0.19% |
| MPB | Mid Penn | | Financials | 20.90 | 69 | 0.19% | 0.19% |
| ALEC | Alector | | Health Care | 5.26 | 49 | 0.19% | 0.19% |
| PLYM | Plymouth Industrial | | Financials | 20.80 | 35 | 0.19% | 0.19% |
| REFI | Chicago Atlantic | | Financials | 15.68 | 49 | 0.19% | 0.19% |
| ENR | Energizer | | Consumer Staples | 28.56 | 47 | 0.18% | 0.18% |
| BRKL | Brookline Bancorp | | Financials | 8.35 | 7 | 0.18% | 0.18% |
| AGX | Argan | | Industrials | 62.09 | 85 | 0.18% | 0.18% |
| ANGO | AngioDynamics | | Health Care | 5.82 | 48 | 0.17% | 0.17% |
| PBF | PBF Energy | | Energy | 57.88 | 75 | 0.17% | 0.17% |
| KFRC | Kforce | | Services & Goods | 64.23 | 49 | 0.16% | 0.16% |
| GEF | Greif | | Consumer Staples | 62.02 | 32 | 0.16% | 0.16% |


| Too many stocks? View smallcap stocks filtered by marketcap & sector |
| Marketcap: All SmallCap Stocks (default-no microcap), Large, Mid-Range, Small |
| Smallcap Sector: Tech, Finance, Energy, Staples, Retail, Industrial, Materials, & Medical |
|
Get the most comprehensive stock market coverage daily at 12Stocks.com ➞ Best Stocks Today ➞ Best Stocks Weekly ➞ Best Stocks Year-to-Date ➞ Best Stocks Trends ➞  Best Stocks Today 12Stocks.com Best Nasdaq Stocks ➞ Best S&P 500 Stocks ➞ Best Tech Stocks ➞ Best Biotech Stocks ➞ |
| Detailed Overview of SmallCap Stocks |
| SmallCap Technical Overview, Leaders & Laggards, Top SmallCap ETF Funds & Detailed SmallCap Stocks List, Charts, Trends & More |
| Smallcap: Technical Analysis, Trends & YTD Performance | |
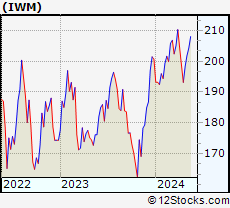
| SmallCap segment as represented by
IWM, an exchange-traded fund [ETF], holds basket of thousands of smallcap stocks from across all major sectors of the US stock market. The smallcap index (contains stocks like Riverbed & Sotheby's) is down by -0.37% and is currently underperforming the overall market by -6.93% year-to-date. Below is a quick view of technical charts and trends: | |
 IWM Weekly Chart |
|
| Long Term Trend: Very Good | |
| Medium Term Trend: Good | |
 IWM Daily Chart |
|
| Short Term Trend: Very Good | |
| Overall Trend Score: 88 | |
| YTD Performance: -0.37% | |
| **Trend Scores & Views Are Only For Educational Purposes And Not For Investing | |
| 12Stocks.com: Top Performing Small Cap Index Stocks | ||||||||||||||||||||||||||||||||||||||||||||||||
 The top performing Small Cap Index stocks year to date are
Now, more recently, over last week, the top performing Small Cap Index stocks on the move are


|
||||||||||||||||||||||||||||||||||||||||||||||||
| 12Stocks.com: Investing in Smallcap Index using Exchange Traded Funds | |
|
The following table shows list of key exchange traded funds (ETF) that
help investors track Smallcap index. The following list also includes leveraged ETF funds that track twice or thrice the daily returns of Smallcap indices. Short or inverse ETF funds move in the opposite direction to the index they track and are useful during market pullbacks or during bear markets. Quick View: Move mouse or cursor over ETF symbol (ticker) to view short-term technical chart and over ETF name to view long term chart. Click on ticker or stock name for detailed view. Click on to add stock symbol to your watchlist and to view watchlist. |
12Stocks.com List of ETFs that track Smallcap Index
| Ticker | ETF Name | Watchlist | Recent Price | Smart Investing & Trading Score | Change % | Week % | Year-to-date % |
| IWM | iShares Russell 2000 | | 199.96 | 88 | 0.79 | 0.79 | -0.37% |
| IJR | iShares Core S&P Small-Cap | | 106.41 | 93 | 0.72 | 0.72 | -1.7% |
| VTWO | Vanguard Russell 2000 ETF | | 80.78 | 88 | 0.70 | 0.7 | -0.39% |
| IWN | iShares Russell 2000 Value | | 152.05 | 93 | 0.60 | 0.6 | -2.11% |
| IWO | iShares Russell 2000 Growth | | 255.74 | 78 | 1.05 | 1.05 | 1.4% |
| IJS | iShares S&P Small-Cap 600 Value | | 97.95 | 70 | 0.78 | 0.78 | -4.97% |
| IJT | iShares S&P Small-Cap 600 Growth | | 126.96 | 88 | 0.69 | 0.69 | 1.45% |
| XSLV | PowerShares S&P SmallCap Low Volatil ETF | | 42.87 | 80 | 0.35 | 0.35 | -2.9% |
| SMLV | SPDR SSGA US Small Cap Low Volatil ETF | | 107.77 | 68 | 0.23 | 0.23 | -4.22% |
| SAA | ProShares Ultra SmallCap600 | | 23.27 | 88 | 1.00 | 1 | -6.73% |
| SBB | ProShares Short SmallCap600 | | 16.28 | 8 | -0.64 | -0.64 | 2.2% |
| SDD | ProShares UltraShort SmallCap600 | | 19.09 | 15 | -1.34 | -1.34 | 3.6% |
| 12Stocks.com: Charts, Trends, Fundamental Data and Performances of SmallCap Stocks | |
|
We now take in-depth look at all SmallCap stocks including charts, multi-period performances and overall trends (as measured by Smart Investing & Trading Score). One can sort SmallCap stocks (click link to choose) by Daily, Weekly and by Year-to-Date performances. Also, one can sort by size of the company or by market capitalization. |
| Select Your Default Chart Type: | |||||
| |||||
| Click on stock symbol or name for detailed view. Click on to add stock symbol to your watchlist and to view watchlist. Quick View: Move mouse or cursor over "Daily" to quickly view daily technical stock chart and over "Weekly" to view weekly technical stock chart. | |||||

 | TMHC Taylor Morrison Home Corporation |
| Sector: Industrials | |
| SubSector: Residential Construction | |
| MarketCap: 1336.76 Millions | |
| Recent Price: 57.70 Smart Investing & Trading Score: 80 | |
| Day Percent Change: 0.24% Day Change: 0.14 | |
| Week Change: 0.24% Year-to-date Change: 8.2% | |
| TMHC Links: Profile News Message Board | |
| Charts:- Daily , Weekly | |
| Add TMHC to Watchlist: View: Get Complete TMHC Trend Analysis ➞ | |
 | ONTO Onto Innovation Inc. |
| Sector: Technology | |
| SubSector: Semiconductor Equipment & Materials | |
| MarketCap: 1187.18 Millions | |
| Recent Price: 190.22 Smart Investing & Trading Score: 95 | |
| Day Percent Change: 0.24% Day Change: 0.45 | |
| Week Change: 0.24% Year-to-date Change: 24.4% | |
| ONTO Links: Profile News Message Board | |
| Charts:- Daily , Weekly | |
| Add ONTO to Watchlist: View: Get Complete ONTO Trend Analysis ➞ | |
 | RYI Ryerson Holding Corporation |
| Sector: Industrials | |
| SubSector: Metal Fabrication | |
| MarketCap: 202.55 Millions | |
| Recent Price: 30.73 Smart Investing & Trading Score: 20 | |
| Day Percent Change: 0.23% Day Change: 0.07 | |
| Week Change: 0.23% Year-to-date Change: -11.4% | |
| RYI Links: Profile News Message Board | |
| Charts:- Daily , Weekly | |
| Add RYI to Watchlist: View: Get Complete RYI Trend Analysis ➞ | |
| RYI Ryerson Holding Corporation |
| Sector: Industrials | |
| SubSector: Metal Fabrication | |
| MarketCap: 202.55 Millions | |
| Recent Price: 9.45 Smart Investing & Trading Score: 20 | |
| Day Percent Change: 0.64% Day Change: 0.06 | |
| Week Change: 0.23% Year-to-date Change: -11.4% | |
| RYI Links: Profile News Message Board | |
| Charts:- Daily , Weekly | |
| Add RYI to Watchlist: View: Get Complete RYI Trend Analysis ➞ | |
 | IDCC InterDigital, Inc. |
| Sector: Technology | |
| SubSector: Wireless Communications | |
| MarketCap: 1225.27 Millions | |
| Recent Price: 100.94 Smart Investing & Trading Score: 59 | |
| Day Percent Change: 0.23% Day Change: 0.23 | |
| Week Change: 0.23% Year-to-date Change: -7.0% | |
| IDCC Links: Profile News Message Board | |
| Charts:- Daily , Weekly | |
| Add IDCC to Watchlist: View: Get Complete IDCC Trend Analysis ➞ | |
 | CCBG Capital City Bank Group, Inc. |
| Sector: Financials | |
| SubSector: Regional - Mid-Atlantic Banks | |
| MarketCap: 314.459 Millions | |
| Recent Price: 27.08 Smart Investing & Trading Score: 55 | |
| Day Percent Change: 0.22% Day Change: 0.06 | |
| Week Change: 0.22% Year-to-date Change: -8.0% | |
| CCBG Links: Profile News Message Board | |
| Charts:- Daily , Weekly | |
| Add CCBG to Watchlist: View: Get Complete CCBG Trend Analysis ➞ | |
 | ITI Iteris, Inc. |
| Sector: Technology | |
| SubSector: Communication Equipment | |
| MarketCap: 129.939 Millions | |
| Recent Price: 4.49 Smart Investing & Trading Score: 25 | |
| Day Percent Change: 0.22% Day Change: 0.01 | |
| Week Change: 0.22% Year-to-date Change: -13.7% | |
| ITI Links: Profile News Message Board | |
| Charts:- Daily , Weekly | |
| Add ITI to Watchlist: View: Get Complete ITI Trend Analysis ➞ | |
 | PUMP ProPetro Holding Corp. |
| Sector: Energy | |
| SubSector: Oil & Gas Equipment & Services | |
| MarketCap: 181.261 Millions | |
| Recent Price: 9.00 Smart Investing & Trading Score: 100 | |
| Day Percent Change: 0.22% Day Change: 0.02 | |
| Week Change: 0.22% Year-to-date Change: 7.4% | |
| PUMP Links: Profile News Message Board | |
| Charts:- Daily , Weekly | |
| Add PUMP to Watchlist: View: Get Complete PUMP Trend Analysis ➞ | |
 | NNOX Nano X Imaging Ltd. |
| Sector: Health Care | |
| SubSector: Medical Devices | |
| MarketCap: 22587 Millions | |
| Recent Price: 8.98 Smart Investing & Trading Score: 53 | |
| Day Percent Change: 0.22% Day Change: 0.02 | |
| Week Change: 0.22% Year-to-date Change: 41.0% | |
| NNOX Links: Profile News Message Board | |
| Charts:- Daily , Weekly | |
| Add NNOX to Watchlist: View: Get Complete NNOX Trend Analysis ➞ | |
 | HRT HireRight Holdings Corporation |
| Sector: Industrials | |
| SubSector: Staffing & Employment Services | |
| MarketCap: 823 Millions | |
| Recent Price: 14.32 Smart Investing & Trading Score: 75 | |
| Day Percent Change: 0.21% Day Change: 0.03 | |
| Week Change: 0.21% Year-to-date Change: 6.5% | |
| HRT Links: Profile News Message Board | |
| Charts:- Daily , Weekly | |
| Add HRT to Watchlist: View: Get Complete HRT Trend Analysis ➞ | |
 | ANIP ANI Pharmaceuticals, Inc. |
| Sector: Health Care | |
| SubSector: Biotechnology | |
| MarketCap: 489.285 Millions | |
| Recent Price: 65.50 Smart Investing & Trading Score: 51 | |
| Day Percent Change: 0.21% Day Change: 0.14 | |
| Week Change: 0.21% Year-to-date Change: 18.8% | |
| ANIP Links: Profile News Message Board | |
| Charts:- Daily , Weekly | |
| Add ANIP to Watchlist: View: Get Complete ANIP Trend Analysis ➞ | |
 | PECO Phillips Edison & Company, Inc. |
| Sector: Financials | |
| SubSector: REIT - Retail | |
| MarketCap: 3920 Millions | |
| Recent Price: 32.68 Smart Investing & Trading Score: 35 | |
| Day Percent Change: 0.21% Day Change: 0.07 | |
| Week Change: 0.21% Year-to-date Change: -11.3% | |
| PECO Links: Profile News Message Board | |
| Charts:- Daily , Weekly | |
| Add PECO to Watchlist: View: Get Complete PECO Trend Analysis ➞ | |
 | LGIH LGI Homes, Inc. |
| Sector: Financials | |
| SubSector: Real Estate Development | |
| MarketCap: 1316.49 Millions | |
| Recent Price: 96.04 Smart Investing & Trading Score: 42 | |
| Day Percent Change: 0.20% Day Change: 0.19 | |
| Week Change: 0.2% Year-to-date Change: -27.9% | |
| LGIH Links: Profile News Message Board | |
| Charts:- Daily , Weekly | |
| Add LGIH to Watchlist: View: Get Complete LGIH Trend Analysis ➞ | |
 | TARO Taro Pharmaceutical Industries Ltd. |
| Sector: Health Care | |
| SubSector: Drug Manufacturers - Other | |
| MarketCap: 2379.33 Millions | |
| Recent Price: 42.48 Smart Investing & Trading Score: 57 | |
| Day Percent Change: 0.19% Day Change: 0.08 | |
| Week Change: 0.19% Year-to-date Change: 1.7% | |
| TARO Links: Profile News Message Board | |
| Charts:- Daily , Weekly | |
| Add TARO to Watchlist: View: Get Complete TARO Trend Analysis ➞ | |
 | MPB Mid Penn Bancorp, Inc. |
| Sector: Financials | |
| SubSector: Regional - Northeast Banks | |
| MarketCap: 187.699 Millions | |
| Recent Price: 20.90 Smart Investing & Trading Score: 69 | |
| Day Percent Change: 0.19% Day Change: 0.04 | |
| Week Change: 0.19% Year-to-date Change: -13.9% | |
| MPB Links: Profile News Message Board | |
| Charts:- Daily , Weekly | |
| Add MPB to Watchlist: View: Get Complete MPB Trend Analysis ➞ | |
 | ALEC Alector, Inc. |
| Sector: Health Care | |
| SubSector: Biotechnology | |
| MarketCap: 2719.35 Millions | |
| Recent Price: 5.26 Smart Investing & Trading Score: 49 | |
| Day Percent Change: 0.19% Day Change: 0.01 | |
| Week Change: 0.19% Year-to-date Change: -34.1% | |
| ALEC Links: Profile News Message Board | |
| Charts:- Daily , Weekly | |
| Add ALEC to Watchlist: View: Get Complete ALEC Trend Analysis ➞ | |
 | PLYM Plymouth Industrial REIT, Inc. |
| Sector: Financials | |
| SubSector: REIT - Industrial | |
| MarketCap: 153.449 Millions | |
| Recent Price: 20.80 Smart Investing & Trading Score: 35 | |
| Day Percent Change: 0.19% Day Change: 0.04 | |
| Week Change: 0.19% Year-to-date Change: -13.6% | |
| PLYM Links: Profile News Message Board | |
| Charts:- Daily , Weekly | |
| Add PLYM to Watchlist: View: Get Complete PLYM Trend Analysis ➞ | |
 | REFI Chicago Atlantic Financials Finance, Inc. |
| Sector: Financials | |
| SubSector: REIT - Mortgage | |
| MarketCap: 285 Millions | |
| Recent Price: 15.68 Smart Investing & Trading Score: 49 | |
| Day Percent Change: 0.19% Day Change: 0.03 | |
| Week Change: 0.19% Year-to-date Change: -3.2% | |
| REFI Links: Profile News Message Board | |
| Charts:- Daily , Weekly | |
| Add REFI to Watchlist: View: Get Complete REFI Trend Analysis ➞ | |
 | ENR Energizer Holdings, Inc. |
| Sector: Consumer Staples | |
| SubSector: Personal Products | |
| MarketCap: 2469.55 Millions | |
| Recent Price: 28.56 Smart Investing & Trading Score: 47 | |
| Day Percent Change: 0.18% Day Change: 0.05 | |
| Week Change: 0.18% Year-to-date Change: -9.9% | |
| ENR Links: Profile News Message Board | |
| Charts:- Daily , Weekly | |
| Add ENR to Watchlist: View: Get Complete ENR Trend Analysis ➞ | |
 | BRKL Brookline Bancorp, Inc. |
| Sector: Financials | |
| SubSector: Savings & Loans | |
| MarketCap: 894.43 Millions | |
| Recent Price: 8.35 Smart Investing & Trading Score: 7 | |
| Day Percent Change: 0.18% Day Change: 0.01 | |
| Week Change: 0.18% Year-to-date Change: -23.5% | |
| BRKL Links: Profile News Message Board | |
| Charts:- Daily , Weekly | |
| Add BRKL to Watchlist: View: Get Complete BRKL Trend Analysis ➞ | |
 | AGX Argan, Inc. |
| Sector: Industrials | |
| SubSector: Heavy Construction | |
| MarketCap: 664.095 Millions | |
| Recent Price: 62.09 Smart Investing & Trading Score: 85 | |
| Day Percent Change: 0.18% Day Change: 0.11 | |
| Week Change: 0.18% Year-to-date Change: 32.7% | |
| AGX Links: Profile News Message Board | |
| Charts:- Daily , Weekly | |
| Add AGX to Watchlist: View: Get Complete AGX Trend Analysis ➞ | |
 | ANGO AngioDynamics, Inc. |
| Sector: Health Care | |
| SubSector: Medical Instruments & Supplies | |
| MarketCap: 370.86 Millions | |
| Recent Price: 5.82 Smart Investing & Trading Score: 48 | |
| Day Percent Change: 0.17% Day Change: 0.01 | |
| Week Change: 0.17% Year-to-date Change: -25.8% | |
| ANGO Links: Profile News Message Board | |
| Charts:- Daily , Weekly | |
| Add ANGO to Watchlist: View: Get Complete ANGO Trend Analysis ➞ | |
 | PBF PBF Energy Inc |
| Sector: Energy | |
| SubSector: Oil & Gas Refining & Marketing | |
| MarketCap: 1118.54 Millions | |
| Recent Price: 57.88 Smart Investing & Trading Score: 75 | |
| Day Percent Change: 0.17% Day Change: 0.10 | |
| Week Change: 0.17% Year-to-date Change: 31.7% | |
| PBF Links: Profile News Message Board | |
| Charts:- Daily , Weekly | |
| Add PBF to Watchlist: View: Get Complete PBF Trend Analysis ➞ | |
 | KFRC Kforce Inc. |
| Sector: Services & Goods | |
| SubSector: Staffing & Outsourcing Services | |
| MarketCap: 622.828 Millions | |
| Recent Price: 64.23 Smart Investing & Trading Score: 49 | |
| Day Percent Change: 0.16% Day Change: 0.10 | |
| Week Change: 0.16% Year-to-date Change: -4.9% | |
| KFRC Links: Profile News Message Board | |
| Charts:- Daily , Weekly | |
| Add KFRC to Watchlist: View: Get Complete KFRC Trend Analysis ➞ | |
 | GEF Greif, Inc. |
| Sector: Consumer Staples | |
| SubSector: Packaging & Containers | |
| MarketCap: 1563.03 Millions | |
| Recent Price: 62.02 Smart Investing & Trading Score: 32 | |
| Day Percent Change: 0.16% Day Change: 0.10 | |
| Week Change: 0.16% Year-to-date Change: -5.4% | |
| GEF Links: Profile News Message Board | |
| Charts:- Daily , Weekly | |
| Add GEF to Watchlist: View: Get Complete GEF Trend Analysis ➞ | |
| Too many stocks? View smallcap stocks filtered by marketcap & sector |
| Marketcap: All SmallCap Stocks (default-no microcap), Large, Mid-Range, Small & MicroCap |
| Sector: Tech, Finance, Energy, Staples, Retail, Industrial, Materials, Utilities & Medical |
|
Best Stocks Today 12Stocks.com |
© 2024 12Stocks.com Terms & Conditions Privacy Contact Us
All Information Provided Only For Education And Not To Be Used For Investing or Trading. See Terms & Conditions


One More Thing ... Get Best Stocks Delivered Daily!
Never Ever Miss A Move With Our Top Ten Stocks Lists
Find Best Stocks In Any Market - Bull or Bear Market
Take A Peek At Our Top Ten Stocks Lists: Daily, Weekly, Year-to-Date & Top Trends
Find Best Stocks In Any Market - Bull or Bear Market
Take A Peek At Our Top Ten Stocks Lists: Daily, Weekly, Year-to-Date & Top Trends
Smallcap Stocks With Best Up Trends [0-bearish to 100-bullish]: Bakkt [100], Deciphera [100], Phibro Animal[100], Heartland Financial[100], PTC [100], Sight Sciences[100], Richardson Electronics[100], Fulton Financial[100], TPI Composites[100], Cullinan Oncology[100], Lands [100]
Best Smallcap Stocks Year-to-Date:
CareMax [580.41%], Janux [421.92%], Bakkt [346.64%], Viking [305.75%], Longboard [247.46%], Alpine Immune[239.81%], Super Micro[213.22%], Avidity Biosciences[173.23%], Arcutis Bio[171.83%], Vera [167.31%], Cullinan Oncology[166.01%] Best Smallcap Stocks This Week:
Deciphera [72.56%], Phibro Animal[31.81%], Vaxxinity [31.65%], Zevia PBC[20.94%], Velo3D [19.97%], Acrivon [18.2%], Janux [18.18%], MultiPlan [15.53%], Heartland Financial[15.15%], Codexis [14.66%], Eyenovia [13.37%] Best Smallcap Stocks Daily:
Bakkt [2391.87%], Deciphera [72.56%], Phibro Animal[31.81%], Vaxxinity [31.65%], Zevia PBC[20.94%], Velo3D [19.97%], Acrivon [18.20%], Janux [18.18%], MultiPlan [15.53%], Heartland Financial[15.15%], Codexis [14.66%]