
 Login Sign Up


| |||||
 |  | ||||

| 12Stocks.com Market Intelligence |
Best SmallCap Stocks
|
| In a hurry? Small Cap Stock Lists: Performance Trends Table, Stock Charts
Sort Small Cap stocks: Daily, Weekly, Year-to-Date, Market Cap & Trends. Filter Small Cap stocks list by sector: Show all, Tech, Finance, Energy, Staples, Retail, Industrial, Materials, Utilities and HealthCare Filter Small Cap stocks list by size: All Large Medium Small and MicroCap |
| 12Stocks.com Small Cap Stocks Performances & Trends Daily | |||||||||
|
|  The overall Smart Investing & Trading Score is 23 (0-bearish to 100-bullish) which puts Small Cap index in short term bearish to neutral trend. The Smart Investing & Trading Score from previous trading session is 13 and hence an improvement of trend.
| ||||||||
Here are the Smart Investing & Trading Scores of the most requested small cap stocks at 12Stocks.com (click stock name for detailed review):
|


| 12Stocks.com: Investing in Smallcap Index with Stocks | |
|
The following table helps investors and traders sort through current performance and trends (as measured by Smart Investing & Trading Score) of various
stocks in the Smallcap Index. Quick View: Move mouse or cursor over stock symbol (ticker) to view short-term technical chart and over stock name to view long term chart. Click on  to add stock symbol to your watchlist and to add stock symbol to your watchlist and  to view watchlist. Click on any ticker or stock name for detailed market intelligence report for that stock. to view watchlist. Click on any ticker or stock name for detailed market intelligence report for that stock. |
12Stocks.com Performance of Stocks in Smallcap Index
| Ticker | Stock Name | Watchlist | Category | Recent Price | Smart Investing & Trading Score | Change % | Weekly Change% |
| SPTN | SpartanNash |   | Consumer Staples | 19.22 | 59 | 0.89% | 2.62% |
| KMT | Kennametal | | Industrials | 24.10 | 42 | 1.13% | 2.55% |
| JAMF | Jamf Holding | | Technology | 18.52 | 80 | 0.11% | 2.55% |
| SATS | EchoStar | | Technology | 14.56 | 100 | 3.93% | 2.54% |
| LNTH | Lantheus | | Health Care | 62.33 | 93 | 1.38% | 2.53% |
| NSSC | Napco Security | | Services & Goods | 39.73 | 63 | 1.85% | 2.48% |
| SNBR | Sleep Number | | Consumer Staples | 13.28 | 53 | 0.76% | 2.47% |
| BKU | BankUnited | | Financials | 25.87 | 42 | 2.70% | 2.46% |
| CRS | Carpenter | | Industrials | 79.38 | 93 | 2.08% | 2.43% |
| DGICA | Donegal Group | | Financials | 13.64 | 42 | 1.94% | 2.40% |
| OSBC | Old Second | | Financials | 13.74 | 65 | 2.23% | 2.38% |
| MGPI | MGP Ingredients | | Consumer Staples | 79.45 | 45 | 2.15% | 2.38% |
| JXN | Jackson Financial | | Financials | 64.89 | 68 | 2.08% | 2.37% |
| IAUX | i-80 Gold | | Materials | 1.22 | 35 | 0.66% | 2.35% |
| ABR | Arbor Realty | | Financials | 12.48 | 42 | 2.72% | 2.30% |
| ACEL | Accel Entertainment | | Services & Goods | 11.26 | 56 | -0.18% | 2.27% |
| SIBN | SI-BONE | | Health Care | 15.31 | 23 | 0.53% | 2.27% |
| RVLV | Revolve Group | | Services & Goods | 19.12 | 68 | 0.31% | 2.19% |
| TNGX | Tango | | Health Care | 7.52 | 42 | 0.80% | 2.17% |
| MLNK | MeridianLink | | Technology | 17.50 | 17 | 2.04% | 2.16% |
| APPS | Digital Turbine | | Technology | 1.91 | 52 | 2.69% | 2.14% |
| AAN | Aaron s | | Transports | 7.31 | 42 | 3.10% | 2.09% |
| SENEA | Seneca Foods | | Consumer Staples | 56.78 | 93 | 1.07% | 2.05% |
| AGX | Argan | | Industrials | 60.99 | 95 | 1.57% | 2.04% |
| PRMW | Primo Water | | Consumer Staples | 18.12 | 88 | 1.74% | 2.03% |


| Too many stocks? View smallcap stocks filtered by marketcap & sector |
| Marketcap: All SmallCap Stocks (default-no microcap), Large, Mid-Range, Small |
| Smallcap Sector: Tech, Finance, Energy, Staples, Retail, Industrial, Materials, & Medical |
|
Get the most comprehensive stock market coverage daily at 12Stocks.com ➞ Best Stocks Today ➞ Best Stocks Weekly ➞ Best Stocks Year-to-Date ➞ Best Stocks Trends ➞  Best Stocks Today 12Stocks.com Best Nasdaq Stocks ➞ Best S&P 500 Stocks ➞ Best Tech Stocks ➞ Best Biotech Stocks ➞ |
| Detailed Overview of SmallCap Stocks |
| SmallCap Technical Overview, Leaders & Laggards, Top SmallCap ETF Funds & Detailed SmallCap Stocks List, Charts, Trends & More |
| Smallcap: Technical Analysis, Trends & YTD Performance | |
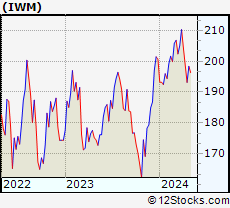
| SmallCap segment as represented by
IWM, an exchange-traded fund [ETF], holds basket of thousands of smallcap stocks from across all major sectors of the US stock market. The smallcap index (contains stocks like Riverbed & Sotheby's) is down by -3.92% and is currently underperforming the overall market by -8.11% year-to-date. Below is a quick view of technical charts and trends: | |
 IWM Weekly Chart |
|
| Long Term Trend: Not Good | |
| Medium Term Trend: Not Good | |
 IWM Daily Chart |
|
| Short Term Trend: Not Good | |
| Overall Trend Score: 23 | |
| YTD Performance: -3.92% | |
| **Trend Scores & Views Are Only For Educational Purposes And Not For Investing | |
| 12Stocks.com: Top Performing Small Cap Index Stocks | ||||||||||||||||||||||||||||||||||||||||||||||||
 The top performing Small Cap Index stocks year to date are
Now, more recently, over last week, the top performing Small Cap Index stocks on the move are


|
||||||||||||||||||||||||||||||||||||||||||||||||
| 12Stocks.com: Investing in Smallcap Index using Exchange Traded Funds | |
|
The following table shows list of key exchange traded funds (ETF) that
help investors track Smallcap index. The following list also includes leveraged ETF funds that track twice or thrice the daily returns of Smallcap indices. Short or inverse ETF funds move in the opposite direction to the index they track and are useful during market pullbacks or during bear markets. Quick View: Move mouse or cursor over ETF symbol (ticker) to view short-term technical chart and over ETF name to view long term chart. Click on ticker or stock name for detailed view. Click on to add stock symbol to your watchlist and to view watchlist. |
12Stocks.com List of ETFs that track Smallcap Index
| Ticker | ETF Name | Watchlist | Recent Price | Smart Investing & Trading Score | Change % | Week % | Year-to-date % |
| IWM | iShares Russell 2000 | | 192.84 | 23 | -0.08 | -2.94 | -3.92% |
| IJR | iShares Core S&P Small-Cap | | 102.34 | 31 | 0.21 | -2.08 | -5.46% |
| VTWO | Vanguard Russell 2000 ETF | | 77.95 | 23 | -0.13 | -2.95 | -3.88% |
| IWN | iShares Russell 2000 Value | | 146.33 | 10 | 0.21 | -2.69 | -5.79% |
| IJS | iShares S&P Small-Cap 600 Value | | 94.51 | 10 | 0.41 | -1.73 | -8.31% |
| IWO | iShares Russell 2000 Growth | | 246.94 | 36 | -0.44 | -3.3 | -2.09% |
| IJT | iShares S&P Small-Cap 600 Growth | | 121.57 | 23 | -0.22 | -2.57 | -2.85% |
| XSLV | PowerShares S&P SmallCap Low Volatil ETF | | 41.65 | 25 | 0.56 | -1.05 | -5.66% |
| SAA | ProShares Ultra SmallCap600 | | 21.62 | 10 | -0.18 | -4.17 | -13.35% |
| SMLV | SPDR SSGA US Small Cap Low Volatil ETF | | 103.83 | 10 | 0.16 | -1.13 | -7.72% |
| SBB | ProShares Short SmallCap600 | | 16.98 | 95 | 0.77 | 2.62 | 6.59% |
| SDD | ProShares UltraShort SmallCap600 | | 20.69 | 83 | 0.44 | 4.33 | 12.28% |
| 12Stocks.com: Charts, Trends, Fundamental Data and Performances of SmallCap Stocks | |
|
We now take in-depth look at all SmallCap stocks including charts, multi-period performances and overall trends (as measured by Smart Investing & Trading Score). One can sort SmallCap stocks (click link to choose) by Daily, Weekly and by Year-to-Date performances. Also, one can sort by size of the company or by market capitalization. |
| Select Your Default Chart Type: | |||||
| |||||
| Click on stock symbol or name for detailed view. Click on to add stock symbol to your watchlist and to view watchlist. Quick View: Move mouse or cursor over "Daily" to quickly view daily technical stock chart and over "Weekly" to view weekly technical stock chart. | |||||

 | SPTN SpartanNash Company |
| Sector: Consumer Staples | |
| SubSector: Food Wholesale | |
| MarketCap: 671.229 Millions | |
| Recent Price: 19.22 Smart Investing & Trading Score: 59 | |
| Day Percent Change: 0.89% Day Change: 0.17 | |
| Week Change: 2.62% Year-to-date Change: -16.3% | |
| SPTN Links: Profile News Message Board | |
| Charts:- Daily , Weekly | |
| Add SPTN to Watchlist: View: Get Complete SPTN Trend Analysis ➞ | |
 | KMT Kennametal Inc. |
| Sector: Industrials | |
| SubSector: Machine Tools & Accessories | |
| MarketCap: 1486.48 Millions | |
| Recent Price: 24.10 Smart Investing & Trading Score: 42 | |
| Day Percent Change: 1.13% Day Change: 0.27 | |
| Week Change: 2.55% Year-to-date Change: -6.6% | |
| KMT Links: Profile News Message Board | |
| Charts:- Daily , Weekly | |
| Add KMT to Watchlist: View: Get Complete KMT Trend Analysis ➞ | |
 | JAMF Jamf Holding Corp. |
| Sector: Technology | |
| SubSector: Software Application | |
| MarketCap: 36987 Millions | |
| Recent Price: 18.52 Smart Investing & Trading Score: 80 | |
| Day Percent Change: 0.11% Day Change: 0.02 | |
| Week Change: 2.55% Year-to-date Change: 2.5% | |
| JAMF Links: Profile News Message Board | |
| Charts:- Daily , Weekly | |
| Add JAMF to Watchlist: View: Get Complete JAMF Trend Analysis ➞ | |
 | SATS EchoStar Corporation |
| Sector: Technology | |
| SubSector: Communication Equipment | |
| MarketCap: 3175.69 Millions | |
| Recent Price: 14.56 Smart Investing & Trading Score: 100 | |
| Day Percent Change: 3.93% Day Change: 0.55 | |
| Week Change: 2.54% Year-to-date Change: -12.1% | |
| SATS Links: Profile News Message Board | |
| Charts:- Daily , Weekly | |
| Add SATS to Watchlist: View: Get Complete SATS Trend Analysis ➞ | |
 | LNTH Lantheus Holdings, Inc. |
| Sector: Health Care | |
| SubSector: Medical Appliances & Equipment | |
| MarketCap: 467.18 Millions | |
| Recent Price: 62.33 Smart Investing & Trading Score: 93 | |
| Day Percent Change: 1.38% Day Change: 0.85 | |
| Week Change: 2.53% Year-to-date Change: 0.5% | |
| LNTH Links: Profile News Message Board | |
| Charts:- Daily , Weekly | |
| Add LNTH to Watchlist: View: Get Complete LNTH Trend Analysis ➞ | |
 | NSSC Napco Security Technologies, Inc. |
| Sector: Services & Goods | |
| SubSector: Security & Protection Services | |
| MarketCap: 339.103 Millions | |
| Recent Price: 39.73 Smart Investing & Trading Score: 63 | |
| Day Percent Change: 1.85% Day Change: 0.72 | |
| Week Change: 2.48% Year-to-date Change: 16.0% | |
| NSSC Links: Profile News Message Board | |
| Charts:- Daily , Weekly | |
| Add NSSC to Watchlist: View: Get Complete NSSC Trend Analysis ➞ | |
 | SNBR Sleep Number Corporation |
| Sector: Consumer Staples | |
| SubSector: Home Furnishings & Fixtures | |
| MarketCap: 692.735 Millions | |
| Recent Price: 13.28 Smart Investing & Trading Score: 53 | |
| Day Percent Change: 0.76% Day Change: 0.10 | |
| Week Change: 2.47% Year-to-date Change: -10.5% | |
| SNBR Links: Profile News Message Board | |
| Charts:- Daily , Weekly | |
| Add SNBR to Watchlist: View: Get Complete SNBR Trend Analysis ➞ | |
 | BKU BankUnited, Inc. |
| Sector: Financials | |
| SubSector: Regional - Mid-Atlantic Banks | |
| MarketCap: 1905.99 Millions | |
| Recent Price: 25.87 Smart Investing & Trading Score: 42 | |
| Day Percent Change: 2.70% Day Change: 0.68 | |
| Week Change: 2.46% Year-to-date Change: -20.2% | |
| BKU Links: Profile News Message Board | |
| Charts:- Daily , Weekly | |
| Add BKU to Watchlist: View: Get Complete BKU Trend Analysis ➞ | |
 | CRS Carpenter Technology Corporation |
| Sector: Industrials | |
| SubSector: Metal Fabrication | |
| MarketCap: 853.35 Millions | |
| Recent Price: 79.38 Smart Investing & Trading Score: 93 | |
| Day Percent Change: 2.08% Day Change: 1.62 | |
| Week Change: 2.43% Year-to-date Change: 12.1% | |
| CRS Links: Profile News Message Board | |
| Charts:- Daily , Weekly | |
| Add CRS to Watchlist: View: Get Complete CRS Trend Analysis ➞ | |
 | DGICA Donegal Group Inc. |
| Sector: Financials | |
| SubSector: Property & Casualty Insurance | |
| MarketCap: 350.512 Millions | |
| Recent Price: 13.64 Smart Investing & Trading Score: 42 | |
| Day Percent Change: 1.94% Day Change: 0.26 | |
| Week Change: 2.4% Year-to-date Change: -2.5% | |
| DGICA Links: Profile News Message Board | |
| Charts:- Daily , Weekly | |
| Add DGICA to Watchlist: View: Get Complete DGICA Trend Analysis ➞ | |
 | OSBC Old Second Bancorp, Inc. |
| Sector: Financials | |
| SubSector: Regional - Midwest Banks | |
| MarketCap: 237.17 Millions | |
| Recent Price: 13.74 Smart Investing & Trading Score: 65 | |
| Day Percent Change: 2.23% Day Change: 0.30 | |
| Week Change: 2.38% Year-to-date Change: -11.0% | |
| OSBC Links: Profile News Message Board | |
| Charts:- Daily , Weekly | |
| Add OSBC to Watchlist: View: Get Complete OSBC Trend Analysis ➞ | |
 | MGPI MGP Ingredients, Inc. |
| Sector: Consumer Staples | |
| SubSector: Beverages - Wineries & Distillers | |
| MarketCap: 502.635 Millions | |
| Recent Price: 79.45 Smart Investing & Trading Score: 45 | |
| Day Percent Change: 2.15% Day Change: 1.67 | |
| Week Change: 2.38% Year-to-date Change: -19.4% | |
| MGPI Links: Profile News Message Board | |
| Charts:- Daily , Weekly | |
| Add MGPI to Watchlist: View: Get Complete MGPI Trend Analysis ➞ | |
 | JXN Jackson Financial Inc. |
| Sector: Financials | |
| SubSector: Insurance - Life | |
| MarketCap: 2460 Millions | |
| Recent Price: 64.89 Smart Investing & Trading Score: 68 | |
| Day Percent Change: 2.08% Day Change: 1.33 | |
| Week Change: 2.37% Year-to-date Change: 26.2% | |
| JXN Links: Profile News Message Board | |
| Charts:- Daily , Weekly | |
| Add JXN to Watchlist: View: Get Complete JXN Trend Analysis ➞ | |
 | IAUX i-80 Gold Corp. |
| Sector: Materials | |
| SubSector: Gold | |
| MarketCap: 616 Millions | |
| Recent Price: 1.22 Smart Investing & Trading Score: 35 | |
| Day Percent Change: 0.66% Day Change: 0.01 | |
| Week Change: 2.35% Year-to-date Change: -30.4% | |
| IAUX Links: Profile News Message Board | |
| Charts:- Daily , Weekly | |
| Add IAUX to Watchlist: View: Get Complete IAUX Trend Analysis ➞ | |
 | ABR Arbor Realty Trust, Inc. |
| Sector: Financials | |
| SubSector: Mortgage Investment | |
| MarketCap: 648.939 Millions | |
| Recent Price: 12.48 Smart Investing & Trading Score: 42 | |
| Day Percent Change: 2.72% Day Change: 0.33 | |
| Week Change: 2.3% Year-to-date Change: -17.8% | |
| ABR Links: Profile News Message Board | |
| Charts:- Daily , Weekly | |
| Add ABR to Watchlist: View: Get Complete ABR Trend Analysis ➞ | |
 | ACEL Accel Entertainment, Inc. |
| Sector: Services & Goods | |
| SubSector: Gaming Activities | |
| MarketCap: 486.589 Millions | |
| Recent Price: 11.26 Smart Investing & Trading Score: 56 | |
| Day Percent Change: -0.18% Day Change: -0.02 | |
| Week Change: 2.27% Year-to-date Change: 9.6% | |
| ACEL Links: Profile News Message Board | |
| Charts:- Daily , Weekly | |
| Add ACEL to Watchlist: View: Get Complete ACEL Trend Analysis ➞ | |
 | SIBN SI-BONE, Inc. |
| Sector: Health Care | |
| SubSector: Medical Appliances & Equipment | |
| MarketCap: 234.78 Millions | |
| Recent Price: 15.31 Smart Investing & Trading Score: 23 | |
| Day Percent Change: 0.53% Day Change: 0.08 | |
| Week Change: 2.27% Year-to-date Change: -27.1% | |
| SIBN Links: Profile News Message Board | |
| Charts:- Daily , Weekly | |
| Add SIBN to Watchlist: View: Get Complete SIBN Trend Analysis ➞ | |
 | RVLV Revolve Group, Inc. |
| Sector: Services & Goods | |
| SubSector: Specialty Retail, Other | |
| MarketCap: 652.244 Millions | |
| Recent Price: 19.12 Smart Investing & Trading Score: 68 | |
| Day Percent Change: 0.31% Day Change: 0.06 | |
| Week Change: 2.19% Year-to-date Change: 15.3% | |
| RVLV Links: Profile News Message Board | |
| Charts:- Daily , Weekly | |
| Add RVLV to Watchlist: View: Get Complete RVLV Trend Analysis ➞ | |
 | TNGX Tango Therapeutics, Inc. |
| Sector: Health Care | |
| SubSector: Biotechnology | |
| MarketCap: 302 Millions | |
| Recent Price: 7.52 Smart Investing & Trading Score: 42 | |
| Day Percent Change: 0.80% Day Change: 0.06 | |
| Week Change: 2.17% Year-to-date Change: -24.0% | |
| TNGX Links: Profile News Message Board | |
| Charts:- Daily , Weekly | |
| Add TNGX to Watchlist: View: Get Complete TNGX Trend Analysis ➞ | |
 | MLNK MeridianLink, Inc. |
| Sector: Technology | |
| SubSector: Software - Application | |
| MarketCap: 1630 Millions | |
| Recent Price: 17.50 Smart Investing & Trading Score: 17 | |
| Day Percent Change: 2.04% Day Change: 0.35 | |
| Week Change: 2.16% Year-to-date Change: -29.4% | |
| MLNK Links: Profile News Message Board | |
| Charts:- Daily , Weekly | |
| Add MLNK to Watchlist: View: Get Complete MLNK Trend Analysis ➞ | |
 | APPS Digital Turbine, Inc. |
| Sector: Technology | |
| SubSector: Application Software | |
| MarketCap: 437.262 Millions | |
| Recent Price: 1.91 Smart Investing & Trading Score: 52 | |
| Day Percent Change: 2.69% Day Change: 0.05 | |
| Week Change: 2.14% Year-to-date Change: -72.2% | |
| APPS Links: Profile News Message Board | |
| Charts:- Daily , Weekly | |
| Add APPS to Watchlist: View: Get Complete APPS Trend Analysis ➞ | |
 | AAN Aaron s, Inc. |
| Sector: Transports | |
| SubSector: Rental & Leasing Services | |
| MarketCap: 1087.04 Millions | |
| Recent Price: 7.31 Smart Investing & Trading Score: 42 | |
| Day Percent Change: 3.10% Day Change: 0.22 | |
| Week Change: 2.09% Year-to-date Change: -32.8% | |
| AAN Links: Profile News Message Board | |
| Charts:- Daily , Weekly | |
| Add AAN to Watchlist: View: Get Complete AAN Trend Analysis ➞ | |
 | SENEA Seneca Foods Corporation |
| Sector: Consumer Staples | |
| SubSector: Processed & Packaged Goods | |
| MarketCap: 326.348 Millions | |
| Recent Price: 56.78 Smart Investing & Trading Score: 93 | |
| Day Percent Change: 1.07% Day Change: 0.60 | |
| Week Change: 2.05% Year-to-date Change: 8.3% | |
| SENEA Links: Profile News Message Board | |
| Charts:- Daily , Weekly | |
| Add SENEA to Watchlist: View: Get Complete SENEA Trend Analysis ➞ | |
 | AGX Argan, Inc. |
| Sector: Industrials | |
| SubSector: Heavy Construction | |
| MarketCap: 664.095 Millions | |
| Recent Price: 60.99 Smart Investing & Trading Score: 95 | |
| Day Percent Change: 1.57% Day Change: 0.94 | |
| Week Change: 2.04% Year-to-date Change: 30.4% | |
| AGX Links: Profile News Message Board | |
| Charts:- Daily , Weekly | |
| Add AGX to Watchlist: View: Get Complete AGX Trend Analysis ➞ | |
 | PRMW Primo Water Corporation |
| Sector: Consumer Staples | |
| SubSector: Beverages - Soft Drinks | |
| MarketCap: 1479.7 Millions | |
| Recent Price: 18.12 Smart Investing & Trading Score: 88 | |
| Day Percent Change: 1.74% Day Change: 0.31 | |
| Week Change: 2.03% Year-to-date Change: 20.4% | |
| PRMW Links: Profile News Message Board | |
| Charts:- Daily , Weekly | |
| Add PRMW to Watchlist: View: Get Complete PRMW Trend Analysis ➞ | |
| Too many stocks? View smallcap stocks filtered by marketcap & sector |
| Marketcap: All SmallCap Stocks (default-no microcap), Large, Mid-Range, Small & MicroCap |
| Sector: Tech, Finance, Energy, Staples, Retail, Industrial, Materials, Utilities & Medical |
|
Best Stocks Today 12Stocks.com |
© 2024 12Stocks.com Terms & Conditions Privacy Contact Us
All Information Provided Only For Education And Not To Be Used For Investing or Trading. See Terms & Conditions


One More Thing ... Get Best Stocks Delivered Daily!
Never Ever Miss A Move With Our Top Ten Stocks Lists
Find Best Stocks In Any Market - Bull or Bear Market
Take A Peek At Our Top Ten Stocks Lists: Daily, Weekly, Year-to-Date & Top Trends
Find Best Stocks In Any Market - Bull or Bear Market
Take A Peek At Our Top Ten Stocks Lists: Daily, Weekly, Year-to-Date & Top Trends
Smallcap Stocks With Best Up Trends [0-bearish to 100-bullish]: Badger Meter[100], Cullinan Oncology[100], Oscar Health[100], NextNav [100], EchoStar [100], Victory Capital[100], Macatawa Bank[100], IMAX [100], Envestnet [100], ALX Oncology[100], Argan [95]
Best Smallcap Stocks Year-to-Date:
Agenus [500.31%], CareMax [417.53%], Janux [348.12%], Viking [247.5%], Alpine Immune[238.5%], Super Micro[226.63%], Longboard [194.76%], Arcutis Bio[192.57%], Vera [161.3%], Avidity Biosciences[154.87%], Hippo [128.32%] Best Smallcap Stocks This Week:
Macatawa Bank[44.42%], 23andMe Holding[33.3%], ProKidney [32%], Snap One[29.73%], Vertex Energy[25.96%], ALX Oncology[20.64%], Vanda [20.63%], Expensify [18.37%], Badger Meter[16.72%], ContextLogic [15%], Cullinan Oncology[13.89%] Best Smallcap Stocks Daily:
23andMe Holding[65.91%], Vertex Energy[33.78%], Zura Bio[17.20%], Badger Meter[16.65%], ContextLogic [15.81%], Expensify [15.23%], Montrose Environmental[12.84%], Vaxxinity [10.05%], Cipher Mining[8.65%], FiscalNote [8.61%], Vuzix [8.15%]