
 Login Sign Up


| |||||
 |  | ||||

| 12Stocks.com Market Intelligence |
Best SmallCap Stocks
|
| In a hurry? Small Cap Stock Lists: Performance Trends Table, Stock Charts
Sort Small Cap stocks: Daily, Weekly, Year-to-Date, Market Cap & Trends. Filter Small Cap stocks list by sector: Show all, Tech, Finance, Energy, Staples, Retail, Industrial, Materials, Utilities and HealthCare Filter Small Cap stocks list by size: All Large Medium Small and MicroCap |
| 12Stocks.com Small Cap Stocks Performances & Trends Daily | |||||||||
|
|  The overall Smart Investing & Trading Score is 13 (0-bearish to 100-bullish) which puts Small Cap index in short term bearish trend. The Smart Investing & Trading Score from previous trading session is 26 and hence a deterioration of trend.
| ||||||||
Here are the Smart Investing & Trading Scores of the most requested small cap stocks at 12Stocks.com (click stock name for detailed review):
|


| 12Stocks.com: Investing in Smallcap Index with Stocks | |
|
The following table helps investors and traders sort through current performance and trends (as measured by Smart Investing & Trading Score) of various
stocks in the Smallcap Index. Quick View: Move mouse or cursor over stock symbol (ticker) to view short-term technical chart and over stock name to view long term chart. Click on  to add stock symbol to your watchlist and to add stock symbol to your watchlist and  to view watchlist. Click on any ticker or stock name for detailed market intelligence report for that stock. to view watchlist. Click on any ticker or stock name for detailed market intelligence report for that stock. |
12Stocks.com Performance of Stocks in Smallcap Index
| Ticker | Stock Name | Watchlist | Category | Recent Price | Smart Investing & Trading Score | Change % | Weekly Change% |
| REX | REX American |   | Industrials | 57.15 | 73 | 4.57% | 0.76% |
| ALKT | Alkami | | Technology | 23.85 | 37 | 0.04% | 0.76% |
| CHMG | Chemung Financial | | Financials | 39.80 | 27 | 0.66% | 0.73% |
| TSQ | Townsquare Media | | Services & Goods | 12.40 | 76 | 1.97% | 0.73% |
| ACVA | ACV Auctions | | Services & Goods | 17.83 | 56 | 3.12% | 0.73% |
| SIG | Signet Jewelers | | Services & Goods | 96.46 | 15 | -0.18% | 0.72% |
| ATMU | Atmus Filtration | | Industrials | 32.20 | 58 | -0.31% | 0.72% |
| SMTC | Semtech | | Technology | 32.86 | 71 | -0.24% | 0.67% |
| CBAN | Colony Bankcorp | | Financials | 10.64 | 35 | 1.82% | 0.66% |
| UNTY | Unity Bancorp | | Financials | 26.44 | 18 | 0.30% | 0.65% |
| AOMR | Angel Oak | | Financials | 11.09 | 81 | 2.12% | 0.64% |
| VRA | Vera Bradley | | Consumer Staples | 6.39 | 25 | 0.16% | 0.63% |
| NSSC | Napco Security | | Services & Goods | 39.01 | 51 | 0.41% | 0.62% |
| GOGL | Golden Ocean | | Transports | 13.09 | 90 | 0.23% | 0.61% |
| AFRI | Forafric Global | | Consumer Staples | 10.35 | 52 | 0.00% | 0.58% |
| BH | Biglari | | Services & Goods | 192.16 | 69 | -1.49% | 0.57% |
| VZIO | VIZIO Holding | | Technology | 10.75 | 54 | 0.47% | 0.56% |
| MG | Mistras Group | | Services & Goods | 9.10 | 58 | -2.26% | 0.55% |
| EXTR | Extreme s | | Technology | 11.13 | 37 | 0.00% | 0.54% |
| STRS | Stratus Properties | | Financials | 22.40 | 59 | 0.49% | 0.54% |
| PLBC | Plumas Bancorp | | Financials | 35.30 | 38 | 0.21% | 0.53% |
| PAYO | Payoneer Global | | Technology | 4.86 | 78 | 0.73% | 0.52% |
| HCI | HCI Group | | Financials | 109.91 | 56 | -1.69% | 0.51% |
| WEST | Westrock Coffee | | Consumer Staples | 10.04 | 25 | 0.20% | 0.50% |
| ARQT | Arcutis Bio | | Health Care | 10.25 | 66 | 1.49% | 0.49% |


| Too many stocks? View smallcap stocks filtered by marketcap & sector |
| Marketcap: All SmallCap Stocks (default-no microcap), Large, Mid-Range, Small |
| Smallcap Sector: Tech, Finance, Energy, Staples, Retail, Industrial, Materials, & Medical |
|
Get the most comprehensive stock market coverage daily at 12Stocks.com ➞ Best Stocks Today ➞ Best Stocks Weekly ➞ Best Stocks Year-to-Date ➞ Best Stocks Trends ➞  Best Stocks Today 12Stocks.com Best Nasdaq Stocks ➞ Best S&P 500 Stocks ➞ Best Tech Stocks ➞ Best Biotech Stocks ➞ |
| Detailed Overview of SmallCap Stocks |
| SmallCap Technical Overview, Leaders & Laggards, Top SmallCap ETF Funds & Detailed SmallCap Stocks List, Charts, Trends & More |
| Smallcap: Technical Analysis, Trends & YTD Performance | |
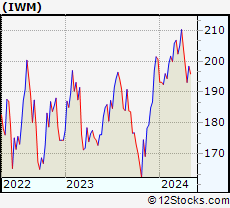
| SmallCap segment as represented by
IWM, an exchange-traded fund [ETF], holds basket of thousands of smallcap stocks from across all major sectors of the US stock market. The smallcap index (contains stocks like Riverbed & Sotheby's) is down by -3.84% and is currently underperforming the overall market by -8.25% year-to-date. Below is a quick view of technical charts and trends: | |
 IWM Weekly Chart |
|
| Long Term Trend: Good | |
| Medium Term Trend: Not Good | |
 IWM Daily Chart |
|
| Short Term Trend: Not Good | |
| Overall Trend Score: 13 | |
| YTD Performance: -3.84% | |
| **Trend Scores & Views Are Only For Educational Purposes And Not For Investing | |
| 12Stocks.com: Top Performing Small Cap Index Stocks | ||||||||||||||||||||||||||||||||||||||||||||||||
 The top performing Small Cap Index stocks year to date are
Now, more recently, over last week, the top performing Small Cap Index stocks on the move are


|
||||||||||||||||||||||||||||||||||||||||||||||||
| 12Stocks.com: Investing in Smallcap Index using Exchange Traded Funds | |
|
The following table shows list of key exchange traded funds (ETF) that
help investors track Smallcap index. The following list also includes leveraged ETF funds that track twice or thrice the daily returns of Smallcap indices. Short or inverse ETF funds move in the opposite direction to the index they track and are useful during market pullbacks or during bear markets. Quick View: Move mouse or cursor over ETF symbol (ticker) to view short-term technical chart and over ETF name to view long term chart. Click on ticker or stock name for detailed view. Click on to add stock symbol to your watchlist and to view watchlist. |
12Stocks.com List of ETFs that track Smallcap Index
| Ticker | ETF Name | Watchlist | Recent Price | Smart Investing & Trading Score | Change % | Week % | Year-to-date % |
| IWM | iShares Russell 2000 | | 193.00 | 13 | -1.06 | -2.86 | -3.84% |
| IJR | iShares Core S&P Small-Cap | | 102.13 | 17 | -0.58 | -2.28 | -5.65% |
| VTWO | Vanguard Russell 2000 ETF | | 78.05 | 36 | -1.04 | -2.83 | -3.76% |
| IWN | iShares Russell 2000 Value | | 146.03 | 23 | -0.77 | -2.89 | -5.99% |
| IWO | iShares Russell 2000 Growth | | 248.02 | 36 | -0.90 | -2.87 | -1.67% |
| IJS | iShares S&P Small-Cap 600 Value | | 94.12 | 17 | -0.57 | -2.13 | -8.68% |
| IJT | iShares S&P Small-Cap 600 Growth | | 121.84 | 41 | -1.02 | -2.36 | -2.64% |
| XSLV | PowerShares S&P SmallCap Low Volatil ETF | | 41.42 | 10 | -0.38 | -1.59 | -6.18% |
| SAA | ProShares Ultra SmallCap600 | | 21.66 | 0 | -1.19 | -3.99 | -13.19% |
| SMLV | SPDR SSGA US Small Cap Low Volatil ETF | | 103.66 | 10 | -0.17 | -1.29 | -7.87% |
| SBB | ProShares Short SmallCap600 | | 16.85 | 93 | 0.42 | 1.83 | 5.78% |
| SDD | ProShares UltraShort SmallCap600 | | 20.60 | 93 | 1.23 | 3.88 | 11.8% |
| 12Stocks.com: Charts, Trends, Fundamental Data and Performances of SmallCap Stocks | |
|
We now take in-depth look at all SmallCap stocks including charts, multi-period performances and overall trends (as measured by Smart Investing & Trading Score). One can sort SmallCap stocks (click link to choose) by Daily, Weekly and by Year-to-Date performances. Also, one can sort by size of the company or by market capitalization. |
| Select Your Default Chart Type: | |||||
| |||||
| Click on stock symbol or name for detailed view. Click on to add stock symbol to your watchlist and to view watchlist. Quick View: Move mouse or cursor over "Daily" to quickly view daily technical stock chart and over "Weekly" to view weekly technical stock chart. | |||||

 | REX REX American Resources Corporation |
| Sector: Industrials | |
| SubSector: Conglomerates | |
| MarketCap: 373.748 Millions | |
| Recent Price: 57.15 Smart Investing & Trading Score: 73 | |
| Day Percent Change: 4.57% Day Change: 2.50 | |
| Week Change: 0.76% Year-to-date Change: 20.8% | |
| REX Links: Profile News Message Board | |
| Charts:- Daily , Weekly | |
| Add REX to Watchlist: View: Get Complete REX Trend Analysis ➞ | |
 | ALKT Alkami Technology, Inc. |
| Sector: Technology | |
| SubSector: Software - Application | |
| MarketCap: 1530 Millions | |
| Recent Price: 23.85 Smart Investing & Trading Score: 37 | |
| Day Percent Change: 0.04% Day Change: 0.01 | |
| Week Change: 0.76% Year-to-date Change: -1.3% | |
| ALKT Links: Profile News Message Board | |
| Charts:- Daily , Weekly | |
| Add ALKT to Watchlist: View: Get Complete ALKT Trend Analysis ➞ | |
 | CHMG Chemung Financial Corporation |
| Sector: Financials | |
| SubSector: Regional - Pacific Banks | |
| MarketCap: 142.229 Millions | |
| Recent Price: 39.80 Smart Investing & Trading Score: 27 | |
| Day Percent Change: 0.66% Day Change: 0.26 | |
| Week Change: 0.73% Year-to-date Change: -20.1% | |
| CHMG Links: Profile News Message Board | |
| Charts:- Daily , Weekly | |
| Add CHMG to Watchlist: View: Get Complete CHMG Trend Analysis ➞ | |
 | TSQ Townsquare Media, Inc. |
| Sector: Services & Goods | |
| SubSector: Broadcasting - Radio | |
| MarketCap: 101.795 Millions | |
| Recent Price: 12.40 Smart Investing & Trading Score: 76 | |
| Day Percent Change: 1.97% Day Change: 0.24 | |
| Week Change: 0.73% Year-to-date Change: 17.4% | |
| TSQ Links: Profile News Message Board | |
| Charts:- Daily , Weekly | |
| Add TSQ to Watchlist: View: Get Complete TSQ Trend Analysis ➞ | |
 | ACVA ACV Auctions Inc. |
| Sector: Services & Goods | |
| SubSector: Auto & Truck Dealerships | |
| MarketCap: 2680 Millions | |
| Recent Price: 17.83 Smart Investing & Trading Score: 56 | |
| Day Percent Change: 3.12% Day Change: 0.54 | |
| Week Change: 0.73% Year-to-date Change: 18.4% | |
| ACVA Links: Profile News Message Board | |
| Charts:- Daily , Weekly | |
| Add ACVA to Watchlist: View: Get Complete ACVA Trend Analysis ➞ | |
 | SIG Signet Jewelers Limited |
| Sector: Services & Goods | |
| SubSector: Jewelry Stores | |
| MarketCap: 518.1 Millions | |
| Recent Price: 96.46 Smart Investing & Trading Score: 15 | |
| Day Percent Change: -0.18% Day Change: -0.17 | |
| Week Change: 0.72% Year-to-date Change: -10.1% | |
| SIG Links: Profile News Message Board | |
| Charts:- Daily , Weekly | |
| Add SIG to Watchlist: View: Get Complete SIG Trend Analysis ➞ | |
 | ATMU Atmus Filtration Technologies Inc. |
| Sector: Industrials | |
| SubSector: Pollution & Treatment Controls | |
| MarketCap: 1830 Millions | |
| Recent Price: 32.20 Smart Investing & Trading Score: 58 | |
| Day Percent Change: -0.31% Day Change: -0.10 | |
| Week Change: 0.72% Year-to-date Change: 37.8% | |
| ATMU Links: Profile News Message Board | |
| Charts:- Daily , Weekly | |
| Add ATMU to Watchlist: View: Get Complete ATMU Trend Analysis ➞ | |
 | SMTC Semtech Corporation |
| Sector: Technology | |
| SubSector: Semiconductor - Integrated Circuits | |
| MarketCap: 2285 Millions | |
| Recent Price: 32.86 Smart Investing & Trading Score: 71 | |
| Day Percent Change: -0.24% Day Change: -0.08 | |
| Week Change: 0.67% Year-to-date Change: 50.0% | |
| SMTC Links: Profile News Message Board | |
| Charts:- Daily , Weekly | |
| Add SMTC to Watchlist: View: Get Complete SMTC Trend Analysis ➞ | |
 | CBAN Colony Bankcorp, Inc. |
| Sector: Financials | |
| SubSector: Regional - Mid-Atlantic Banks | |
| MarketCap: 115.559 Millions | |
| Recent Price: 10.64 Smart Investing & Trading Score: 35 | |
| Day Percent Change: 1.82% Day Change: 0.19 | |
| Week Change: 0.66% Year-to-date Change: -20.0% | |
| CBAN Links: Profile News Message Board | |
| Charts:- Daily , Weekly | |
| Add CBAN to Watchlist: View: Get Complete CBAN Trend Analysis ➞ | |
 | UNTY Unity Bancorp, Inc. |
| Sector: Financials | |
| SubSector: Money Center Banks | |
| MarketCap: 149.099 Millions | |
| Recent Price: 26.44 Smart Investing & Trading Score: 18 | |
| Day Percent Change: 0.30% Day Change: 0.08 | |
| Week Change: 0.65% Year-to-date Change: -10.7% | |
| UNTY Links: Profile News Message Board | |
| Charts:- Daily , Weekly | |
| Add UNTY to Watchlist: View: Get Complete UNTY Trend Analysis ➞ | |
 | AOMR Angel Oak Mortgage REIT, Inc. |
| Sector: Financials | |
| SubSector: REIT - Mortgage | |
| MarketCap: 202 Millions | |
| Recent Price: 11.09 Smart Investing & Trading Score: 81 | |
| Day Percent Change: 2.12% Day Change: 0.23 | |
| Week Change: 0.64% Year-to-date Change: 4.5% | |
| AOMR Links: Profile News Message Board | |
| Charts:- Daily , Weekly | |
| Add AOMR to Watchlist: View: Get Complete AOMR Trend Analysis ➞ | |
 | VRA Vera Bradley, Inc. |
| Sector: Consumer Staples | |
| SubSector: Textile - Apparel Footwear & Accessories | |
| MarketCap: 151.17 Millions | |
| Recent Price: 6.39 Smart Investing & Trading Score: 25 | |
| Day Percent Change: 0.16% Day Change: 0.01 | |
| Week Change: 0.63% Year-to-date Change: -17.0% | |
| VRA Links: Profile News Message Board | |
| Charts:- Daily , Weekly | |
| Add VRA to Watchlist: View: Get Complete VRA Trend Analysis ➞ | |
 | NSSC Napco Security Technologies, Inc. |
| Sector: Services & Goods | |
| SubSector: Security & Protection Services | |
| MarketCap: 339.103 Millions | |
| Recent Price: 39.01 Smart Investing & Trading Score: 51 | |
| Day Percent Change: 0.41% Day Change: 0.16 | |
| Week Change: 0.62% Year-to-date Change: 13.9% | |
| NSSC Links: Profile News Message Board | |
| Charts:- Daily , Weekly | |
| Add NSSC to Watchlist: View: Get Complete NSSC Trend Analysis ➞ | |
 | GOGL Golden Ocean Group Limited |
| Sector: Transports | |
| SubSector: Shipping | |
| MarketCap: 446.614 Millions | |
| Recent Price: 13.09 Smart Investing & Trading Score: 90 | |
| Day Percent Change: 0.23% Day Change: 0.03 | |
| Week Change: 0.61% Year-to-date Change: 34.1% | |
| GOGL Links: Profile News Message Board | |
| Charts:- Daily , Weekly | |
| Add GOGL to Watchlist: View: Get Complete GOGL Trend Analysis ➞ | |
 | AFRI Forafric Global PLC |
| Sector: Consumer Staples | |
| SubSector: Farm Products | |
| MarketCap: 295 Millions | |
| Recent Price: 10.35 Smart Investing & Trading Score: 52 | |
| Day Percent Change: 0.00% Day Change: 0.00 | |
| Week Change: 0.58% Year-to-date Change: -2.3% | |
| AFRI Links: Profile News Message Board | |
| Charts:- Daily , Weekly | |
| Add AFRI to Watchlist: View: Get Complete AFRI Trend Analysis ➞ | |
 | BH Biglari Holdings Inc. |
| Sector: Services & Goods | |
| SubSector: Restaurants | |
| MarketCap: 149.07 Millions | |
| Recent Price: 192.16 Smart Investing & Trading Score: 69 | |
| Day Percent Change: -1.49% Day Change: -2.91 | |
| Week Change: 0.57% Year-to-date Change: 16.5% | |
| BH Links: Profile News Message Board | |
| Charts:- Daily , Weekly | |
| Add BH to Watchlist: View: Get Complete BH Trend Analysis ➞ | |
 | VZIO VIZIO Holding Corp. |
| Sector: Technology | |
| SubSector: Consumer Electronics | |
| MarketCap: 1300 Millions | |
| Recent Price: 10.75 Smart Investing & Trading Score: 54 | |
| Day Percent Change: 0.47% Day Change: 0.05 | |
| Week Change: 0.56% Year-to-date Change: 39.4% | |
| VZIO Links: Profile News Message Board | |
| Charts:- Daily , Weekly | |
| Add VZIO to Watchlist: View: Get Complete VZIO Trend Analysis ➞ | |
 | MG Mistras Group, Inc. |
| Sector: Services & Goods | |
| SubSector: Security & Protection Services | |
| MarketCap: 136.903 Millions | |
| Recent Price: 9.10 Smart Investing & Trading Score: 58 | |
| Day Percent Change: -2.26% Day Change: -0.21 | |
| Week Change: 0.55% Year-to-date Change: 24.3% | |
| MG Links: Profile News Message Board | |
| Charts:- Daily , Weekly | |
| Add MG to Watchlist: View: Get Complete MG Trend Analysis ➞ | |
 | EXTR Extreme Networks, Inc. |
| Sector: Technology | |
| SubSector: Communication Equipment | |
| MarketCap: 339.939 Millions | |
| Recent Price: 11.13 Smart Investing & Trading Score: 37 | |
| Day Percent Change: 0.00% Day Change: 0.00 | |
| Week Change: 0.54% Year-to-date Change: -36.9% | |
| EXTR Links: Profile News Message Board | |
| Charts:- Daily , Weekly | |
| Add EXTR to Watchlist: View: Get Complete EXTR Trend Analysis ➞ | |
 | STRS Stratus Properties Inc. |
| Sector: Financials | |
| SubSector: Real Estate Development | |
| MarketCap: 167.819 Millions | |
| Recent Price: 22.40 Smart Investing & Trading Score: 59 | |
| Day Percent Change: 0.49% Day Change: 0.11 | |
| Week Change: 0.54% Year-to-date Change: -22.4% | |
| STRS Links: Profile News Message Board | |
| Charts:- Daily , Weekly | |
| Add STRS to Watchlist: View: Get Complete STRS Trend Analysis ➞ | |
 | PLBC Plumas Bancorp |
| Sector: Financials | |
| SubSector: Regional - Pacific Banks | |
| MarketCap: 85.0829 Millions | |
| Recent Price: 35.30 Smart Investing & Trading Score: 38 | |
| Day Percent Change: 0.21% Day Change: 0.08 | |
| Week Change: 0.53% Year-to-date Change: -14.6% | |
| PLBC Links: Profile News Message Board | |
| Charts:- Daily , Weekly | |
| Add PLBC to Watchlist: View: Get Complete PLBC Trend Analysis ➞ | |
 | PAYO Payoneer Global Inc. |
| Sector: Technology | |
| SubSector: Software - Infrastructure | |
| MarketCap: 1710 Millions | |
| Recent Price: 4.86 Smart Investing & Trading Score: 78 | |
| Day Percent Change: 0.73% Day Change: 0.04 | |
| Week Change: 0.52% Year-to-date Change: -8.2% | |
| PAYO Links: Profile News Message Board | |
| Charts:- Daily , Weekly | |
| Add PAYO to Watchlist: View: Get Complete PAYO Trend Analysis ➞ | |
 | HCI HCI Group, Inc. |
| Sector: Financials | |
| SubSector: Property & Casualty Insurance | |
| MarketCap: 297.412 Millions | |
| Recent Price: 109.91 Smart Investing & Trading Score: 56 | |
| Day Percent Change: -1.69% Day Change: -1.89 | |
| Week Change: 0.51% Year-to-date Change: 25.8% | |
| HCI Links: Profile News Message Board | |
| Charts:- Daily , Weekly | |
| Add HCI to Watchlist: View: Get Complete HCI Trend Analysis ➞ | |
 | WEST Westrock Coffee Company, LLC |
| Sector: Consumer Staples | |
| SubSector: Packaged Foods | |
| MarketCap: 799 Millions | |
| Recent Price: 10.04 Smart Investing & Trading Score: 25 | |
| Day Percent Change: 0.20% Day Change: 0.02 | |
| Week Change: 0.5% Year-to-date Change: -1.2% | |
| WEST Links: Profile News Message Board | |
| Charts:- Daily , Weekly | |
| Add WEST to Watchlist: View: Get Complete WEST Trend Analysis ➞ | |
 | ARQT Arcutis Biotherapeutics, Inc. |
| Sector: Health Care | |
| SubSector: Biotechnology | |
| MarketCap: 12787 Millions | |
| Recent Price: 10.25 Smart Investing & Trading Score: 66 | |
| Day Percent Change: 1.49% Day Change: 0.15 | |
| Week Change: 0.49% Year-to-date Change: 217.3% | |
| ARQT Links: Profile News Message Board | |
| Charts:- Daily , Weekly | |
| Add ARQT to Watchlist: View: Get Complete ARQT Trend Analysis ➞ | |
| Too many stocks? View smallcap stocks filtered by marketcap & sector |
| Marketcap: All SmallCap Stocks (default-no microcap), Large, Mid-Range, Small & MicroCap |
| Sector: Tech, Finance, Energy, Staples, Retail, Industrial, Materials, Utilities & Medical |
|
Best Stocks Today 12Stocks.com |
© 2024 12Stocks.com Terms & Conditions Privacy Contact Us
All Information Provided Only For Education And Not To Be Used For Investing or Trading. See Terms & Conditions


One More Thing ... Get Best Stocks Delivered Daily!
Never Ever Miss A Move With Our Top Ten Stocks Lists
Find Best Stocks In Any Market - Bull or Bear Market
Take A Peek At Our Top Ten Stocks Lists: Daily, Weekly, Year-to-Date & Top Trends
Find Best Stocks In Any Market - Bull or Bear Market
Take A Peek At Our Top Ten Stocks Lists: Daily, Weekly, Year-to-Date & Top Trends
Smallcap Stocks With Best Up Trends [0-bearish to 100-bullish]: Vanda [100], Zuora [100], ALX Oncology[100], ProKidney [100], IMAX [100], Envestnet [100], Intra-Cellular Therapies[100], Dorian LPG[95], Victory Capital[95], Oscar Health[95], Reneo [93]
Best Smallcap Stocks Year-to-Date:
Agenus [552.25%], CareMax [416.49%], Janux [346.07%], Viking [257.17%], Alpine Immune[238.55%], Super Micro[237.75%], Arcutis Bio[217.34%], Longboard [177.91%], Avidity Biosciences[160.56%], Vera [158.46%], Stoke [122.81%] Best Smallcap Stocks This Week:
ProKidney [61.71%], Macatawa Bank[42.75%], Snap One[29.85%], Vanda [27.18%], ALX Oncology[23.41%], Intra-Cellular Therapies[16.41%], Escalade [13.71%], Karyopharm [13.11%], Encore Wire[10.06%], Zuora [10%], Direxion Daily[8.81%] Best Smallcap Stocks Daily:
Vanda [29.38%], Karyopharm [25.45%], Cutera [18.41%], Children s[16.46%], WW [14.10%], Lineage Cell[12.17%], Zuora [11.69%], ALX Oncology[10.97%], Marinus [10.77%], Acrivon [9.19%], Cue Biopharma[9.03%]