
 Login Sign Up


| |||||
 |  | ||||

| 12Stocks.com Market Intelligence |
Best SmallCap Stocks
|
| In a hurry? Small Cap Stock Lists: Performance Trends Table, Stock Charts
Sort Small Cap stocks: Daily, Weekly, Year-to-Date, Market Cap & Trends. Filter Small Cap stocks list by sector: Show all, Tech, Finance, Energy, Staples, Retail, Industrial, Materials, Utilities and HealthCare Filter Small Cap stocks list by size: All Large Medium Small and MicroCap |
| 12Stocks.com Small Cap Stocks Performances & Trends Daily | |||||||||
|
|  The overall Smart Investing & Trading Score is 88 (0-bearish to 100-bullish) which puts Small Cap index in short term bullish trend. The Smart Investing & Trading Score from previous trading session is 56 and hence an improvement of trend.
| ||||||||
Here are the Smart Investing & Trading Scores of the most requested small cap stocks at 12Stocks.com (click stock name for detailed review):
|


| 12Stocks.com: Investing in Smallcap Index with Stocks | |
|
The following table helps investors and traders sort through current performance and trends (as measured by Smart Investing & Trading Score) of various
stocks in the Smallcap Index. Quick View: Move mouse or cursor over stock symbol (ticker) to view short-term technical chart and over stock name to view long term chart. Click on  to add stock symbol to your watchlist and to add stock symbol to your watchlist and  to view watchlist. Click on any ticker or stock name for detailed market intelligence report for that stock. to view watchlist. Click on any ticker or stock name for detailed market intelligence report for that stock. |
12Stocks.com Performance of Stocks in Smallcap Index
| Ticker | Stock Name | Watchlist | Category | Recent Price | Smart Investing & Trading Score | Change % | Weekly Change% |
| NMRK | Newmark Group |   | Financials | 9.82 | 39 | 0.61% | 0.61% |
| CMCO | Columbus McKinnon | | Industrials | 42.18 | 75 | 0.60% | 0.60% |
| CPF | Central Pacific | | Financials | 20.24 | 95 | 0.60% | 0.60% |
| MC | Moelis & | | Financials | 50.05 | 0 | 0.60% | 0.60% |
| TPB | Turning Point | | Consumer Staples | 28.41 | 90 | 0.60% | 0.60% |
| HIPO | Hippo | | Financials | 21.95 | 75 | 0.60% | 0.60% |
| MLR | Miller Industries | | Consumer Staples | 49.37 | 48 | 0.59% | 0.59% |
| CWCO | Consolidated Water | | Utilities | 25.37 | 64 | 0.59% | 0.59% |
| PSMT | PriceSmart | | Services & Goods | 81.97 | 90 | 0.59% | 0.59% |
| AFCG | AFC Gamma | | Financials | 11.89 | 83 | 0.59% | 0.59% |
| CSGS | CSG Systems | | Technology | 48.34 | 18 | 0.58% | 0.58% |
| DDD | 3D Systems | | Technology | 3.45 | 37 | 0.58% | 0.58% |
| UTMD | Utah Medical | | Health Care | 66.30 | 30 | 0.58% | 0.58% |
| EVH | Evolent Health | | Technology | 27.81 | 0 | 0.58% | 0.58% |
| BRY | Berry | | Energy | 8.79 | 95 | 0.57% | 0.57% |
| ROIC | Retail Opportunity | | Financials | 12.32 | 39 | 0.57% | 0.57% |
| TALO | Talos Energy | | Energy | 14.02 | 80 | 0.57% | 0.57% |
| PWSC | PowerSchool | | Technology | 17.67 | 35 | 0.57% | 0.57% |
| HAE | Haemonetics | | Health Care | 91.50 | 100 | 0.56% | 0.56% |
| ENS | EnerSys | | Industrials | 91.79 | 25 | 0.56% | 0.56% |
| PLUS | ePlus | | Technology | 78.63 | 78 | 0.56% | 0.56% |
| POWL | Powell Industries | | Industrials | 149.66 | 83 | 0.56% | 0.56% |
| VC | Visteon | | Consumer Staples | 112.81 | 74 | 0.55% | 0.55% |
| IBOC | Bancshares | | Financials | 56.46 | 93 | 0.55% | 0.55% |
| DRH | DiamondRock Hospitality | | Financials | 9.10 | 15 | 0.55% | 0.55% |


| Too many stocks? View smallcap stocks filtered by marketcap & sector |
| Marketcap: All SmallCap Stocks (default-no microcap), Large, Mid-Range, Small |
| Smallcap Sector: Tech, Finance, Energy, Staples, Retail, Industrial, Materials, & Medical |
|
Get the most comprehensive stock market coverage daily at 12Stocks.com ➞ Best Stocks Today ➞ Best Stocks Weekly ➞ Best Stocks Year-to-Date ➞ Best Stocks Trends ➞  Best Stocks Today 12Stocks.com Best Nasdaq Stocks ➞ Best S&P 500 Stocks ➞ Best Tech Stocks ➞ Best Biotech Stocks ➞ |
| Detailed Overview of SmallCap Stocks |
| SmallCap Technical Overview, Leaders & Laggards, Top SmallCap ETF Funds & Detailed SmallCap Stocks List, Charts, Trends & More |
| Smallcap: Technical Analysis, Trends & YTD Performance | |
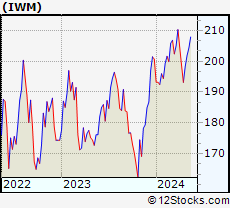
| SmallCap segment as represented by
IWM, an exchange-traded fund [ETF], holds basket of thousands of smallcap stocks from across all major sectors of the US stock market. The smallcap index (contains stocks like Riverbed & Sotheby's) is down by -0.37% and is currently underperforming the overall market by -6.93% year-to-date. Below is a quick view of technical charts and trends: | |
 IWM Weekly Chart |
|
| Long Term Trend: Very Good | |
| Medium Term Trend: Good | |
 IWM Daily Chart |
|
| Short Term Trend: Very Good | |
| Overall Trend Score: 88 | |
| YTD Performance: -0.37% | |
| **Trend Scores & Views Are Only For Educational Purposes And Not For Investing | |
| 12Stocks.com: Top Performing Small Cap Index Stocks | ||||||||||||||||||||||||||||||||||||||||||||||||
 The top performing Small Cap Index stocks year to date are
Now, more recently, over last week, the top performing Small Cap Index stocks on the move are


|
||||||||||||||||||||||||||||||||||||||||||||||||
| 12Stocks.com: Investing in Smallcap Index using Exchange Traded Funds | |
|
The following table shows list of key exchange traded funds (ETF) that
help investors track Smallcap index. The following list also includes leveraged ETF funds that track twice or thrice the daily returns of Smallcap indices. Short or inverse ETF funds move in the opposite direction to the index they track and are useful during market pullbacks or during bear markets. Quick View: Move mouse or cursor over ETF symbol (ticker) to view short-term technical chart and over ETF name to view long term chart. Click on ticker or stock name for detailed view. Click on to add stock symbol to your watchlist and to view watchlist. |
12Stocks.com List of ETFs that track Smallcap Index
| Ticker | ETF Name | Watchlist | Recent Price | Smart Investing & Trading Score | Change % | Week % | Year-to-date % |
| IWM | iShares Russell 2000 | | 199.96 | 88 | 0.79 | 0.79 | -0.37% |
| IJR | iShares Core S&P Small-Cap | | 106.41 | 93 | 0.72 | 0.72 | -1.7% |
| VTWO | Vanguard Russell 2000 ETF | | 80.78 | 88 | 0.70 | 0.7 | -0.39% |
| IWN | iShares Russell 2000 Value | | 152.05 | 93 | 0.60 | 0.6 | -2.11% |
| IWO | iShares Russell 2000 Growth | | 255.74 | 78 | 1.05 | 1.05 | 1.4% |
| IJS | iShares S&P Small-Cap 600 Value | | 97.95 | 70 | 0.78 | 0.78 | -4.97% |
| IJT | iShares S&P Small-Cap 600 Growth | | 126.96 | 88 | 0.69 | 0.69 | 1.45% |
| XSLV | PowerShares S&P SmallCap Low Volatil ETF | | 42.87 | 80 | 0.35 | 0.35 | -2.9% |
| SMLV | SPDR SSGA US Small Cap Low Volatil ETF | | 107.77 | 68 | 0.23 | 0.23 | -4.22% |
| SAA | ProShares Ultra SmallCap600 | | 23.27 | 88 | 1.00 | 1 | -6.73% |
| SBB | ProShares Short SmallCap600 | | 16.28 | 8 | -0.64 | -0.64 | 2.2% |
| SDD | ProShares UltraShort SmallCap600 | | 19.09 | 15 | -1.34 | -1.34 | 3.6% |
| 12Stocks.com: Charts, Trends, Fundamental Data and Performances of SmallCap Stocks | |
|
We now take in-depth look at all SmallCap stocks including charts, multi-period performances and overall trends (as measured by Smart Investing & Trading Score). One can sort SmallCap stocks (click link to choose) by Daily, Weekly and by Year-to-Date performances. Also, one can sort by size of the company or by market capitalization. |
| Select Your Default Chart Type: | |||||
| |||||
| Click on stock symbol or name for detailed view. Click on to add stock symbol to your watchlist and to view watchlist. Quick View: Move mouse or cursor over "Daily" to quickly view daily technical stock chart and over "Weekly" to view weekly technical stock chart. | |||||

 | NMRK Newmark Group, Inc. |
| Sector: Financials | |
| SubSector: Property Management | |
| MarketCap: 767.542 Millions | |
| Recent Price: 9.82 Smart Investing & Trading Score: 39 | |
| Day Percent Change: 0.61% Day Change: 0.06 | |
| Week Change: 0.61% Year-to-date Change: -10.4% | |
| NMRK Links: Profile News Message Board | |
| Charts:- Daily , Weekly | |
| Add NMRK to Watchlist: View: Get Complete NMRK Trend Analysis ➞ | |
 | CMCO Columbus McKinnon Corporation |
| Sector: Industrials | |
| SubSector: Farm & Construction Machinery | |
| MarketCap: 598.807 Millions | |
| Recent Price: 42.18 Smart Investing & Trading Score: 75 | |
| Day Percent Change: 0.60% Day Change: 0.25 | |
| Week Change: 0.6% Year-to-date Change: 8.1% | |
| CMCO Links: Profile News Message Board | |
| Charts:- Daily , Weekly | |
| Add CMCO to Watchlist: View: Get Complete CMCO Trend Analysis ➞ | |
 | CPF Central Pacific Financial Corp. |
| Sector: Financials | |
| SubSector: Regional - Pacific Banks | |
| MarketCap: 407.429 Millions | |
| Recent Price: 20.24 Smart Investing & Trading Score: 95 | |
| Day Percent Change: 0.60% Day Change: 0.12 | |
| Week Change: 0.6% Year-to-date Change: 2.9% | |
| CPF Links: Profile News Message Board | |
| Charts:- Daily , Weekly | |
| Add CPF to Watchlist: View: Get Complete CPF Trend Analysis ➞ | |
 | MC Moelis & Company |
| Sector: Financials | |
| SubSector: Asset Management | |
| MarketCap: 1675.93 Millions | |
| Recent Price: 50.05 Smart Investing & Trading Score: 0 | |
| Day Percent Change: 0.60% Day Change: 0.30 | |
| Week Change: 0.6% Year-to-date Change: -10.8% | |
| MC Links: Profile News Message Board | |
| Charts:- Daily , Weekly | |
| Add MC to Watchlist: View: Get Complete MC Trend Analysis ➞ | |
 | TPB Turning Point Brands, Inc. |
| Sector: Consumer Staples | |
| SubSector: Tobacco Products, Other | |
| MarketCap: 381.97 Millions | |
| Recent Price: 28.41 Smart Investing & Trading Score: 90 | |
| Day Percent Change: 0.60% Day Change: 0.17 | |
| Week Change: 0.6% Year-to-date Change: 7.9% | |
| TPB Links: Profile News Message Board | |
| Charts:- Daily , Weekly | |
| Add TPB to Watchlist: View: Get Complete TPB Trend Analysis ➞ | |
 | HIPO Hippo Holdings Inc. |
| Sector: Financials | |
| SubSector: Insurance - Specialty | |
| MarketCap: 377 Millions | |
| Recent Price: 21.95 Smart Investing & Trading Score: 75 | |
| Day Percent Change: 0.60% Day Change: 0.13 | |
| Week Change: 0.6% Year-to-date Change: 140.9% | |
| HIPO Links: Profile News Message Board | |
| Charts:- Daily , Weekly | |
| Add HIPO to Watchlist: View: Get Complete HIPO Trend Analysis ➞ | |
 | MLR Miller Industries, Inc. |
| Sector: Consumer Staples | |
| SubSector: Auto Parts | |
| MarketCap: 335.239 Millions | |
| Recent Price: 49.37 Smart Investing & Trading Score: 48 | |
| Day Percent Change: 0.59% Day Change: 0.29 | |
| Week Change: 0.59% Year-to-date Change: 16.7% | |
| MLR Links: Profile News Message Board | |
| Charts:- Daily , Weekly | |
| Add MLR to Watchlist: View: Get Complete MLR Trend Analysis ➞ | |
 | CWCO Consolidated Water Co. Ltd. |
| Sector: Utilities | |
| SubSector: Water Utilities | |
| MarketCap: 223.302 Millions | |
| Recent Price: 25.37 Smart Investing & Trading Score: 64 | |
| Day Percent Change: 0.59% Day Change: 0.15 | |
| Week Change: 0.59% Year-to-date Change: -28.7% | |
| CWCO Links: Profile News Message Board | |
| Charts:- Daily , Weekly | |
| Add CWCO to Watchlist: View: Get Complete CWCO Trend Analysis ➞ | |
 | PSMT PriceSmart, Inc. |
| Sector: Services & Goods | |
| SubSector: Discount, Variety Stores | |
| MarketCap: 1655.72 Millions | |
| Recent Price: 81.97 Smart Investing & Trading Score: 90 | |
| Day Percent Change: 0.59% Day Change: 0.48 | |
| Week Change: 0.59% Year-to-date Change: 8.2% | |
| PSMT Links: Profile News Message Board | |
| Charts:- Daily , Weekly | |
| Add PSMT to Watchlist: View: Get Complete PSMT Trend Analysis ➞ | |
 | AFCG AFC Gamma, Inc. |
| Sector: Financials | |
| SubSector: REIT - Specialty | |
| MarketCap: 269 Millions | |
| Recent Price: 11.89 Smart Investing & Trading Score: 83 | |
| Day Percent Change: 0.59% Day Change: 0.07 | |
| Week Change: 0.59% Year-to-date Change: -1.3% | |
| AFCG Links: Profile News Message Board | |
| Charts:- Daily , Weekly | |
| Add AFCG to Watchlist: View: Get Complete AFCG Trend Analysis ➞ | |
 | CSGS CSG Systems International, Inc. |
| Sector: Technology | |
| SubSector: Business Software & Services | |
| MarketCap: 1336.78 Millions | |
| Recent Price: 48.34 Smart Investing & Trading Score: 18 | |
| Day Percent Change: 0.58% Day Change: 0.28 | |
| Week Change: 0.58% Year-to-date Change: -9.2% | |
| CSGS Links: Profile News Message Board | |
| Charts:- Daily , Weekly | |
| Add CSGS to Watchlist: View: Get Complete CSGS Trend Analysis ➞ | |
 | DDD 3D Systems Corporation |
| Sector: Technology | |
| SubSector: Computer Peripherals | |
| MarketCap: 842.989 Millions | |
| Recent Price: 3.45 Smart Investing & Trading Score: 37 | |
| Day Percent Change: 0.58% Day Change: 0.02 | |
| Week Change: 0.58% Year-to-date Change: -45.7% | |
| DDD Links: Profile News Message Board | |
| Charts:- Daily , Weekly | |
| Add DDD to Watchlist: View: Get Complete DDD Trend Analysis ➞ | |
 | UTMD Utah Medical Products, Inc. |
| Sector: Health Care | |
| SubSector: Medical Instruments & Supplies | |
| MarketCap: 285.86 Millions | |
| Recent Price: 66.30 Smart Investing & Trading Score: 30 | |
| Day Percent Change: 0.58% Day Change: 0.38 | |
| Week Change: 0.58% Year-to-date Change: -21.3% | |
| UTMD Links: Profile News Message Board | |
| Charts:- Daily , Weekly | |
| Add UTMD to Watchlist: View: Get Complete UTMD Trend Analysis ➞ | |
 | EVH Evolent Health, Inc. |
| Sector: Technology | |
| SubSector: Healthcare Information Services | |
| MarketCap: 486.755 Millions | |
| Recent Price: 27.81 Smart Investing & Trading Score: 0 | |
| Day Percent Change: 0.58% Day Change: 0.16 | |
| Week Change: 0.58% Year-to-date Change: -15.8% | |
| EVH Links: Profile News Message Board | |
| Charts:- Daily , Weekly | |
| Add EVH to Watchlist: View: Get Complete EVH Trend Analysis ➞ | |
 | BRY Berry Corporation |
| Sector: Energy | |
| SubSector: Independent Oil & Gas | |
| MarketCap: 254.793 Millions | |
| Recent Price: 8.79 Smart Investing & Trading Score: 95 | |
| Day Percent Change: 0.57% Day Change: 0.05 | |
| Week Change: 0.57% Year-to-date Change: 25.0% | |
| BRY Links: Profile News Message Board | |
| Charts:- Daily , Weekly | |
| Add BRY to Watchlist: View: Get Complete BRY Trend Analysis ➞ | |
 | ROIC Retail Opportunity Investments Corp. |
| Sector: Financials | |
| SubSector: REIT - Retail | |
| MarketCap: 943.414 Millions | |
| Recent Price: 12.32 Smart Investing & Trading Score: 39 | |
| Day Percent Change: 0.57% Day Change: 0.07 | |
| Week Change: 0.57% Year-to-date Change: -12.2% | |
| ROIC Links: Profile News Message Board | |
| Charts:- Daily , Weekly | |
| Add ROIC to Watchlist: View: Get Complete ROIC Trend Analysis ➞ | |
 | TALO Talos Energy Inc. |
| Sector: Energy | |
| SubSector: Independent Oil & Gas | |
| MarketCap: 396.293 Millions | |
| Recent Price: 14.02 Smart Investing & Trading Score: 80 | |
| Day Percent Change: 0.57% Day Change: 0.08 | |
| Week Change: 0.57% Year-to-date Change: -1.5% | |
| TALO Links: Profile News Message Board | |
| Charts:- Daily , Weekly | |
| Add TALO to Watchlist: View: Get Complete TALO Trend Analysis ➞ | |
 | PWSC PowerSchool Holdings, Inc. |
| Sector: Technology | |
| SubSector: Software - Application | |
| MarketCap: 3870 Millions | |
| Recent Price: 17.67 Smart Investing & Trading Score: 35 | |
| Day Percent Change: 0.57% Day Change: 0.10 | |
| Week Change: 0.57% Year-to-date Change: -25.3% | |
| PWSC Links: Profile News Message Board | |
| Charts:- Daily , Weekly | |
| Add PWSC to Watchlist: View: Get Complete PWSC Trend Analysis ➞ | |
 | HAE Haemonetics Corporation |
| Sector: Health Care | |
| SubSector: Medical Instruments & Supplies | |
| MarketCap: 4500.7 Millions | |
| Recent Price: 91.50 Smart Investing & Trading Score: 100 | |
| Day Percent Change: 0.56% Day Change: 0.51 | |
| Week Change: 0.56% Year-to-date Change: 7.0% | |
| HAE Links: Profile News Message Board | |
| Charts:- Daily , Weekly | |
| Add HAE to Watchlist: View: Get Complete HAE Trend Analysis ➞ | |
 | ENS EnerSys |
| Sector: Industrials | |
| SubSector: Industrial Electrical Equipment | |
| MarketCap: 2068.79 Millions | |
| Recent Price: 91.79 Smart Investing & Trading Score: 25 | |
| Day Percent Change: 0.56% Day Change: 0.51 | |
| Week Change: 0.56% Year-to-date Change: -9.1% | |
| ENS Links: Profile News Message Board | |
| Charts:- Daily , Weekly | |
| Add ENS to Watchlist: View: Get Complete ENS Trend Analysis ➞ | |
 | PLUS ePlus inc. |
| Sector: Technology | |
| SubSector: Application Software | |
| MarketCap: 728.262 Millions | |
| Recent Price: 78.63 Smart Investing & Trading Score: 78 | |
| Day Percent Change: 0.56% Day Change: 0.44 | |
| Week Change: 0.56% Year-to-date Change: -1.5% | |
| PLUS Links: Profile News Message Board | |
| Charts:- Daily , Weekly | |
| Add PLUS to Watchlist: View: Get Complete PLUS Trend Analysis ➞ | |
 | POWL Powell Industries, Inc. |
| Sector: Industrials | |
| SubSector: Diversified Machinery | |
| MarketCap: 257.216 Millions | |
| Recent Price: 149.66 Smart Investing & Trading Score: 83 | |
| Day Percent Change: 0.56% Day Change: 0.84 | |
| Week Change: 0.56% Year-to-date Change: 69.3% | |
| POWL Links: Profile News Message Board | |
| Charts:- Daily , Weekly | |
| Add POWL to Watchlist: View: Get Complete POWL Trend Analysis ➞ | |
 | VC Visteon Corporation |
| Sector: Consumer Staples | |
| SubSector: Auto Parts | |
| MarketCap: 1441.49 Millions | |
| Recent Price: 112.81 Smart Investing & Trading Score: 74 | |
| Day Percent Change: 0.55% Day Change: 0.62 | |
| Week Change: 0.55% Year-to-date Change: -9.7% | |
| VC Links: Profile News Message Board | |
| Charts:- Daily , Weekly | |
| Add VC to Watchlist: View: Get Complete VC Trend Analysis ➞ | |
 | IBOC International Bancshares Corporation |
| Sector: Financials | |
| SubSector: Regional - Southwest Banks | |
| MarketCap: 1159.45 Millions | |
| Recent Price: 56.46 Smart Investing & Trading Score: 93 | |
| Day Percent Change: 0.55% Day Change: 0.31 | |
| Week Change: 0.55% Year-to-date Change: 3.9% | |
| IBOC Links: Profile News Message Board | |
| Charts:- Daily , Weekly | |
| Add IBOC to Watchlist: View: Get Complete IBOC Trend Analysis ➞ | |
 | DRH DiamondRock Hospitality Company |
| Sector: Financials | |
| SubSector: REIT - Hotel/Motel | |
| MarketCap: 964 Millions | |
| Recent Price: 9.10 Smart Investing & Trading Score: 15 | |
| Day Percent Change: 0.55% Day Change: 0.05 | |
| Week Change: 0.55% Year-to-date Change: -3.1% | |
| DRH Links: Profile News Message Board | |
| Charts:- Daily , Weekly | |
| Add DRH to Watchlist: View: Get Complete DRH Trend Analysis ➞ | |
| Too many stocks? View smallcap stocks filtered by marketcap & sector |
| Marketcap: All SmallCap Stocks (default-no microcap), Large, Mid-Range, Small & MicroCap |
| Sector: Tech, Finance, Energy, Staples, Retail, Industrial, Materials, Utilities & Medical |
|
Best Stocks Today 12Stocks.com |
© 2024 12Stocks.com Terms & Conditions Privacy Contact Us
All Information Provided Only For Education And Not To Be Used For Investing or Trading. See Terms & Conditions


One More Thing ... Get Best Stocks Delivered Daily!
Never Ever Miss A Move With Our Top Ten Stocks Lists
Find Best Stocks In Any Market - Bull or Bear Market
Take A Peek At Our Top Ten Stocks Lists: Daily, Weekly, Year-to-Date & Top Trends
Find Best Stocks In Any Market - Bull or Bear Market
Take A Peek At Our Top Ten Stocks Lists: Daily, Weekly, Year-to-Date & Top Trends
Smallcap Stocks With Best Up Trends [0-bearish to 100-bullish]: Bakkt [100], Deciphera [100], Phibro Animal[100], Heartland Financial[100], PTC [100], Sight Sciences[100], Richardson Electronics[100], Fulton Financial[100], TPI Composites[100], Cullinan Oncology[100], Lands [100]
Best Smallcap Stocks Year-to-Date:
CareMax [580.41%], Janux [421.92%], Bakkt [346.64%], Viking [305.75%], Longboard [247.46%], Alpine Immune[239.81%], Super Micro[213.22%], Avidity Biosciences[173.23%], Arcutis Bio[171.83%], Vera [167.31%], Cullinan Oncology[166.01%] Best Smallcap Stocks This Week:
Deciphera [72.56%], Phibro Animal[31.81%], Vaxxinity [31.65%], Zevia PBC[20.94%], Velo3D [19.97%], Acrivon [18.2%], Janux [18.18%], MultiPlan [15.53%], Heartland Financial[15.15%], Codexis [14.66%], Eyenovia [13.37%] Best Smallcap Stocks Daily:
Bakkt [2391.87%], Deciphera [72.56%], Phibro Animal[31.81%], Vaxxinity [31.65%], Zevia PBC[20.94%], Velo3D [19.97%], Acrivon [18.20%], Janux [18.18%], MultiPlan [15.53%], Heartland Financial[15.15%], Codexis [14.66%]