
 Login Sign Up


| |||||
 |  | ||||

| 12Stocks.com Market Intelligence |
Best SmallCap Stocks
|
| In a hurry? Small Cap Stock Lists: Performance Trends Table, Stock Charts
Sort Small Cap stocks: Daily, Weekly, Year-to-Date, Market Cap & Trends. Filter Small Cap stocks list by sector: Show all, Tech, Finance, Energy, Staples, Retail, Industrial, Materials, Utilities and HealthCare Filter Small Cap stocks list by size: All Large Medium Small and MicroCap |
| 12Stocks.com Small Cap Stocks Performances & Trends Daily | |||||||||
|
|  The overall Smart Investing & Trading Score is 88 (0-bearish to 100-bullish) which puts Small Cap index in short term bullish trend. The Smart Investing & Trading Score from previous trading session is 56 and hence an improvement of trend.
| ||||||||
Here are the Smart Investing & Trading Scores of the most requested small cap stocks at 12Stocks.com (click stock name for detailed review):
|


| 12Stocks.com: Investing in Smallcap Index with Stocks | |
|
The following table helps investors and traders sort through current performance and trends (as measured by Smart Investing & Trading Score) of various
stocks in the Smallcap Index. Quick View: Move mouse or cursor over stock symbol (ticker) to view short-term technical chart and over stock name to view long term chart. Click on  to add stock symbol to your watchlist and to add stock symbol to your watchlist and  to view watchlist. Click on any ticker or stock name for detailed market intelligence report for that stock. to view watchlist. Click on any ticker or stock name for detailed market intelligence report for that stock. |
12Stocks.com Performance of Stocks in Smallcap Index
| Ticker | Stock Name | Watchlist | Category | Recent Price | Smart Investing & Trading Score | Change % | Weekly Change% |
| ALRM | Alarm.com |   | Technology | 66.45 | 65 | 0.73% | 0.73% |
| NKTX | Nkarta | | Health Care | 6.92 | 17 | 0.73% | 0.73% |
| CIM | Chimera | | Financials | 4.22 | 69 | 0.72% | 0.72% |
| LCNB | LCNB | | Financials | 15.35 | 73 | 0.72% | 0.72% |
| AIN | Albany | | Industrials | 88.30 | 25 | 0.71% | 0.71% |
| MNKD | MannKind | | Health Care | 4.26 | 90 | 0.71% | 0.71% |
| PRM | Perimeter Solutions | | Materials | 7.11 | 68 | 0.71% | 0.71% |
| ASC | Ardmore Shipping | | Transports | 17.01 | 100 | 0.71% | 0.71% |
| VREX | Varex Imaging | | Health Care | 16.91 | 28 | 0.71% | 0.71% |
| KRYS | Krystal Biotech | | Health Care | 157.99 | 56 | 0.71% | 0.71% |
| VTS | Vitesse Energy | | Energy | 23.10 | 48 | 0.70% | 0.70% |
| TNC | Tennant | | Industrials | 116.44 | 55 | 0.70% | 0.70% |
| ZUO | Zuora | | Technology | 10.02 | 75 | 0.70% | 0.70% |
| AGTI | Agiliti | | Health Care | 10.12 | 75 | 0.70% | 0.70% |
| FG | F&G Annuities | | Financials | 39.30 | 64 | 0.69% | 0.69% |
| CMPX | Compass | | Health Care | 1.46 | 46 | 0.69% | 0.69% |
| CRK | Comstock Resources | | Energy | 10.39 | 95 | 0.68% | 0.68% |
| MMS | MAXIMUS | | Services & Goods | 80.98 | 70 | 0.68% | 0.68% |
| IMRX | Immuneering | | Health Care | 1.48 | 15 | 0.68% | 0.68% |
| GPMT | Granite Point | | Financials | 4.42 | 49 | 0.68% | 0.68% |
| ELA | Envela | | Services & Goods | 4.41 | 83 | 0.68% | 0.68% |
| GLT | P. H. | | Consumer Staples | 1.50 | 53 | 0.67% | 0.67% |
| NATH | Nathan s | | Services & Goods | 65.05 | 42 | 0.67% | 0.67% |
| FSBW | FS Bancorp | | Financials | 31.68 | 35 | 0.67% | 0.67% |
| ASTE | Astec Industries | | Industrials | 42.92 | 58 | 0.66% | 0.66% |


| Too many stocks? View smallcap stocks filtered by marketcap & sector |
| Marketcap: All SmallCap Stocks (default-no microcap), Large, Mid-Range, Small |
| Smallcap Sector: Tech, Finance, Energy, Staples, Retail, Industrial, Materials, & Medical |
|
Get the most comprehensive stock market coverage daily at 12Stocks.com ➞ Best Stocks Today ➞ Best Stocks Weekly ➞ Best Stocks Year-to-Date ➞ Best Stocks Trends ➞  Best Stocks Today 12Stocks.com Best Nasdaq Stocks ➞ Best S&P 500 Stocks ➞ Best Tech Stocks ➞ Best Biotech Stocks ➞ |
| Detailed Overview of SmallCap Stocks |
| SmallCap Technical Overview, Leaders & Laggards, Top SmallCap ETF Funds & Detailed SmallCap Stocks List, Charts, Trends & More |
| Smallcap: Technical Analysis, Trends & YTD Performance | |
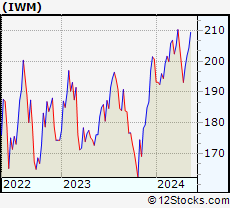
| SmallCap segment as represented by
IWM, an exchange-traded fund [ETF], holds basket of thousands of smallcap stocks from across all major sectors of the US stock market. The smallcap index (contains stocks like Riverbed & Sotheby's) is down by -0.37% and is currently underperforming the overall market by -6.93% year-to-date. Below is a quick view of technical charts and trends: | |
 IWM Weekly Chart |
|
| Long Term Trend: Very Good | |
| Medium Term Trend: Good | |
 IWM Daily Chart |
|
| Short Term Trend: Very Good | |
| Overall Trend Score: 88 | |
| YTD Performance: -0.37% | |
| **Trend Scores & Views Are Only For Educational Purposes And Not For Investing | |
| 12Stocks.com: Top Performing Small Cap Index Stocks | ||||||||||||||||||||||||||||||||||||||||||||||||
 The top performing Small Cap Index stocks year to date are
Now, more recently, over last week, the top performing Small Cap Index stocks on the move are


|
||||||||||||||||||||||||||||||||||||||||||||||||
| 12Stocks.com: Investing in Smallcap Index using Exchange Traded Funds | |
|
The following table shows list of key exchange traded funds (ETF) that
help investors track Smallcap index. The following list also includes leveraged ETF funds that track twice or thrice the daily returns of Smallcap indices. Short or inverse ETF funds move in the opposite direction to the index they track and are useful during market pullbacks or during bear markets. Quick View: Move mouse or cursor over ETF symbol (ticker) to view short-term technical chart and over ETF name to view long term chart. Click on ticker or stock name for detailed view. Click on to add stock symbol to your watchlist and to view watchlist. |
12Stocks.com List of ETFs that track Smallcap Index
| Ticker | ETF Name | Watchlist | Recent Price | Smart Investing & Trading Score | Change % | Week % | Year-to-date % |
| IWM | iShares Russell 2000 | | 199.96 | 88 | 0.79 | 0.79 | -0.37% |
| IJR | iShares Core S&P Small-Cap | | 106.41 | 93 | 0.72 | 0.72 | -1.7% |
| VTWO | Vanguard Russell 2000 ETF | | 80.78 | 88 | 0.70 | 0.7 | -0.39% |
| IWN | iShares Russell 2000 Value | | 152.05 | 93 | 0.60 | 0.6 | -2.11% |
| IWO | iShares Russell 2000 Growth | | 255.74 | 78 | 1.05 | 1.05 | 1.4% |
| IJS | iShares S&P Small-Cap 600 Value | | 97.95 | 70 | 0.78 | 0.78 | -4.97% |
| IJT | iShares S&P Small-Cap 600 Growth | | 126.96 | 88 | 0.69 | 0.69 | 1.45% |
| XSLV | PowerShares S&P SmallCap Low Volatil ETF | | 42.87 | 80 | 0.35 | 0.35 | -2.9% |
| SMLV | SPDR SSGA US Small Cap Low Volatil ETF | | 107.77 | 68 | 0.23 | 0.23 | -4.22% |
| SAA | ProShares Ultra SmallCap600 | | 23.27 | 88 | 1.00 | 1 | -6.73% |
| SBB | ProShares Short SmallCap600 | | 16.28 | 8 | -0.64 | -0.64 | 2.2% |
| SDD | ProShares UltraShort SmallCap600 | | 19.09 | 15 | -1.34 | -1.34 | 3.6% |
| 12Stocks.com: Charts, Trends, Fundamental Data and Performances of SmallCap Stocks | |
|
We now take in-depth look at all SmallCap stocks including charts, multi-period performances and overall trends (as measured by Smart Investing & Trading Score). One can sort SmallCap stocks (click link to choose) by Daily, Weekly and by Year-to-Date performances. Also, one can sort by size of the company or by market capitalization. |
| Select Your Default Chart Type: | |||||
| |||||
| Click on stock symbol or name for detailed view. Click on to add stock symbol to your watchlist and to view watchlist. Quick View: Move mouse or cursor over "Daily" to quickly view daily technical stock chart and over "Weekly" to view weekly technical stock chart. | |||||

 | ALRM Alarm.com Holdings, Inc. |
| Sector: Technology | |
| SubSector: Application Software | |
| MarketCap: 2035.62 Millions | |
| Recent Price: 66.45 Smart Investing & Trading Score: 65 | |
| Day Percent Change: 0.73% Day Change: 0.48 | |
| Week Change: 0.73% Year-to-date Change: 2.8% | |
| ALRM Links: Profile News Message Board | |
| Charts:- Daily , Weekly | |
| Add ALRM to Watchlist: View: Get Complete ALRM Trend Analysis ➞ | |
 | NKTX Nkarta, Inc. |
| Sector: Health Care | |
| SubSector: Biotechnology | |
| MarketCap: 23487 Millions | |
| Recent Price: 6.92 Smart Investing & Trading Score: 17 | |
| Day Percent Change: 0.73% Day Change: 0.05 | |
| Week Change: 0.73% Year-to-date Change: 4.9% | |
| NKTX Links: Profile News Message Board | |
| Charts:- Daily , Weekly | |
| Add NKTX to Watchlist: View: Get Complete NKTX Trend Analysis ➞ | |
 | CIM Chimera Investment Corporation |
| Sector: Financials | |
| SubSector: Mortgage Investment | |
| MarketCap: 2164.09 Millions | |
| Recent Price: 4.22 Smart Investing & Trading Score: 69 | |
| Day Percent Change: 0.72% Day Change: 0.03 | |
| Week Change: 0.72% Year-to-date Change: -15.4% | |
| CIM Links: Profile News Message Board | |
| Charts:- Daily , Weekly | |
| Add CIM to Watchlist: View: Get Complete CIM Trend Analysis ➞ | |
 | LCNB LCNB Corp. |
| Sector: Financials | |
| SubSector: Regional - Mid-Atlantic Banks | |
| MarketCap: 176.759 Millions | |
| Recent Price: 15.35 Smart Investing & Trading Score: 73 | |
| Day Percent Change: 0.72% Day Change: 0.11 | |
| Week Change: 0.72% Year-to-date Change: -2.7% | |
| LCNB Links: Profile News Message Board | |
| Charts:- Daily , Weekly | |
| Add LCNB to Watchlist: View: Get Complete LCNB Trend Analysis ➞ | |
 | AIN Albany International Corp. |
| Sector: Industrials | |
| SubSector: Textile Industrial | |
| MarketCap: 1538.4 Millions | |
| Recent Price: 88.30 Smart Investing & Trading Score: 25 | |
| Day Percent Change: 0.71% Day Change: 0.62 | |
| Week Change: 0.71% Year-to-date Change: -10.1% | |
| AIN Links: Profile News Message Board | |
| Charts:- Daily , Weekly | |
| Add AIN to Watchlist: View: Get Complete AIN Trend Analysis ➞ | |
 | MNKD MannKind Corporation |
| Sector: Health Care | |
| SubSector: Biotechnology | |
| MarketCap: 250.885 Millions | |
| Recent Price: 4.26 Smart Investing & Trading Score: 90 | |
| Day Percent Change: 0.71% Day Change: 0.03 | |
| Week Change: 0.71% Year-to-date Change: 17.0% | |
| MNKD Links: Profile News Message Board | |
| Charts:- Daily , Weekly | |
| Add MNKD to Watchlist: View: Get Complete MNKD Trend Analysis ➞ | |
 | PRM Perimeter Solutions, SA |
| Sector: Materials | |
| SubSector: Specialty Chemicals | |
| MarketCap: 930 Millions | |
| Recent Price: 7.11 Smart Investing & Trading Score: 68 | |
| Day Percent Change: 0.71% Day Change: 0.05 | |
| Week Change: 0.71% Year-to-date Change: 54.7% | |
| PRM Links: Profile News Message Board | |
| Charts:- Daily , Weekly | |
| Add PRM to Watchlist: View: Get Complete PRM Trend Analysis ➞ | |
 | ASC Ardmore Shipping Corporation |
| Sector: Transports | |
| SubSector: Shipping | |
| MarketCap: 147.014 Millions | |
| Recent Price: 17.01 Smart Investing & Trading Score: 100 | |
| Day Percent Change: 0.71% Day Change: 0.12 | |
| Week Change: 0.71% Year-to-date Change: 20.7% | |
| ASC Links: Profile News Message Board | |
| Charts:- Daily , Weekly | |
| Add ASC to Watchlist: View: Get Complete ASC Trend Analysis ➞ | |
 | VREX Varex Imaging Corporation |
| Sector: Health Care | |
| SubSector: Medical Appliances & Equipment | |
| MarketCap: 718.78 Millions | |
| Recent Price: 16.91 Smart Investing & Trading Score: 28 | |
| Day Percent Change: 0.71% Day Change: 0.12 | |
| Week Change: 0.71% Year-to-date Change: -17.5% | |
| VREX Links: Profile News Message Board | |
| Charts:- Daily , Weekly | |
| Add VREX to Watchlist: View: Get Complete VREX Trend Analysis ➞ | |
 | KRYS Krystal Biotech, Inc. |
| Sector: Health Care | |
| SubSector: Biotechnology | |
| MarketCap: 874.085 Millions | |
| Recent Price: 157.99 Smart Investing & Trading Score: 56 | |
| Day Percent Change: 0.71% Day Change: 1.11 | |
| Week Change: 0.71% Year-to-date Change: 27.4% | |
| KRYS Links: Profile News Message Board | |
| Charts:- Daily , Weekly | |
| Add KRYS to Watchlist: View: Get Complete KRYS Trend Analysis ➞ | |
 | VTS Vitesse Energy, Inc. |
| Sector: Energy | |
| SubSector: Oil & Gas E&P | |
| MarketCap: 639 Millions | |
| Recent Price: 23.10 Smart Investing & Trading Score: 48 | |
| Day Percent Change: 0.70% Day Change: 0.16 | |
| Week Change: 0.7% Year-to-date Change: 4.3% | |
| VTS Links: Profile News Message Board | |
| Charts:- Daily , Weekly | |
| Add VTS to Watchlist: View: Get Complete VTS Trend Analysis ➞ | |
 | TNC Tennant Company |
| Sector: Industrials | |
| SubSector: Diversified Machinery | |
| MarketCap: 1097.96 Millions | |
| Recent Price: 116.44 Smart Investing & Trading Score: 55 | |
| Day Percent Change: 0.70% Day Change: 0.81 | |
| Week Change: 0.7% Year-to-date Change: 25.6% | |
| TNC Links: Profile News Message Board | |
| Charts:- Daily , Weekly | |
| Add TNC to Watchlist: View: Get Complete TNC Trend Analysis ➞ | |
 | ZUO Zuora, Inc. |
| Sector: Technology | |
| SubSector: Application Software | |
| MarketCap: 1063.22 Millions | |
| Recent Price: 10.02 Smart Investing & Trading Score: 75 | |
| Day Percent Change: 0.70% Day Change: 0.07 | |
| Week Change: 0.7% Year-to-date Change: 6.6% | |
| ZUO Links: Profile News Message Board | |
| Charts:- Daily , Weekly | |
| Add ZUO to Watchlist: View: Get Complete ZUO Trend Analysis ➞ | |
 | AGTI Agiliti, Inc. |
| Sector: Health Care | |
| SubSector: Health Information Services | |
| MarketCap: 2270 Millions | |
| Recent Price: 10.12 Smart Investing & Trading Score: 75 | |
| Day Percent Change: 0.70% Day Change: 0.07 | |
| Week Change: 0.7% Year-to-date Change: 28.4% | |
| AGTI Links: Profile News Message Board | |
| Charts:- Daily , Weekly | |
| Add AGTI to Watchlist: View: Get Complete AGTI Trend Analysis ➞ | |
 | FG F&G Annuities & Life, Inc. |
| Sector: Financials | |
| SubSector: Insurance - Life | |
| MarketCap: 2960 Millions | |
| Recent Price: 39.30 Smart Investing & Trading Score: 64 | |
| Day Percent Change: 0.69% Day Change: 0.27 | |
| Week Change: 0.69% Year-to-date Change: -14.8% | |
| FG Links: Profile News Message Board | |
| Charts:- Daily , Weekly | |
| Add FG to Watchlist: View: Get Complete FG Trend Analysis ➞ | |
 | CMPX Compass Therapeutics, Inc. |
| Sector: Health Care | |
| SubSector: Biotechnology | |
| MarketCap: 406 Millions | |
| Recent Price: 1.46 Smart Investing & Trading Score: 46 | |
| Day Percent Change: 0.69% Day Change: 0.01 | |
| Week Change: 0.69% Year-to-date Change: -4.9% | |
| CMPX Links: Profile News Message Board | |
| Charts:- Daily , Weekly | |
| Add CMPX to Watchlist: View: Get Complete CMPX Trend Analysis ➞ | |
 | CRK Comstock Resources, Inc. |
| Sector: Energy | |
| SubSector: Independent Oil & Gas | |
| MarketCap: 959.793 Millions | |
| Recent Price: 10.39 Smart Investing & Trading Score: 95 | |
| Day Percent Change: 0.68% Day Change: 0.07 | |
| Week Change: 0.68% Year-to-date Change: 17.4% | |
| CRK Links: Profile News Message Board | |
| Charts:- Daily , Weekly | |
| Add CRK to Watchlist: View: Get Complete CRK Trend Analysis ➞ | |
 | MMS MAXIMUS, Inc. |
| Sector: Services & Goods | |
| SubSector: Business Services | |
| MarketCap: 3833.02 Millions | |
| Recent Price: 80.98 Smart Investing & Trading Score: 70 | |
| Day Percent Change: 0.68% Day Change: 0.55 | |
| Week Change: 0.68% Year-to-date Change: -3.4% | |
| MMS Links: Profile News Message Board | |
| Charts:- Daily , Weekly | |
| Add MMS to Watchlist: View: Get Complete MMS Trend Analysis ➞ | |
 | IMRX Immuneering Corporation |
| Sector: Health Care | |
| SubSector: Biotechnology | |
| MarketCap: 303 Millions | |
| Recent Price: 1.48 Smart Investing & Trading Score: 15 | |
| Day Percent Change: 0.68% Day Change: 0.01 | |
| Week Change: 0.68% Year-to-date Change: -80.5% | |
| IMRX Links: Profile News Message Board | |
| Charts:- Daily , Weekly | |
| Add IMRX to Watchlist: View: Get Complete IMRX Trend Analysis ➞ | |
 | GPMT Granite Point Mortgage Trust Inc. |
| Sector: Financials | |
| SubSector: Mortgage Investment | |
| MarketCap: 289.739 Millions | |
| Recent Price: 4.42 Smart Investing & Trading Score: 49 | |
| Day Percent Change: 0.68% Day Change: 0.03 | |
| Week Change: 0.68% Year-to-date Change: -25.6% | |
| GPMT Links: Profile News Message Board | |
| Charts:- Daily , Weekly | |
| Add GPMT to Watchlist: View: Get Complete GPMT Trend Analysis ➞ | |
 | ELA Envela Corporation |
| Sector: Services & Goods | |
| SubSector: Specialty Retail, Other | |
| MarketCap: 73.5944 Millions | |
| Recent Price: 4.41 Smart Investing & Trading Score: 83 | |
| Day Percent Change: 0.68% Day Change: 0.03 | |
| Week Change: 0.68% Year-to-date Change: -9.3% | |
| ELA Links: Profile News Message Board | |
| Charts:- Daily , Weekly | |
| Add ELA to Watchlist: View: Get Complete ELA Trend Analysis ➞ | |
 | GLT P. H. Glatfelter Company |
| Sector: Consumer Staples | |
| SubSector: Paper & Paper Products | |
| MarketCap: 525.003 Millions | |
| Recent Price: 1.50 Smart Investing & Trading Score: 53 | |
| Day Percent Change: 0.67% Day Change: 0.01 | |
| Week Change: 0.67% Year-to-date Change: -22.7% | |
| GLT Links: Profile News Message Board | |
| Charts:- Daily , Weekly | |
| Add GLT to Watchlist: View: Get Complete GLT Trend Analysis ➞ | |
 | NATH Nathan s Famous, Inc. |
| Sector: Services & Goods | |
| SubSector: Restaurants | |
| MarketCap: 211.77 Millions | |
| Recent Price: 65.05 Smart Investing & Trading Score: 42 | |
| Day Percent Change: 0.67% Day Change: 0.43 | |
| Week Change: 0.67% Year-to-date Change: -16.6% | |
| NATH Links: Profile News Message Board | |
| Charts:- Daily , Weekly | |
| Add NATH to Watchlist: View: Get Complete NATH Trend Analysis ➞ | |
 | FSBW FS Bancorp, Inc. |
| Sector: Financials | |
| SubSector: Regional - Pacific Banks | |
| MarketCap: 140.429 Millions | |
| Recent Price: 31.68 Smart Investing & Trading Score: 35 | |
| Day Percent Change: 0.67% Day Change: 0.21 | |
| Week Change: 0.67% Year-to-date Change: -14.3% | |
| FSBW Links: Profile News Message Board | |
| Charts:- Daily , Weekly | |
| Add FSBW to Watchlist: View: Get Complete FSBW Trend Analysis ➞ | |
 | ASTE Astec Industries, Inc. |
| Sector: Industrials | |
| SubSector: Farm & Construction Machinery | |
| MarketCap: 731.607 Millions | |
| Recent Price: 42.92 Smart Investing & Trading Score: 58 | |
| Day Percent Change: 0.66% Day Change: 0.28 | |
| Week Change: 0.66% Year-to-date Change: 15.4% | |
| ASTE Links: Profile News Message Board | |
| Charts:- Daily , Weekly | |
| Add ASTE to Watchlist: View: Get Complete ASTE Trend Analysis ➞ | |
| Too many stocks? View smallcap stocks filtered by marketcap & sector |
| Marketcap: All SmallCap Stocks (default-no microcap), Large, Mid-Range, Small & MicroCap |
| Sector: Tech, Finance, Energy, Staples, Retail, Industrial, Materials, Utilities & Medical |
|
Best Stocks Today 12Stocks.com |
© 2024 12Stocks.com Terms & Conditions Privacy Contact Us
All Information Provided Only For Education And Not To Be Used For Investing or Trading. See Terms & Conditions


One More Thing ... Get Best Stocks Delivered Daily!
Never Ever Miss A Move With Our Top Ten Stocks Lists
Find Best Stocks In Any Market - Bull or Bear Market
Take A Peek At Our Top Ten Stocks Lists: Daily, Weekly, Year-to-Date & Top Trends
Find Best Stocks In Any Market - Bull or Bear Market
Take A Peek At Our Top Ten Stocks Lists: Daily, Weekly, Year-to-Date & Top Trends
Smallcap Stocks With Best Up Trends [0-bearish to 100-bullish]: Bakkt [100], Deciphera [100], Phibro Animal[100], Heartland Financial[100], PTC [100], Sight Sciences[100], Richardson Electronics[100], Fulton Financial[100], TPI Composites[100], Cullinan Oncology[100], Lands [100]
Best Smallcap Stocks Year-to-Date:
CareMax [580.41%], Janux [421.92%], Bakkt [346.64%], Viking [305.75%], Longboard [247.46%], Alpine Immune[239.81%], Super Micro[213.22%], Avidity Biosciences[173.23%], Arcutis Bio[171.83%], Vera [167.31%], Cullinan Oncology[166.01%] Best Smallcap Stocks This Week:
Deciphera [72.56%], Phibro Animal[31.81%], Vaxxinity [31.65%], Zevia PBC[20.94%], Velo3D [19.97%], Acrivon [18.2%], Janux [18.18%], MultiPlan [15.53%], Heartland Financial[15.15%], Codexis [14.66%], Eyenovia [13.37%] Best Smallcap Stocks Daily:
Bakkt [2391.87%], Deciphera [72.56%], Phibro Animal[31.81%], Vaxxinity [31.65%], Zevia PBC[20.94%], Velo3D [19.97%], Acrivon [18.20%], Janux [18.18%], MultiPlan [15.53%], Heartland Financial[15.15%], Codexis [14.66%]