
 Login Sign Up


| |||||
 |  | ||||

| 12Stocks.com Market Intelligence |
Best SmallCap Stocks
|
| In a hurry? Small Cap Stock Lists: Performance Trends Table, Stock Charts
Sort Small Cap stocks: Daily, Weekly, Year-to-Date, Market Cap & Trends. Filter Small Cap stocks list by sector: Show all, Tech, Finance, Energy, Staples, Retail, Industrial, Materials, Utilities and HealthCare Filter Small Cap stocks list by size: All Large Medium Small and MicroCap |
| 12Stocks.com Small Cap Stocks Performances & Trends Daily | |||||||||
|
|  The overall Smart Investing & Trading Score is 88 (0-bearish to 100-bullish) which puts Small Cap index in short term bullish trend. The Smart Investing & Trading Score from previous trading session is 56 and hence an improvement of trend.
| ||||||||
Here are the Smart Investing & Trading Scores of the most requested small cap stocks at 12Stocks.com (click stock name for detailed review):
|


| 12Stocks.com: Investing in Smallcap Index with Stocks | |
|
The following table helps investors and traders sort through current performance and trends (as measured by Smart Investing & Trading Score) of various
stocks in the Smallcap Index. Quick View: Move mouse or cursor over stock symbol (ticker) to view short-term technical chart and over stock name to view long term chart. Click on  to add stock symbol to your watchlist and to add stock symbol to your watchlist and  to view watchlist. Click on any ticker or stock name for detailed market intelligence report for that stock. to view watchlist. Click on any ticker or stock name for detailed market intelligence report for that stock. |
12Stocks.com Performance of Stocks in Smallcap Index
| Ticker | Stock Name | Watchlist | Category | Recent Price | Smart Investing & Trading Score | Change % | Weekly Change% |
| CCSI | Consensus Cloud |   | Technology | 12.50 | 27 | 1.87% | 1.87% |
| CNO | CNO Financial | | Financials | 26.89 | 57 | 1.86% | 1.86% |
| BOOT | Boot Barn | | Services & Goods | 109.79 | 100 | 1.86% | 1.86% |
| ACCO | ACCO Brands | | Consumer Staples | 4.92 | 35 | 1.86% | 1.86% |
| SLQT | SelectQuote | | Financials | 1.64 | 63 | 1.86% | 1.86% |
| CEVA | CEVA | | Technology | 20.35 | 85 | 1.85% | 1.85% |
| PHAT | Phathom | | Health Care | 9.35 | 63 | 1.85% | 1.85% |
| RMAX | RE/MAX | | Financials | 7.19 | 37 | 1.84% | 1.84% |
| MTX | Minerals | | Materials | 75.05 | 100 | 1.83% | 1.83% |
| INVA | Innoviva | | Health Care | 15.54 | 49 | 1.83% | 1.83% |
| ABUS | Arbutus Biopharma | | Health Care | 2.78 | 75 | 1.83% | 1.83% |
| KRMD | Repro Med | | Health Care | 2.23 | 95 | 1.83% | 1.83% |
| CTS | CTS | | Technology | 47.00 | 100 | 1.82% | 1.82% |
| SCS | Steelcase | | Consumer Staples | 12.29 | 57 | 1.82% | 1.82% |
| DIOD | Diodes | | Technology | 74.00 | 100 | 1.82% | 1.82% |
| QSI | Quantum-Si | | Health Care | 1.68 | 88 | 1.82% | 1.82% |
| SKYW | SkyWest | | Transports | 74.99 | 93 | 1.81% | 1.81% |
| PBH | Prestige Consumer | | Health Care | 71.74 | 90 | 1.80% | 1.80% |
| AEO | American Eagle | | Services & Goods | 24.83 | 95 | 1.80% | 1.80% |
| TRNO | Terreno Realty | | Financials | 55.10 | 17 | 1.79% | 1.79% |
| MGNX | MacroGenics | | Health Care | 14.82 | 41 | 1.79% | 1.79% |
| ASAN | Asana | | Technology | 15.35 | 64 | 1.79% | 1.79% |
| LANC | Lancaster Colony | | Consumer Staples | 190.35 | 58 | 1.78% | 1.78% |
| SRCE | 1st Source | | Financials | 50.20 | 52 | 1.78% | 1.78% |
| MMSI | Merit Medical | | Health Care | 75.09 | 62 | 1.78% | 1.78% |


| Too many stocks? View smallcap stocks filtered by marketcap & sector |
| Marketcap: All SmallCap Stocks (default-no microcap), Large, Mid-Range, Small |
| Smallcap Sector: Tech, Finance, Energy, Staples, Retail, Industrial, Materials, & Medical |
|
Get the most comprehensive stock market coverage daily at 12Stocks.com ➞ Best Stocks Today ➞ Best Stocks Weekly ➞ Best Stocks Year-to-Date ➞ Best Stocks Trends ➞  Best Stocks Today 12Stocks.com Best Nasdaq Stocks ➞ Best S&P 500 Stocks ➞ Best Tech Stocks ➞ Best Biotech Stocks ➞ |
| Detailed Overview of SmallCap Stocks |
| SmallCap Technical Overview, Leaders & Laggards, Top SmallCap ETF Funds & Detailed SmallCap Stocks List, Charts, Trends & More |
| Smallcap: Technical Analysis, Trends & YTD Performance | |
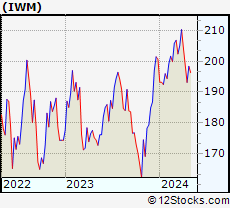
| SmallCap segment as represented by
IWM, an exchange-traded fund [ETF], holds basket of thousands of smallcap stocks from across all major sectors of the US stock market. The smallcap index (contains stocks like Riverbed & Sotheby's) is down by -0.37% and is currently underperforming the overall market by -6.93% year-to-date. Below is a quick view of technical charts and trends: | |
 IWM Weekly Chart |
|
| Long Term Trend: Very Good | |
| Medium Term Trend: Good | |
 IWM Daily Chart |
|
| Short Term Trend: Very Good | |
| Overall Trend Score: 88 | |
| YTD Performance: -0.37% | |
| **Trend Scores & Views Are Only For Educational Purposes And Not For Investing | |
| 12Stocks.com: Top Performing Small Cap Index Stocks | ||||||||||||||||||||||||||||||||||||||||||||||||
 The top performing Small Cap Index stocks year to date are
Now, more recently, over last week, the top performing Small Cap Index stocks on the move are


|
||||||||||||||||||||||||||||||||||||||||||||||||
| 12Stocks.com: Investing in Smallcap Index using Exchange Traded Funds | |
|
The following table shows list of key exchange traded funds (ETF) that
help investors track Smallcap index. The following list also includes leveraged ETF funds that track twice or thrice the daily returns of Smallcap indices. Short or inverse ETF funds move in the opposite direction to the index they track and are useful during market pullbacks or during bear markets. Quick View: Move mouse or cursor over ETF symbol (ticker) to view short-term technical chart and over ETF name to view long term chart. Click on ticker or stock name for detailed view. Click on to add stock symbol to your watchlist and to view watchlist. |
12Stocks.com List of ETFs that track Smallcap Index
| Ticker | ETF Name | Watchlist | Recent Price | Smart Investing & Trading Score | Change % | Week % | Year-to-date % |
| IWM | iShares Russell 2000 | | 199.96 | 88 | 0.79 | 0.79 | -0.37% |
| IJR | iShares Core S&P Small-Cap | | 106.41 | 93 | 0.72 | 0.72 | -1.7% |
| VTWO | Vanguard Russell 2000 ETF | | 80.78 | 88 | 0.70 | 0.7 | -0.39% |
| IWN | iShares Russell 2000 Value | | 152.05 | 93 | 0.60 | 0.6 | -2.11% |
| IWO | iShares Russell 2000 Growth | | 255.74 | 78 | 1.05 | 1.05 | 1.4% |
| IJS | iShares S&P Small-Cap 600 Value | | 97.95 | 70 | 0.78 | 0.78 | -4.97% |
| IJT | iShares S&P Small-Cap 600 Growth | | 126.96 | 88 | 0.69 | 0.69 | 1.45% |
| XSLV | PowerShares S&P SmallCap Low Volatil ETF | | 42.87 | 80 | 0.35 | 0.35 | -2.9% |
| SMLV | SPDR SSGA US Small Cap Low Volatil ETF | | 107.77 | 68 | 0.23 | 0.23 | -4.22% |
| SAA | ProShares Ultra SmallCap600 | | 23.27 | 88 | 1.00 | 1 | -6.73% |
| SBB | ProShares Short SmallCap600 | | 16.28 | 8 | -0.64 | -0.64 | 2.2% |
| SDD | ProShares UltraShort SmallCap600 | | 19.09 | 15 | -1.34 | -1.34 | 3.6% |
| 12Stocks.com: Charts, Trends, Fundamental Data and Performances of SmallCap Stocks | |
|
We now take in-depth look at all SmallCap stocks including charts, multi-period performances and overall trends (as measured by Smart Investing & Trading Score). One can sort SmallCap stocks (click link to choose) by Daily, Weekly and by Year-to-Date performances. Also, one can sort by size of the company or by market capitalization. |
| Select Your Default Chart Type: | |||||
| |||||
| Click on stock symbol or name for detailed view. Click on to add stock symbol to your watchlist and to view watchlist. Quick View: Move mouse or cursor over "Daily" to quickly view daily technical stock chart and over "Weekly" to view weekly technical stock chart. | |||||

 | CCSI Consensus Cloud Solutions, Inc. |
| Sector: Technology | |
| SubSector: Software - Infrastructure | |
| MarketCap: 609 Millions | |
| Recent Price: 12.50 Smart Investing & Trading Score: 27 | |
| Day Percent Change: 1.87% Day Change: 0.23 | |
| Week Change: 1.87% Year-to-date Change: -53.1% | |
| CCSI Links: Profile News Message Board | |
| Charts:- Daily , Weekly | |
| Add CCSI to Watchlist: View: Get Complete CCSI Trend Analysis ➞ | |
 | CNO CNO Financial Group, Inc. |
| Sector: Financials | |
| SubSector: Accident & Health Insurance | |
| MarketCap: 1746.9 Millions | |
| Recent Price: 26.89 Smart Investing & Trading Score: 57 | |
| Day Percent Change: 1.86% Day Change: 0.49 | |
| Week Change: 1.86% Year-to-date Change: -3.6% | |
| CNO Links: Profile News Message Board | |
| Charts:- Daily , Weekly | |
| Add CNO to Watchlist: View: Get Complete CNO Trend Analysis ➞ | |
 | BOOT Boot Barn Holdings, Inc. |
| Sector: Services & Goods | |
| SubSector: Apparel Stores | |
| MarketCap: 360.608 Millions | |
| Recent Price: 109.79 Smart Investing & Trading Score: 100 | |
| Day Percent Change: 1.86% Day Change: 2.00 | |
| Week Change: 1.86% Year-to-date Change: 43.0% | |
| BOOT Links: Profile News Message Board | |
| Charts:- Daily , Weekly | |
| Add BOOT to Watchlist: View: Get Complete BOOT Trend Analysis ➞ | |
 | ACCO ACCO Brands Corporation |
| Sector: Consumer Staples | |
| SubSector: Office Supplies | |
| MarketCap: 448.2 Millions | |
| Recent Price: 4.92 Smart Investing & Trading Score: 35 | |
| Day Percent Change: 1.86% Day Change: 0.09 | |
| Week Change: 1.86% Year-to-date Change: -19.1% | |
| ACCO Links: Profile News Message Board | |
| Charts:- Daily , Weekly | |
| Add ACCO to Watchlist: View: Get Complete ACCO Trend Analysis ➞ | |
 | SLQT SelectQuote, Inc. |
| Sector: Financials | |
| SubSector: Insurance Brokers | |
| MarketCap: 38257 Millions | |
| Recent Price: 1.64 Smart Investing & Trading Score: 63 | |
| Day Percent Change: 1.86% Day Change: 0.03 | |
| Week Change: 1.86% Year-to-date Change: 19.7% | |
| SLQT Links: Profile News Message Board | |
| Charts:- Daily , Weekly | |
| Add SLQT to Watchlist: View: Get Complete SLQT Trend Analysis ➞ | |
 | CEVA CEVA, Inc. |
| Sector: Technology | |
| SubSector: Semiconductor - Specialized | |
| MarketCap: 587.06 Millions | |
| Recent Price: 20.35 Smart Investing & Trading Score: 85 | |
| Day Percent Change: 1.85% Day Change: 0.37 | |
| Week Change: 1.85% Year-to-date Change: -10.4% | |
| CEVA Links: Profile News Message Board | |
| Charts:- Daily , Weekly | |
| Add CEVA to Watchlist: View: Get Complete CEVA Trend Analysis ➞ | |
 | PHAT Phathom Pharmaceuticals, Inc. |
| Sector: Health Care | |
| SubSector: Biotechnology | |
| MarketCap: 728.785 Millions | |
| Recent Price: 9.35 Smart Investing & Trading Score: 63 | |
| Day Percent Change: 1.85% Day Change: 0.17 | |
| Week Change: 1.85% Year-to-date Change: 2.4% | |
| PHAT Links: Profile News Message Board | |
| Charts:- Daily , Weekly | |
| Add PHAT to Watchlist: View: Get Complete PHAT Trend Analysis ➞ | |
 | RMAX RE/MAX Holdings, Inc. |
| Sector: Financials | |
| SubSector: Property Management | |
| MarketCap: 334.742 Millions | |
| Recent Price: 7.19 Smart Investing & Trading Score: 37 | |
| Day Percent Change: 1.84% Day Change: 0.13 | |
| Week Change: 1.84% Year-to-date Change: -46.1% | |
| RMAX Links: Profile News Message Board | |
| Charts:- Daily , Weekly | |
| Add RMAX to Watchlist: View: Get Complete RMAX Trend Analysis ➞ | |
 | MTX Minerals Technologies Inc. |
| Sector: Materials | |
| SubSector: Chemicals - Major Diversified | |
| MarketCap: 1155.36 Millions | |
| Recent Price: 75.05 Smart Investing & Trading Score: 100 | |
| Day Percent Change: 1.83% Day Change: 1.35 | |
| Week Change: 1.83% Year-to-date Change: 5.2% | |
| MTX Links: Profile News Message Board | |
| Charts:- Daily , Weekly | |
| Add MTX to Watchlist: View: Get Complete MTX Trend Analysis ➞ | |
 | INVA Innoviva, Inc. |
| Sector: Health Care | |
| SubSector: Biotechnology | |
| MarketCap: 1023.15 Millions | |
| Recent Price: 15.54 Smart Investing & Trading Score: 49 | |
| Day Percent Change: 1.83% Day Change: 0.28 | |
| Week Change: 1.83% Year-to-date Change: -3.1% | |
| INVA Links: Profile News Message Board | |
| Charts:- Daily , Weekly | |
| Add INVA to Watchlist: View: Get Complete INVA Trend Analysis ➞ | |
 | ABUS Arbutus Biopharma Corporation |
| Sector: Health Care | |
| SubSector: Biotechnology | |
| MarketCap: 110.885 Millions | |
| Recent Price: 2.78 Smart Investing & Trading Score: 75 | |
| Day Percent Change: 1.83% Day Change: 0.05 | |
| Week Change: 1.83% Year-to-date Change: 11.2% | |
| ABUS Links: Profile News Message Board | |
| Charts:- Daily , Weekly | |
| Add ABUS to Watchlist: View: Get Complete ABUS Trend Analysis ➞ | |
 | KRMD Repro Med Systems, Inc. |
| Sector: Health Care | |
| SubSector: Medical Instruments & Supplies | |
| MarketCap: 340.06 Millions | |
| Recent Price: 2.23 Smart Investing & Trading Score: 95 | |
| Day Percent Change: 1.83% Day Change: 0.04 | |
| Week Change: 1.83% Year-to-date Change: -9.2% | |
| KRMD Links: Profile News Message Board | |
| Charts:- Daily , Weekly | |
| Add KRMD to Watchlist: View: Get Complete KRMD Trend Analysis ➞ | |
 | CTS CTS Corporation |
| Sector: Technology | |
| SubSector: Diversified Electronics | |
| MarketCap: 645.896 Millions | |
| Recent Price: 47.00 Smart Investing & Trading Score: 100 | |
| Day Percent Change: 1.82% Day Change: 0.84 | |
| Week Change: 1.82% Year-to-date Change: 7.5% | |
| CTS Links: Profile News Message Board | |
| Charts:- Daily , Weekly | |
| Add CTS to Watchlist: View: Get Complete CTS Trend Analysis ➞ | |
 | SCS Steelcase Inc. |
| Sector: Consumer Staples | |
| SubSector: Business Equipment | |
| MarketCap: 1310.77 Millions | |
| Recent Price: 12.29 Smart Investing & Trading Score: 57 | |
| Day Percent Change: 1.82% Day Change: 0.22 | |
| Week Change: 1.82% Year-to-date Change: -9.1% | |
| SCS Links: Profile News Message Board | |
| Charts:- Daily , Weekly | |
| Add SCS to Watchlist: View: Get Complete SCS Trend Analysis ➞ | |
 | DIOD Diodes Incorporated |
| Sector: Technology | |
| SubSector: Semiconductor - Integrated Circuits | |
| MarketCap: 1967.6 Millions | |
| Recent Price: 74.00 Smart Investing & Trading Score: 100 | |
| Day Percent Change: 1.82% Day Change: 1.32 | |
| Week Change: 1.82% Year-to-date Change: -8.1% | |
| DIOD Links: Profile News Message Board | |
| Charts:- Daily , Weekly | |
| Add DIOD to Watchlist: View: Get Complete DIOD Trend Analysis ➞ | |
 | QSI Quantum-Si incorporated |
| Sector: Health Care | |
| SubSector: Biotechnology | |
| MarketCap: 256 Millions | |
| Recent Price: 1.68 Smart Investing & Trading Score: 88 | |
| Day Percent Change: 1.82% Day Change: 0.03 | |
| Week Change: 1.82% Year-to-date Change: -16.4% | |
| QSI Links: Profile News Message Board | |
| Charts:- Daily , Weekly | |
| Add QSI to Watchlist: View: Get Complete QSI Trend Analysis ➞ | |
 | SKYW SkyWest, Inc. |
| Sector: Transports | |
| SubSector: Regional Airlines | |
| MarketCap: 1394.7 Millions | |
| Recent Price: 74.99 Smart Investing & Trading Score: 93 | |
| Day Percent Change: 1.81% Day Change: 1.33 | |
| Week Change: 1.81% Year-to-date Change: 43.7% | |
| SKYW Links: Profile News Message Board | |
| Charts:- Daily , Weekly | |
| Add SKYW to Watchlist: View: Get Complete SKYW Trend Analysis ➞ | |
 | PBH Prestige Consumer Healthcare Inc. |
| Sector: Health Care | |
| SubSector: Medical Appliances & Equipment | |
| MarketCap: 1639.6 Millions | |
| Recent Price: 71.74 Smart Investing & Trading Score: 90 | |
| Day Percent Change: 1.80% Day Change: 1.27 | |
| Week Change: 1.8% Year-to-date Change: 17.2% | |
| PBH Links: Profile News Message Board | |
| Charts:- Daily , Weekly | |
| Add PBH to Watchlist: View: Get Complete PBH Trend Analysis ➞ | |
 | AEO American Eagle Outfitters, Inc. |
| Sector: Services & Goods | |
| SubSector: Apparel Stores | |
| MarketCap: 1577.08 Millions | |
| Recent Price: 24.83 Smart Investing & Trading Score: 95 | |
| Day Percent Change: 1.80% Day Change: 0.44 | |
| Week Change: 1.8% Year-to-date Change: 17.3% | |
| AEO Links: Profile News Message Board | |
| Charts:- Daily , Weekly | |
| Add AEO to Watchlist: View: Get Complete AEO Trend Analysis ➞ | |
 | TRNO Terreno Realty Corporation |
| Sector: Financials | |
| SubSector: REIT - Industrial | |
| MarketCap: 3359.69 Millions | |
| Recent Price: 55.10 Smart Investing & Trading Score: 17 | |
| Day Percent Change: 1.79% Day Change: 0.97 | |
| Week Change: 1.79% Year-to-date Change: -12.1% | |
| TRNO Links: Profile News Message Board | |
| Charts:- Daily , Weekly | |
| Add TRNO to Watchlist: View: Get Complete TRNO Trend Analysis ➞ | |
 | MGNX MacroGenics, Inc. |
| Sector: Health Care | |
| SubSector: Biotechnology | |
| MarketCap: 262.785 Millions | |
| Recent Price: 14.82 Smart Investing & Trading Score: 41 | |
| Day Percent Change: 1.79% Day Change: 0.26 | |
| Week Change: 1.79% Year-to-date Change: 54.1% | |
| MGNX Links: Profile News Message Board | |
| Charts:- Daily , Weekly | |
| Add MGNX to Watchlist: View: Get Complete MGNX Trend Analysis ➞ | |
 | ASAN Asana, Inc. |
| Sector: Technology | |
| SubSector: Software Application | |
| MarketCap: 45087 Millions | |
| Recent Price: 15.35 Smart Investing & Trading Score: 64 | |
| Day Percent Change: 1.79% Day Change: 0.27 | |
| Week Change: 1.79% Year-to-date Change: -19.3% | |
| ASAN Links: Profile News Message Board | |
| Charts:- Daily , Weekly | |
| Add ASAN to Watchlist: View: Get Complete ASAN Trend Analysis ➞ | |
 | LANC Lancaster Colony Corporation |
| Sector: Consumer Staples | |
| SubSector: Food - Major Diversified | |
| MarketCap: 4060.83 Millions | |
| Recent Price: 190.35 Smart Investing & Trading Score: 58 | |
| Day Percent Change: 1.78% Day Change: 3.32 | |
| Week Change: 1.78% Year-to-date Change: 14.4% | |
| LANC Links: Profile News Message Board | |
| Charts:- Daily , Weekly | |
| Add LANC to Watchlist: View: Get Complete LANC Trend Analysis ➞ | |
 | SRCE 1st Source Corporation |
| Sector: Financials | |
| SubSector: Regional - Midwest Banks | |
| MarketCap: 784.77 Millions | |
| Recent Price: 50.20 Smart Investing & Trading Score: 52 | |
| Day Percent Change: 1.78% Day Change: 0.88 | |
| Week Change: 1.78% Year-to-date Change: -8.6% | |
| SRCE Links: Profile News Message Board | |
| Charts:- Daily , Weekly | |
| Add SRCE to Watchlist: View: Get Complete SRCE Trend Analysis ➞ | |
 | MMSI Merit Medical Systems, Inc. |
| Sector: Health Care | |
| SubSector: Medical Instruments & Supplies | |
| MarketCap: 1719.2 Millions | |
| Recent Price: 75.09 Smart Investing & Trading Score: 62 | |
| Day Percent Change: 1.78% Day Change: 1.31 | |
| Week Change: 1.78% Year-to-date Change: -1.2% | |
| MMSI Links: Profile News Message Board | |
| Charts:- Daily , Weekly | |
| Add MMSI to Watchlist: View: Get Complete MMSI Trend Analysis ➞ | |
| Too many stocks? View smallcap stocks filtered by marketcap & sector |
| Marketcap: All SmallCap Stocks (default-no microcap), Large, Mid-Range, Small & MicroCap |
| Sector: Tech, Finance, Energy, Staples, Retail, Industrial, Materials, Utilities & Medical |
|
Best Stocks Today 12Stocks.com |
© 2024 12Stocks.com Terms & Conditions Privacy Contact Us
All Information Provided Only For Education And Not To Be Used For Investing or Trading. See Terms & Conditions


One More Thing ... Get Best Stocks Delivered Daily!
Never Ever Miss A Move With Our Top Ten Stocks Lists
Find Best Stocks In Any Market - Bull or Bear Market
Take A Peek At Our Top Ten Stocks Lists: Daily, Weekly, Year-to-Date & Top Trends
Find Best Stocks In Any Market - Bull or Bear Market
Take A Peek At Our Top Ten Stocks Lists: Daily, Weekly, Year-to-Date & Top Trends
Smallcap Stocks With Best Up Trends [0-bearish to 100-bullish]: Bakkt [100], Deciphera [100], Phibro Animal[100], Heartland Financial[100], PTC [100], Sight Sciences[100], Richardson Electronics[100], Fulton Financial[100], TPI Composites[100], Cullinan Oncology[100], Lands [100]
Best Smallcap Stocks Year-to-Date:
CareMax [580.41%], Janux [421.92%], Bakkt [346.64%], Viking [305.75%], Longboard [247.46%], Alpine Immune[239.81%], Super Micro[213.22%], Avidity Biosciences[173.23%], Arcutis Bio[171.83%], Vera [167.31%], Cullinan Oncology[166.01%] Best Smallcap Stocks This Week:
Deciphera [72.56%], Phibro Animal[31.81%], Vaxxinity [31.65%], Zevia PBC[20.94%], Velo3D [19.97%], Acrivon [18.2%], Janux [18.18%], MultiPlan [15.53%], Heartland Financial[15.15%], Codexis [14.66%], Eyenovia [13.37%] Best Smallcap Stocks Daily:
Bakkt [2391.87%], Deciphera [72.56%], Phibro Animal[31.81%], Vaxxinity [31.65%], Zevia PBC[20.94%], Velo3D [19.97%], Acrivon [18.20%], Janux [18.18%], MultiPlan [15.53%], Heartland Financial[15.15%], Codexis [14.66%]