
 Login Sign Up


| |||||
 |  | ||||

| 12Stocks.com Market Intelligence |
Best SmallCap Stocks
|
| In a hurry? Small Cap Stock Lists: Performance Trends Table, Stock Charts
Sort Small Cap stocks: Daily, Weekly, Year-to-Date, Market Cap & Trends. Filter Small Cap stocks list by sector: Show all, Tech, Finance, Energy, Staples, Retail, Industrial, Materials, Utilities and HealthCare Filter Small Cap stocks list by size: All Large Medium Small and MicroCap |
| 12Stocks.com Small Cap Stocks Performances & Trends Daily | |||||||||
|
|  The overall Smart Investing & Trading Score is 88 (0-bearish to 100-bullish) which puts Small Cap index in short term bullish trend. The Smart Investing & Trading Score from previous trading session is 56 and hence an improvement of trend.
| ||||||||
Here are the Smart Investing & Trading Scores of the most requested small cap stocks at 12Stocks.com (click stock name for detailed review):
|


| 12Stocks.com: Investing in Smallcap Index with Stocks | |
|
The following table helps investors and traders sort through current performance and trends (as measured by Smart Investing & Trading Score) of various
stocks in the Smallcap Index. Quick View: Move mouse or cursor over stock symbol (ticker) to view short-term technical chart and over stock name to view long term chart. Click on  to add stock symbol to your watchlist and to add stock symbol to your watchlist and  to view watchlist. Click on any ticker or stock name for detailed market intelligence report for that stock. to view watchlist. Click on any ticker or stock name for detailed market intelligence report for that stock. |
12Stocks.com Performance of Stocks in Smallcap Index
| Ticker | Stock Name | Watchlist | Category | Recent Price | Smart Investing & Trading Score | Change % | Weekly Change% |
| MDXG | MiMedx Group |   | Health Care | 6.26 | 29 | -0.16% | -0.16% |
| BATRK | Liberty Braves | | Services & Goods | 38.13 | 50 | -0.16% | -0.16% |
| VAL | Valaris | | Energy | 69.08 | 70 | -0.17% | -0.17% |
| TWI | Titan | | Industrials | 11.53 | 27 | -0.17% | -0.17% |
| NHI | National Health | | Financials | 62.78 | 76 | -0.17% | -0.17% |
| WINA | Winmark | | Services & Goods | 359.40 | 38 | -0.17% | -0.17% |
| PUBM | PubMatic | | Technology | 23.17 | 69 | -0.17% | -0.17% |
| BZH | Beazer Homes | | Industrials | 28.40 | 64 | -0.18% | -0.18% |
| SBH | Sally Beauty | | Services & Goods | 10.98 | 44 | -0.18% | -0.18% |
| TTGT | TechTarget | | Technology | 27.45 | 52 | -0.18% | -0.18% |
| BSIG | BrightSphere | | Financials | 22.57 | 51 | -0.18% | -0.18% |
| SAVA | Cassava Sciences | | Health Care | 22.30 | 52 | -0.18% | -0.18% |
| HVT | Haverty Furniture | | Services & Goods | 31.24 | 25 | -0.19% | -0.19% |
| FMBH | First Mid | | Financials | 31.45 | 60 | -0.19% | -0.19% |
| ITOS | iTeos | | Health Care | 10.78 | 61 | -0.19% | -0.19% |
| BMEA | Biomea Fusion | | Health Care | 10.75 | 17 | -0.19% | -0.19% |
| CRCT | Cricut | | Technology | 5.38 | 81 | -0.19% | -0.19% |
| JAMF | Jamf Holding | | Technology | 19.51 | 61 | -0.20% | -0.20% |
| TCBX | Third Coast | | Financials | 19.86 | 69 | -0.20% | -0.20% |
| LTC | LTC Properties | | Financials | 32.49 | 100 | -0.21% | -0.21% |
| EVTC | EVERTEC | | Technology | 38.35 | 60 | -0.21% | -0.21% |
| MD | MEDNAX | | Health Care | 9.02 | 34 | -0.22% | -0.22% |
| CNOB | ConnectOne Bancorp | | Financials | 18.26 | 25 | -0.22% | -0.22% |
| LASR | nLIGHT | | Technology | 11.53 | 42 | -0.22% | -0.22% |
| MYPS | PLAYSTUDIOS | | Services & Goods | 2.24 | 61 | -0.22% | -0.22% |


| Too many stocks? View smallcap stocks filtered by marketcap & sector |
| Marketcap: All SmallCap Stocks (default-no microcap), Large, Mid-Range, Small |
| Smallcap Sector: Tech, Finance, Energy, Staples, Retail, Industrial, Materials, & Medical |
|
Get the most comprehensive stock market coverage daily at 12Stocks.com ➞ Best Stocks Today ➞ Best Stocks Weekly ➞ Best Stocks Year-to-Date ➞ Best Stocks Trends ➞  Best Stocks Today 12Stocks.com Best Nasdaq Stocks ➞ Best S&P 500 Stocks ➞ Best Tech Stocks ➞ Best Biotech Stocks ➞ |
| Detailed Overview of SmallCap Stocks |
| SmallCap Technical Overview, Leaders & Laggards, Top SmallCap ETF Funds & Detailed SmallCap Stocks List, Charts, Trends & More |
| Smallcap: Technical Analysis, Trends & YTD Performance | |
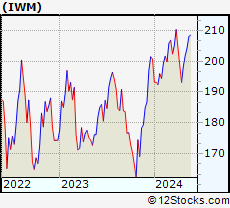
| SmallCap segment as represented by
IWM, an exchange-traded fund [ETF], holds basket of thousands of smallcap stocks from across all major sectors of the US stock market. The smallcap index (contains stocks like Riverbed & Sotheby's) is down by -0.37% and is currently underperforming the overall market by -6.93% year-to-date. Below is a quick view of technical charts and trends: | |
 IWM Weekly Chart |
|
| Long Term Trend: Very Good | |
| Medium Term Trend: Good | |
 IWM Daily Chart |
|
| Short Term Trend: Very Good | |
| Overall Trend Score: 88 | |
| YTD Performance: -0.37% | |
| **Trend Scores & Views Are Only For Educational Purposes And Not For Investing | |
| 12Stocks.com: Top Performing Small Cap Index Stocks | ||||||||||||||||||||||||||||||||||||||||||||||||
 The top performing Small Cap Index stocks year to date are
Now, more recently, over last week, the top performing Small Cap Index stocks on the move are


|
||||||||||||||||||||||||||||||||||||||||||||||||
| 12Stocks.com: Investing in Smallcap Index using Exchange Traded Funds | |
|
The following table shows list of key exchange traded funds (ETF) that
help investors track Smallcap index. The following list also includes leveraged ETF funds that track twice or thrice the daily returns of Smallcap indices. Short or inverse ETF funds move in the opposite direction to the index they track and are useful during market pullbacks or during bear markets. Quick View: Move mouse or cursor over ETF symbol (ticker) to view short-term technical chart and over ETF name to view long term chart. Click on ticker or stock name for detailed view. Click on to add stock symbol to your watchlist and to view watchlist. |
12Stocks.com List of ETFs that track Smallcap Index
| Ticker | ETF Name | Watchlist | Recent Price | Smart Investing & Trading Score | Change % | Week % | Year-to-date % |
| IWM | iShares Russell 2000 | | 199.96 | 88 | 0.79 | 0.79 | -0.37% |
| IJR | iShares Core S&P Small-Cap | | 106.41 | 93 | 0.72 | 0.72 | -1.7% |
| VTWO | Vanguard Russell 2000 ETF | | 80.78 | 88 | 0.70 | 0.7 | -0.39% |
| IWN | iShares Russell 2000 Value | | 152.05 | 93 | 0.60 | 0.6 | -2.11% |
| IWO | iShares Russell 2000 Growth | | 255.74 | 78 | 1.05 | 1.05 | 1.4% |
| IJS | iShares S&P Small-Cap 600 Value | | 97.95 | 70 | 0.78 | 0.78 | -4.97% |
| IJT | iShares S&P Small-Cap 600 Growth | | 126.96 | 88 | 0.69 | 0.69 | 1.45% |
| XSLV | PowerShares S&P SmallCap Low Volatil ETF | | 42.87 | 80 | 0.35 | 0.35 | -2.9% |
| SMLV | SPDR SSGA US Small Cap Low Volatil ETF | | 107.77 | 68 | 0.23 | 0.23 | -4.22% |
| SAA | ProShares Ultra SmallCap600 | | 23.27 | 88 | 1.00 | 1 | -6.73% |
| SBB | ProShares Short SmallCap600 | | 16.28 | 8 | -0.64 | -0.64 | 2.2% |
| SDD | ProShares UltraShort SmallCap600 | | 19.09 | 15 | -1.34 | -1.34 | 3.6% |
| 12Stocks.com: Charts, Trends, Fundamental Data and Performances of SmallCap Stocks | |
|
We now take in-depth look at all SmallCap stocks including charts, multi-period performances and overall trends (as measured by Smart Investing & Trading Score). One can sort SmallCap stocks (click link to choose) by Daily, Weekly and by Year-to-Date performances. Also, one can sort by size of the company or by market capitalization. |
| Select Your Default Chart Type: | |||||
| |||||
| Click on stock symbol or name for detailed view. Click on to add stock symbol to your watchlist and to view watchlist. Quick View: Move mouse or cursor over "Daily" to quickly view daily technical stock chart and over "Weekly" to view weekly technical stock chart. | |||||

 | MDXG MiMedx Group, Inc. |
| Sector: Health Care | |
| SubSector: Medical Appliances & Equipment | |
| MarketCap: 371.08 Millions | |
| Recent Price: 6.26 Smart Investing & Trading Score: 29 | |
| Day Percent Change: -0.16% Day Change: -0.01 | |
| Week Change: -0.16% Year-to-date Change: -28.6% | |
| MDXG Links: Profile News Message Board | |
| Charts:- Daily , Weekly | |
| Add MDXG to Watchlist: View: Get Complete MDXG Trend Analysis ➞ | |
 | BATRK The Liberty Braves Group |
| Sector: Services & Goods | |
| SubSector: Broadcasting - TV | |
| MarketCap: 638.363 Millions | |
| Recent Price: 38.13 Smart Investing & Trading Score: 50 | |
| Day Percent Change: -0.16% Day Change: -0.06 | |
| Week Change: -0.16% Year-to-date Change: -3.7% | |
| BATRK Links: Profile News Message Board | |
| Charts:- Daily , Weekly | |
| Add BATRK to Watchlist: View: Get Complete BATRK Trend Analysis ➞ | |
 | VAL Valaris Limited |
| Sector: Energy | |
| SubSector: Oil & Gas Equipment & Services | |
| MarketCap: 4520 Millions | |
| Recent Price: 69.08 Smart Investing & Trading Score: 70 | |
| Day Percent Change: -0.17% Day Change: -0.12 | |
| Week Change: -0.17% Year-to-date Change: 0.7% | |
| VAL Links: Profile News Message Board | |
| Charts:- Daily , Weekly | |
| Add VAL to Watchlist: View: Get Complete VAL Trend Analysis ➞ | |
 | TWI Titan International, Inc. |
| Sector: Industrials | |
| SubSector: Farm & Construction Machinery | |
| MarketCap: 104.607 Millions | |
| Recent Price: 11.53 Smart Investing & Trading Score: 27 | |
| Day Percent Change: -0.17% Day Change: -0.02 | |
| Week Change: -0.17% Year-to-date Change: -22.5% | |
| TWI Links: Profile News Message Board | |
| Charts:- Daily , Weekly | |
| Add TWI to Watchlist: View: Get Complete TWI Trend Analysis ➞ | |
 | NHI National Health Investors, Inc. |
| Sector: Financials | |
| SubSector: REIT - Healthcare Facilities | |
| MarketCap: 2156.54 Millions | |
| Recent Price: 62.78 Smart Investing & Trading Score: 76 | |
| Day Percent Change: -0.17% Day Change: -0.11 | |
| Week Change: -0.17% Year-to-date Change: 12.4% | |
| NHI Links: Profile News Message Board | |
| Charts:- Daily , Weekly | |
| Add NHI to Watchlist: View: Get Complete NHI Trend Analysis ➞ | |
 | WINA Winmark Corporation |
| Sector: Services & Goods | |
| SubSector: Specialty Retail, Other | |
| MarketCap: 520.444 Millions | |
| Recent Price: 359.40 Smart Investing & Trading Score: 38 | |
| Day Percent Change: -0.17% Day Change: -0.60 | |
| Week Change: -0.17% Year-to-date Change: -13.9% | |
| WINA Links: Profile News Message Board | |
| Charts:- Daily , Weekly | |
| Add WINA to Watchlist: View: Get Complete WINA Trend Analysis ➞ | |
 | PUBM PubMatic, Inc. |
| Sector: Technology | |
| SubSector: Software Application | |
| MarketCap: 56787 Millions | |
| Recent Price: 23.17 Smart Investing & Trading Score: 69 | |
| Day Percent Change: -0.17% Day Change: -0.04 | |
| Week Change: -0.17% Year-to-date Change: 42.2% | |
| PUBM Links: Profile News Message Board | |
| Charts:- Daily , Weekly | |
| Add PUBM to Watchlist: View: Get Complete PUBM Trend Analysis ➞ | |
 | BZH Beazer Homes USA, Inc. |
| Sector: Industrials | |
| SubSector: Residential Construction | |
| MarketCap: 180.106 Millions | |
| Recent Price: 28.40 Smart Investing & Trading Score: 64 | |
| Day Percent Change: -0.18% Day Change: -0.05 | |
| Week Change: -0.18% Year-to-date Change: -16.0% | |
| BZH Links: Profile News Message Board | |
| Charts:- Daily , Weekly | |
| Add BZH to Watchlist: View: Get Complete BZH Trend Analysis ➞ | |
 | SBH Sally Beauty Holdings, Inc. |
| Sector: Services & Goods | |
| SubSector: Specialty Retail, Other | |
| MarketCap: 1229.44 Millions | |
| Recent Price: 10.98 Smart Investing & Trading Score: 44 | |
| Day Percent Change: -0.18% Day Change: -0.02 | |
| Week Change: -0.18% Year-to-date Change: -17.3% | |
| SBH Links: Profile News Message Board | |
| Charts:- Daily , Weekly | |
| Add SBH to Watchlist: View: Get Complete SBH Trend Analysis ➞ | |
 | TTGT TechTarget, Inc. |
| Sector: Technology | |
| SubSector: Internet Information Providers | |
| MarketCap: 560.78 Millions | |
| Recent Price: 27.45 Smart Investing & Trading Score: 52 | |
| Day Percent Change: -0.18% Day Change: -0.05 | |
| Week Change: -0.18% Year-to-date Change: -21.3% | |
| TTGT Links: Profile News Message Board | |
| Charts:- Daily , Weekly | |
| Add TTGT to Watchlist: View: Get Complete TTGT Trend Analysis ➞ | |
 | BSIG BrightSphere Investment Group Inc. |
| Sector: Financials | |
| SubSector: Asset Management | |
| MarketCap: 430.103 Millions | |
| Recent Price: 22.57 Smart Investing & Trading Score: 51 | |
| Day Percent Change: -0.18% Day Change: -0.04 | |
| Week Change: -0.18% Year-to-date Change: 17.8% | |
| BSIG Links: Profile News Message Board | |
| Charts:- Daily , Weekly | |
| Add BSIG to Watchlist: View: Get Complete BSIG Trend Analysis ➞ | |
 | SAVA Cassava Sciences, Inc. |
| Sector: Health Care | |
| SubSector: Biotechnology | |
| MarketCap: 86.6785 Millions | |
| Recent Price: 22.30 Smart Investing & Trading Score: 52 | |
| Day Percent Change: -0.18% Day Change: -0.04 | |
| Week Change: -0.18% Year-to-date Change: -0.9% | |
| SAVA Links: Profile News Message Board | |
| Charts:- Daily , Weekly | |
| Add SAVA to Watchlist: View: Get Complete SAVA Trend Analysis ➞ | |
 | HVT Haverty Furniture Companies, Inc. |
| Sector: Services & Goods | |
| SubSector: Home Furnishing Stores | |
| MarketCap: 253.125 Millions | |
| Recent Price: 31.24 Smart Investing & Trading Score: 25 | |
| Day Percent Change: -0.19% Day Change: -0.06 | |
| Week Change: -0.19% Year-to-date Change: -12.0% | |
| HVT Links: Profile News Message Board | |
| Charts:- Daily , Weekly | |
| Add HVT to Watchlist: View: Get Complete HVT Trend Analysis ➞ | |
 | FMBH First Mid Bancshares, Inc. |
| Sector: Financials | |
| SubSector: Regional - Midwest Banks | |
| MarketCap: 373.27 Millions | |
| Recent Price: 31.45 Smart Investing & Trading Score: 60 | |
| Day Percent Change: -0.19% Day Change: -0.06 | |
| Week Change: -0.19% Year-to-date Change: -9.3% | |
| FMBH Links: Profile News Message Board | |
| Charts:- Daily , Weekly | |
| Add FMBH to Watchlist: View: Get Complete FMBH Trend Analysis ➞ | |
 | ITOS iTeos Therapeutics, Inc. |
| Sector: Health Care | |
| SubSector: Biotechnology | |
| MarketCap: 10487 Millions | |
| Recent Price: 10.78 Smart Investing & Trading Score: 61 | |
| Day Percent Change: -0.19% Day Change: -0.02 | |
| Week Change: -0.19% Year-to-date Change: -1.5% | |
| ITOS Links: Profile News Message Board | |
| Charts:- Daily , Weekly | |
| Add ITOS to Watchlist: View: Get Complete ITOS Trend Analysis ➞ | |
 | BMEA Biomea Fusion, Inc. |
| Sector: Health Care | |
| SubSector: Biotechnology | |
| MarketCap: 818 Millions | |
| Recent Price: 10.75 Smart Investing & Trading Score: 17 | |
| Day Percent Change: -0.19% Day Change: -0.02 | |
| Week Change: -0.19% Year-to-date Change: -26.6% | |
| BMEA Links: Profile News Message Board | |
| Charts:- Daily , Weekly | |
| Add BMEA to Watchlist: View: Get Complete BMEA Trend Analysis ➞ | |
 | CRCT Cricut, Inc. |
| Sector: Technology | |
| SubSector: Computer Hardware | |
| MarketCap: 2920 Millions | |
| Recent Price: 5.38 Smart Investing & Trading Score: 81 | |
| Day Percent Change: -0.19% Day Change: -0.01 | |
| Week Change: -0.19% Year-to-date Change: -19.4% | |
| CRCT Links: Profile News Message Board | |
| Charts:- Daily , Weekly | |
| Add CRCT to Watchlist: View: Get Complete CRCT Trend Analysis ➞ | |
 | JAMF Jamf Holding Corp. |
| Sector: Technology | |
| SubSector: Software Application | |
| MarketCap: 36987 Millions | |
| Recent Price: 19.51 Smart Investing & Trading Score: 61 | |
| Day Percent Change: -0.20% Day Change: -0.04 | |
| Week Change: -0.2% Year-to-date Change: 8.0% | |
| JAMF Links: Profile News Message Board | |
| Charts:- Daily , Weekly | |
| Add JAMF to Watchlist: View: Get Complete JAMF Trend Analysis ➞ | |
 | TCBX Third Coast Bancshares, Inc. |
| Sector: Financials | |
| SubSector: Banks - Regional | |
| MarketCap: 212 Millions | |
| Recent Price: 19.86 Smart Investing & Trading Score: 69 | |
| Day Percent Change: -0.20% Day Change: -0.04 | |
| Week Change: -0.2% Year-to-date Change: -0.8% | |
| TCBX Links: Profile News Message Board | |
| Charts:- Daily , Weekly | |
| Add TCBX to Watchlist: View: Get Complete TCBX Trend Analysis ➞ | |
 | LTC LTC Properties, Inc. |
| Sector: Financials | |
| SubSector: REIT - Healthcare Facilities | |
| MarketCap: 1369.24 Millions | |
| Recent Price: 32.49 Smart Investing & Trading Score: 100 | |
| Day Percent Change: -0.21% Day Change: -0.07 | |
| Week Change: -0.21% Year-to-date Change: 1.2% | |
| LTC Links: Profile News Message Board | |
| Charts:- Daily , Weekly | |
| Add LTC to Watchlist: View: Get Complete LTC Trend Analysis ➞ | |
 | EVTC EVERTEC, Inc. |
| Sector: Technology | |
| SubSector: Business Software & Services | |
| MarketCap: 1646.08 Millions | |
| Recent Price: 38.35 Smart Investing & Trading Score: 60 | |
| Day Percent Change: -0.21% Day Change: -0.08 | |
| Week Change: -0.21% Year-to-date Change: -6.3% | |
| EVTC Links: Profile News Message Board | |
| Charts:- Daily , Weekly | |
| Add EVTC to Watchlist: View: Get Complete EVTC Trend Analysis ➞ | |
 | MD MEDNAX, Inc. |
| Sector: Health Care | |
| SubSector: Specialized Health Services | |
| MarketCap: 913.656 Millions | |
| Recent Price: 9.02 Smart Investing & Trading Score: 34 | |
| Day Percent Change: -0.22% Day Change: -0.02 | |
| Week Change: -0.22% Year-to-date Change: -3.0% | |
| MD Links: Profile News Message Board | |
| Charts:- Daily , Weekly | |
| Add MD to Watchlist: View: Get Complete MD Trend Analysis ➞ | |
 | CNOB ConnectOne Bancorp, Inc. |
| Sector: Financials | |
| SubSector: Regional - Northeast Banks | |
| MarketCap: 491.899 Millions | |
| Recent Price: 18.26 Smart Investing & Trading Score: 25 | |
| Day Percent Change: -0.22% Day Change: -0.04 | |
| Week Change: -0.22% Year-to-date Change: -20.3% | |
| CNOB Links: Profile News Message Board | |
| Charts:- Daily , Weekly | |
| Add CNOB to Watchlist: View: Get Complete CNOB Trend Analysis ➞ | |
 | LASR nLIGHT, Inc. |
| Sector: Technology | |
| SubSector: Semiconductor - Broad Line | |
| MarketCap: 445.642 Millions | |
| Recent Price: 11.53 Smart Investing & Trading Score: 42 | |
| Day Percent Change: -0.22% Day Change: -0.03 | |
| Week Change: -0.22% Year-to-date Change: -14.6% | |
| LASR Links: Profile News Message Board | |
| Charts:- Daily , Weekly | |
| Add LASR to Watchlist: View: Get Complete LASR Trend Analysis ➞ | |
 | MYPS PLAYSTUDIOS, Inc. |
| Sector: Services & Goods | |
| SubSector: Electronic Gaming & Multimedia | |
| MarketCap: 635 Millions | |
| Recent Price: 2.24 Smart Investing & Trading Score: 61 | |
| Day Percent Change: -0.22% Day Change: 0.00 | |
| Week Change: -0.22% Year-to-date Change: -16.3% | |
| MYPS Links: Profile News Message Board | |
| Charts:- Daily , Weekly | |
| Add MYPS to Watchlist: View: Get Complete MYPS Trend Analysis ➞ | |
| Too many stocks? View smallcap stocks filtered by marketcap & sector |
| Marketcap: All SmallCap Stocks (default-no microcap), Large, Mid-Range, Small & MicroCap |
| Sector: Tech, Finance, Energy, Staples, Retail, Industrial, Materials, Utilities & Medical |
|
Best Stocks Today 12Stocks.com |
© 2024 12Stocks.com Terms & Conditions Privacy Contact Us
All Information Provided Only For Education And Not To Be Used For Investing or Trading. See Terms & Conditions


One More Thing ... Get Best Stocks Delivered Daily!
Never Ever Miss A Move With Our Top Ten Stocks Lists
Find Best Stocks In Any Market - Bull or Bear Market
Take A Peek At Our Top Ten Stocks Lists: Daily, Weekly, Year-to-Date & Top Trends
Find Best Stocks In Any Market - Bull or Bear Market
Take A Peek At Our Top Ten Stocks Lists: Daily, Weekly, Year-to-Date & Top Trends
Smallcap Stocks With Best Up Trends [0-bearish to 100-bullish]: Bakkt [100], Deciphera [100], Phibro Animal[100], Heartland Financial[100], PTC [100], Sight Sciences[100], Richardson Electronics[100], Fulton Financial[100], TPI Composites[100], Cullinan Oncology[100], Lands [100]
Best Smallcap Stocks Year-to-Date:
CareMax [580.41%], Janux [421.92%], Bakkt [346.64%], Viking [305.75%], Longboard [247.46%], Alpine Immune[239.81%], Super Micro[213.22%], Avidity Biosciences[173.23%], Arcutis Bio[171.83%], Vera [167.31%], Cullinan Oncology[166.01%] Best Smallcap Stocks This Week:
Deciphera [72.56%], Phibro Animal[31.81%], Vaxxinity [31.65%], Zevia PBC[20.94%], Velo3D [19.97%], Acrivon [18.2%], Janux [18.18%], MultiPlan [15.53%], Heartland Financial[15.15%], Codexis [14.66%], Eyenovia [13.37%] Best Smallcap Stocks Daily:
Bakkt [2391.87%], Deciphera [72.56%], Phibro Animal[31.81%], Vaxxinity [31.65%], Zevia PBC[20.94%], Velo3D [19.97%], Acrivon [18.20%], Janux [18.18%], MultiPlan [15.53%], Heartland Financial[15.15%], Codexis [14.66%]