
 Login Sign Up


| |||||
 |  | ||||

| 12Stocks.com Market Intelligence |
Best SmallCap Stocks
|
| In a hurry? Small Cap Stock Lists: Performance Trends Table, Stock Charts
Sort Small Cap stocks: Daily, Weekly, Year-to-Date, Market Cap & Trends. Filter Small Cap stocks list by sector: Show all, Tech, Finance, Energy, Staples, Retail, Industrial, Materials, Utilities and HealthCare Filter Small Cap stocks list by size: All Large Medium Small and MicroCap |
| 12Stocks.com Small Cap Stocks Performances & Trends Daily | |||||||||
|
|  The overall Smart Investing & Trading Score is 88 (0-bearish to 100-bullish) which puts Small Cap index in short term bullish trend. The Smart Investing & Trading Score from previous trading session is 56 and hence an improvement of trend.
| ||||||||
Here are the Smart Investing & Trading Scores of the most requested small cap stocks at 12Stocks.com (click stock name for detailed review):
|


| 12Stocks.com: Investing in Smallcap Index with Stocks | |
|
The following table helps investors and traders sort through current performance and trends (as measured by Smart Investing & Trading Score) of various
stocks in the Smallcap Index. Quick View: Move mouse or cursor over stock symbol (ticker) to view short-term technical chart and over stock name to view long term chart. Click on  to add stock symbol to your watchlist and to add stock symbol to your watchlist and  to view watchlist. Click on any ticker or stock name for detailed market intelligence report for that stock. to view watchlist. Click on any ticker or stock name for detailed market intelligence report for that stock. |
12Stocks.com Performance of Stocks in Smallcap Index
| Ticker | Stock Name | Watchlist | Category | Recent Price | Smart Investing & Trading Score | Change % | Weekly Change% |
| ACT | Enact |   | Financials | 29.93 | 73 | -0.03% | -0.03% |
| PRLB | Proto Labs | | Industrials | 31.36 | 20 | -0.03% | -0.03% |
| MLP | Maui Land | | Financials | 19.80 | 60 | -0.05% | -0.05% |
| ONEW | OneWater Marine | | Services & Goods | 21.96 | 17 | -0.05% | -0.05% |
| KAR | KAR Auction | | Services & Goods | 17.41 | 75 | -0.06% | -0.06% |
| WERN | Werner Enterprises | | Transports | 34.72 | 20 | -0.06% | -0.06% |
| JJSF | J & J Snack Foods | | Consumer Staples | 136.59 | 37 | -0.06% | -0.06% |
| PRST | Presto Automation | | Technology | 0.17 | 20 | -0.06% | -0.06% |
| ZUMZ | Zumiez | | Services & Goods | 16.94 | 75 | -0.06% | -0.06% |
| CENTA | Central Garden | | Materials | 35.52 | 37 | -0.06% | -0.06% |
| CBRL | Cracker Barrel | | Services & Goods | 59.28 | 52 | -0.07% | -0.07% |
| BATRA | Liberty Braves | | Services & Goods | 41.13 | 42 | -0.07% | -0.07% |
| MTH | Meritage Homes | | Industrials | 169.35 | 88 | -0.08% | -0.08% |
| AVDX | AvidXchange | | Technology | 11.96 | 43 | -0.08% | -0.08% |
| NABL | N-able | | Technology | 12.39 | 49 | -0.08% | -0.08% |
| DHT | DHT | | Transports | 11.50 | 90 | -0.09% | -0.09% |
| MRC | MRC Global | | Energy | 11.59 | 44 | -0.09% | -0.09% |
| PBPB | Potbelly | | Services & Goods | 10.62 | 45 | -0.09% | -0.09% |
| DEA | Easterly Government | | Financials | 11.68 | 42 | -0.09% | -0.09% |
| INTA | Intapp | | Technology | 31.87 | 64 | -0.09% | -0.09% |
| DLX | Deluxe | | Services & Goods | 20.33 | 100 | -0.10% | -0.10% |
| SHO | Sunstone Hotel | | Financials | 10.29 | 10 | -0.10% | -0.10% |
| AMSWA | American | | Technology | 10.21 | 25 | -0.10% | -0.10% |
| TNK | Teekay Tankers | | Transports | 58.60 | 64 | -0.10% | -0.10% |
| KREF | KKR Real | | Financials | 9.61 | 32 | -0.10% | -0.10% |


| Too many stocks? View smallcap stocks filtered by marketcap & sector |
| Marketcap: All SmallCap Stocks (default-no microcap), Large, Mid-Range, Small |
| Smallcap Sector: Tech, Finance, Energy, Staples, Retail, Industrial, Materials, & Medical |
|
Get the most comprehensive stock market coverage daily at 12Stocks.com ➞ Best Stocks Today ➞ Best Stocks Weekly ➞ Best Stocks Year-to-Date ➞ Best Stocks Trends ➞  Best Stocks Today 12Stocks.com Best Nasdaq Stocks ➞ Best S&P 500 Stocks ➞ Best Tech Stocks ➞ Best Biotech Stocks ➞ |
| Detailed Overview of SmallCap Stocks |
| SmallCap Technical Overview, Leaders & Laggards, Top SmallCap ETF Funds & Detailed SmallCap Stocks List, Charts, Trends & More |
| Smallcap: Technical Analysis, Trends & YTD Performance | |
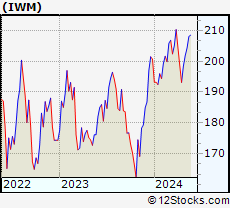
| SmallCap segment as represented by
IWM, an exchange-traded fund [ETF], holds basket of thousands of smallcap stocks from across all major sectors of the US stock market. The smallcap index (contains stocks like Riverbed & Sotheby's) is down by -0.37% and is currently underperforming the overall market by -6.93% year-to-date. Below is a quick view of technical charts and trends: | |
 IWM Weekly Chart |
|
| Long Term Trend: Very Good | |
| Medium Term Trend: Good | |
 IWM Daily Chart |
|
| Short Term Trend: Very Good | |
| Overall Trend Score: 88 | |
| YTD Performance: -0.37% | |
| **Trend Scores & Views Are Only For Educational Purposes And Not For Investing | |
| 12Stocks.com: Top Performing Small Cap Index Stocks | ||||||||||||||||||||||||||||||||||||||||||||||||
 The top performing Small Cap Index stocks year to date are
Now, more recently, over last week, the top performing Small Cap Index stocks on the move are


|
||||||||||||||||||||||||||||||||||||||||||||||||
| 12Stocks.com: Investing in Smallcap Index using Exchange Traded Funds | |
|
The following table shows list of key exchange traded funds (ETF) that
help investors track Smallcap index. The following list also includes leveraged ETF funds that track twice or thrice the daily returns of Smallcap indices. Short or inverse ETF funds move in the opposite direction to the index they track and are useful during market pullbacks or during bear markets. Quick View: Move mouse or cursor over ETF symbol (ticker) to view short-term technical chart and over ETF name to view long term chart. Click on ticker or stock name for detailed view. Click on to add stock symbol to your watchlist and to view watchlist. |
12Stocks.com List of ETFs that track Smallcap Index
| Ticker | ETF Name | Watchlist | Recent Price | Smart Investing & Trading Score | Change % | Week % | Year-to-date % |
| IWM | iShares Russell 2000 | | 199.96 | 88 | 0.79 | 0.79 | -0.37% |
| IJR | iShares Core S&P Small-Cap | | 106.41 | 93 | 0.72 | 0.72 | -1.7% |
| VTWO | Vanguard Russell 2000 ETF | | 80.78 | 88 | 0.70 | 0.7 | -0.39% |
| IWN | iShares Russell 2000 Value | | 152.05 | 93 | 0.60 | 0.6 | -2.11% |
| IWO | iShares Russell 2000 Growth | | 255.74 | 78 | 1.05 | 1.05 | 1.4% |
| IJS | iShares S&P Small-Cap 600 Value | | 97.95 | 70 | 0.78 | 0.78 | -4.97% |
| IJT | iShares S&P Small-Cap 600 Growth | | 126.96 | 88 | 0.69 | 0.69 | 1.45% |
| XSLV | PowerShares S&P SmallCap Low Volatil ETF | | 42.87 | 80 | 0.35 | 0.35 | -2.9% |
| SMLV | SPDR SSGA US Small Cap Low Volatil ETF | | 107.77 | 68 | 0.23 | 0.23 | -4.22% |
| SAA | ProShares Ultra SmallCap600 | | 23.27 | 88 | 1.00 | 1 | -6.73% |
| SBB | ProShares Short SmallCap600 | | 16.28 | 8 | -0.64 | -0.64 | 2.2% |
| SDD | ProShares UltraShort SmallCap600 | | 19.09 | 15 | -1.34 | -1.34 | 3.6% |
| 12Stocks.com: Charts, Trends, Fundamental Data and Performances of SmallCap Stocks | |
|
We now take in-depth look at all SmallCap stocks including charts, multi-period performances and overall trends (as measured by Smart Investing & Trading Score). One can sort SmallCap stocks (click link to choose) by Daily, Weekly and by Year-to-Date performances. Also, one can sort by size of the company or by market capitalization. |
| Select Your Default Chart Type: | |||||
| |||||
| Click on stock symbol or name for detailed view. Click on to add stock symbol to your watchlist and to view watchlist. Quick View: Move mouse or cursor over "Daily" to quickly view daily technical stock chart and over "Weekly" to view weekly technical stock chart. | |||||

 | ACT Enact Holdings, Inc. |
| Sector: Financials | |
| SubSector: Insurance - Specialty | |
| MarketCap: 4010 Millions | |
| Recent Price: 29.93 Smart Investing & Trading Score: 73 | |
| Day Percent Change: -0.03% Day Change: -0.01 | |
| Week Change: -0.03% Year-to-date Change: 2.9% | |
| ACT Links: Profile News Message Board | |
| Charts:- Daily , Weekly | |
| Add ACT to Watchlist: View: Get Complete ACT Trend Analysis ➞ | |
 | PRLB Proto Labs, Inc. |
| Sector: Industrials | |
| SubSector: Machine Tools & Accessories | |
| MarketCap: 1944.78 Millions | |
| Recent Price: 31.36 Smart Investing & Trading Score: 20 | |
| Day Percent Change: -0.03% Day Change: -0.01 | |
| Week Change: -0.03% Year-to-date Change: -19.5% | |
| PRLB Links: Profile News Message Board | |
| Charts:- Daily , Weekly | |
| Add PRLB to Watchlist: View: Get Complete PRLB Trend Analysis ➞ | |
 | MLP Maui Land & Pineapple Company, Inc. |
| Sector: Financials | |
| SubSector: Real Estate Development | |
| MarketCap: 186.619 Millions | |
| Recent Price: 19.80 Smart Investing & Trading Score: 60 | |
| Day Percent Change: -0.05% Day Change: -0.01 | |
| Week Change: -0.05% Year-to-date Change: 24.6% | |
| MLP Links: Profile News Message Board | |
| Charts:- Daily , Weekly | |
| Add MLP to Watchlist: View: Get Complete MLP Trend Analysis ➞ | |
 | ONEW OneWater Marine Inc. |
| Sector: Services & Goods | |
| SubSector: Recreational Vehicles | |
| MarketCap: 42027 Millions | |
| Recent Price: 21.96 Smart Investing & Trading Score: 17 | |
| Day Percent Change: -0.05% Day Change: -0.01 | |
| Week Change: -0.05% Year-to-date Change: -35.0% | |
| ONEW Links: Profile News Message Board | |
| Charts:- Daily , Weekly | |
| Add ONEW to Watchlist: View: Get Complete ONEW Trend Analysis ➞ | |
 | KAR KAR Auction Services, Inc. |
| Sector: Services & Goods | |
| SubSector: Specialty Retail, Other | |
| MarketCap: 1709.54 Millions | |
| Recent Price: 17.41 Smart Investing & Trading Score: 75 | |
| Day Percent Change: -0.06% Day Change: -0.01 | |
| Week Change: -0.06% Year-to-date Change: 17.6% | |
| KAR Links: Profile News Message Board | |
| Charts:- Daily , Weekly | |
| Add KAR to Watchlist: View: Get Complete KAR Trend Analysis ➞ | |
 | WERN Werner Enterprises, Inc. |
| Sector: Transports | |
| SubSector: Trucking | |
| MarketCap: 2409.65 Millions | |
| Recent Price: 34.72 Smart Investing & Trading Score: 20 | |
| Day Percent Change: -0.06% Day Change: -0.02 | |
| Week Change: -0.06% Year-to-date Change: -18.1% | |
| WERN Links: Profile News Message Board | |
| Charts:- Daily , Weekly | |
| Add WERN to Watchlist: View: Get Complete WERN Trend Analysis ➞ | |
 | JJSF J & J Snack Foods Corp. |
| Sector: Consumer Staples | |
| SubSector: Processed & Packaged Goods | |
| MarketCap: 2706.28 Millions | |
| Recent Price: 136.59 Smart Investing & Trading Score: 37 | |
| Day Percent Change: -0.06% Day Change: -0.08 | |
| Week Change: -0.06% Year-to-date Change: -18.3% | |
| JJSF Links: Profile News Message Board | |
| Charts:- Daily , Weekly | |
| Add JJSF to Watchlist: View: Get Complete JJSF Trend Analysis ➞ | |
 | PRST Presto Automation Inc. |
| Sector: Technology | |
| SubSector: Software - Application | |
| MarketCap: 238 Millions | |
| Recent Price: 0.17 Smart Investing & Trading Score: 20 | |
| Day Percent Change: -0.06% Day Change: 0.00 | |
| Week Change: -0.06% Year-to-date Change: -68.1% | |
| PRST Links: Profile News Message Board | |
| Charts:- Daily , Weekly | |
| Add PRST to Watchlist: View: Get Complete PRST Trend Analysis ➞ | |
 | ZUMZ Zumiez Inc. |
| Sector: Services & Goods | |
| SubSector: Specialty Retail, Other | |
| MarketCap: 526.244 Millions | |
| Recent Price: 16.94 Smart Investing & Trading Score: 75 | |
| Day Percent Change: -0.06% Day Change: -0.01 | |
| Week Change: -0.06% Year-to-date Change: -16.7% | |
| ZUMZ Links: Profile News Message Board | |
| Charts:- Daily , Weekly | |
| Add ZUMZ to Watchlist: View: Get Complete ZUMZ Trend Analysis ➞ | |
 | CENTA Central Garden & Pet Company |
| Sector: Materials | |
| SubSector: Agricultural Chemicals | |
| MarketCap: 953 Millions | |
| Recent Price: 35.52 Smart Investing & Trading Score: 37 | |
| Day Percent Change: -0.06% Day Change: -0.02 | |
| Week Change: -0.06% Year-to-date Change: -19.4% | |
| CENTA Links: Profile News Message Board | |
| Charts:- Daily , Weekly | |
| Add CENTA to Watchlist: View: Get Complete CENTA Trend Analysis ➞ | |
 | CBRL Cracker Barrel Old Country Store, Inc. |
| Sector: Services & Goods | |
| SubSector: Restaurants | |
| MarketCap: 1839.6 Millions | |
| Recent Price: 59.28 Smart Investing & Trading Score: 52 | |
| Day Percent Change: -0.07% Day Change: -0.04 | |
| Week Change: -0.07% Year-to-date Change: -23.1% | |
| CBRL Links: Profile News Message Board | |
| Charts:- Daily , Weekly | |
| Add CBRL to Watchlist: View: Get Complete CBRL Trend Analysis ➞ | |
 | BATRA The Liberty Braves Group |
| Sector: Services & Goods | |
| SubSector: Broadcasting - TV | |
| MarketCap: 18873.5 Millions | |
| Recent Price: 41.13 Smart Investing & Trading Score: 42 | |
| Day Percent Change: -0.07% Day Change: -0.03 | |
| Week Change: -0.07% Year-to-date Change: -3.9% | |
| BATRA Links: Profile News Message Board | |
| Charts:- Daily , Weekly | |
| Add BATRA to Watchlist: View: Get Complete BATRA Trend Analysis ➞ | |
 | MTH Meritage Homes Corporation |
| Sector: Industrials | |
| SubSector: Residential Construction | |
| MarketCap: 1440.36 Millions | |
| Recent Price: 169.35 Smart Investing & Trading Score: 88 | |
| Day Percent Change: -0.08% Day Change: -0.13 | |
| Week Change: -0.08% Year-to-date Change: -2.8% | |
| MTH Links: Profile News Message Board | |
| Charts:- Daily , Weekly | |
| Add MTH to Watchlist: View: Get Complete MTH Trend Analysis ➞ | |
 | AVDX AvidXchange Holdings, Inc. |
| Sector: Technology | |
| SubSector: Software - Infrastructure | |
| MarketCap: 2120 Millions | |
| Recent Price: 11.96 Smart Investing & Trading Score: 43 | |
| Day Percent Change: -0.08% Day Change: -0.01 | |
| Week Change: -0.08% Year-to-date Change: -3.7% | |
| AVDX Links: Profile News Message Board | |
| Charts:- Daily , Weekly | |
| Add AVDX to Watchlist: View: Get Complete AVDX Trend Analysis ➞ | |
 | NABL N-able, Inc. |
| Sector: Technology | |
| SubSector: Information Technology Services | |
| MarketCap: 2590 Millions | |
| Recent Price: 12.39 Smart Investing & Trading Score: 49 | |
| Day Percent Change: -0.08% Day Change: -0.01 | |
| Week Change: -0.08% Year-to-date Change: -6.9% | |
| NABL Links: Profile News Message Board | |
| Charts:- Daily , Weekly | |
| Add NABL to Watchlist: View: Get Complete NABL Trend Analysis ➞ | |
 | DHT DHT Holdings, Inc. |
| Sector: Transports | |
| SubSector: Shipping | |
| MarketCap: 754.514 Millions | |
| Recent Price: 11.50 Smart Investing & Trading Score: 90 | |
| Day Percent Change: -0.09% Day Change: -0.01 | |
| Week Change: -0.09% Year-to-date Change: 17.2% | |
| DHT Links: Profile News Message Board | |
| Charts:- Daily , Weekly | |
| Add DHT to Watchlist: View: Get Complete DHT Trend Analysis ➞ | |
 | MRC MRC Global Inc. |
| Sector: Energy | |
| SubSector: Oil & Gas Equipment & Services | |
| MarketCap: 364.061 Millions | |
| Recent Price: 11.59 Smart Investing & Trading Score: 44 | |
| Day Percent Change: -0.09% Day Change: -0.01 | |
| Week Change: -0.09% Year-to-date Change: 5.3% | |
| MRC Links: Profile News Message Board | |
| Charts:- Daily , Weekly | |
| Add MRC to Watchlist: View: Get Complete MRC Trend Analysis ➞ | |
 | PBPB Potbelly Corporation |
| Sector: Services & Goods | |
| SubSector: Specialty Eateries | |
| MarketCap: 58.8 Millions | |
| Recent Price: 10.62 Smart Investing & Trading Score: 45 | |
| Day Percent Change: -0.09% Day Change: -0.01 | |
| Week Change: -0.09% Year-to-date Change: 1.9% | |
| PBPB Links: Profile News Message Board | |
| Charts:- Daily , Weekly | |
| Add PBPB to Watchlist: View: Get Complete PBPB Trend Analysis ➞ | |
 | DEA Easterly Government Properties, Inc. |
| Sector: Financials | |
| SubSector: REIT - Office | |
| MarketCap: 1832.56 Millions | |
| Recent Price: 11.68 Smart Investing & Trading Score: 42 | |
| Day Percent Change: -0.09% Day Change: -0.01 | |
| Week Change: -0.09% Year-to-date Change: -13.1% | |
| DEA Links: Profile News Message Board | |
| Charts:- Daily , Weekly | |
| Add DEA to Watchlist: View: Get Complete DEA Trend Analysis ➞ | |
 | INTA Intapp, Inc. |
| Sector: Technology | |
| SubSector: Software - Application | |
| MarketCap: 2820 Millions | |
| Recent Price: 31.87 Smart Investing & Trading Score: 64 | |
| Day Percent Change: -0.09% Day Change: -0.03 | |
| Week Change: -0.09% Year-to-date Change: -16.5% | |
| INTA Links: Profile News Message Board | |
| Charts:- Daily , Weekly | |
| Add INTA to Watchlist: View: Get Complete INTA Trend Analysis ➞ | |
 | DLX Deluxe Corporation |
| Sector: Services & Goods | |
| SubSector: Business Services | |
| MarketCap: 1025.82 Millions | |
| Recent Price: 20.33 Smart Investing & Trading Score: 100 | |
| Day Percent Change: -0.10% Day Change: -0.02 | |
| Week Change: -0.1% Year-to-date Change: -5.2% | |
| DLX Links: Profile News Message Board | |
| Charts:- Daily , Weekly | |
| Add DLX to Watchlist: View: Get Complete DLX Trend Analysis ➞ | |
 | SHO Sunstone Hotel Investors, Inc. |
| Sector: Financials | |
| SubSector: REIT - Hotel/Motel | |
| MarketCap: 1861.04 Millions | |
| Recent Price: 10.29 Smart Investing & Trading Score: 10 | |
| Day Percent Change: -0.10% Day Change: -0.01 | |
| Week Change: -0.1% Year-to-date Change: -4.1% | |
| SHO Links: Profile News Message Board | |
| Charts:- Daily , Weekly | |
| Add SHO to Watchlist: View: Get Complete SHO Trend Analysis ➞ | |
 | AMSWA American Software, Inc. |
| Sector: Technology | |
| SubSector: Application Software | |
| MarketCap: 389.862 Millions | |
| Recent Price: 10.21 Smart Investing & Trading Score: 25 | |
| Day Percent Change: -0.10% Day Change: -0.01 | |
| Week Change: -0.1% Year-to-date Change: -9.7% | |
| AMSWA Links: Profile News Message Board | |
| Charts:- Daily , Weekly | |
| Add AMSWA to Watchlist: View: Get Complete AMSWA Trend Analysis ➞ | |
 | TNK Teekay Tankers Ltd. |
| Sector: Transports | |
| SubSector: Shipping | |
| MarketCap: 584.714 Millions | |
| Recent Price: 58.60 Smart Investing & Trading Score: 64 | |
| Day Percent Change: -0.10% Day Change: -0.06 | |
| Week Change: -0.1% Year-to-date Change: 17.3% | |
| TNK Links: Profile News Message Board | |
| Charts:- Daily , Weekly | |
| Add TNK to Watchlist: View: Get Complete TNK Trend Analysis ➞ | |
 | KREF KKR Real Estate Finance Trust Inc. |
| Sector: Financials | |
| SubSector: Mortgage Investment | |
| MarketCap: 645.939 Millions | |
| Recent Price: 9.61 Smart Investing & Trading Score: 32 | |
| Day Percent Change: -0.10% Day Change: -0.01 | |
| Week Change: -0.1% Year-to-date Change: -27.4% | |
| KREF Links: Profile News Message Board | |
| Charts:- Daily , Weekly | |
| Add KREF to Watchlist: View: Get Complete KREF Trend Analysis ➞ | |
| Too many stocks? View smallcap stocks filtered by marketcap & sector |
| Marketcap: All SmallCap Stocks (default-no microcap), Large, Mid-Range, Small & MicroCap |
| Sector: Tech, Finance, Energy, Staples, Retail, Industrial, Materials, Utilities & Medical |
|
Best Stocks Today 12Stocks.com |
© 2024 12Stocks.com Terms & Conditions Privacy Contact Us
All Information Provided Only For Education And Not To Be Used For Investing or Trading. See Terms & Conditions


One More Thing ... Get Best Stocks Delivered Daily!
Never Ever Miss A Move With Our Top Ten Stocks Lists
Find Best Stocks In Any Market - Bull or Bear Market
Take A Peek At Our Top Ten Stocks Lists: Daily, Weekly, Year-to-Date & Top Trends
Find Best Stocks In Any Market - Bull or Bear Market
Take A Peek At Our Top Ten Stocks Lists: Daily, Weekly, Year-to-Date & Top Trends
Smallcap Stocks With Best Up Trends [0-bearish to 100-bullish]: Bakkt [100], Deciphera [100], Phibro Animal[100], Heartland Financial[100], PTC [100], Sight Sciences[100], Richardson Electronics[100], Fulton Financial[100], TPI Composites[100], Cullinan Oncology[100], Lands [100]
Best Smallcap Stocks Year-to-Date:
CareMax [580.41%], Janux [421.92%], Bakkt [346.64%], Viking [305.75%], Longboard [247.46%], Alpine Immune[239.81%], Super Micro[213.22%], Avidity Biosciences[173.23%], Arcutis Bio[171.83%], Vera [167.31%], Cullinan Oncology[166.01%] Best Smallcap Stocks This Week:
Deciphera [72.56%], Phibro Animal[31.81%], Vaxxinity [31.65%], Zevia PBC[20.94%], Velo3D [19.97%], Acrivon [18.2%], Janux [18.18%], MultiPlan [15.53%], Heartland Financial[15.15%], Codexis [14.66%], Eyenovia [13.37%] Best Smallcap Stocks Daily:
Bakkt [2391.87%], Deciphera [72.56%], Phibro Animal[31.81%], Vaxxinity [31.65%], Zevia PBC[20.94%], Velo3D [19.97%], Acrivon [18.20%], Janux [18.18%], MultiPlan [15.53%], Heartland Financial[15.15%], Codexis [14.66%]