
 Login Sign Up


| |||||
 |  | ||||

| 12Stocks.com Market Intelligence |
Best SmallCap Stocks
|
| In a hurry? Small Cap Stock Lists: Performance Trends Table, Stock Charts
Sort Small Cap stocks: Daily, Weekly, Year-to-Date, Market Cap & Trends. Filter Small Cap stocks list by sector: Show all, Tech, Finance, Energy, Staples, Retail, Industrial, Materials, Utilities and HealthCare Filter Small Cap stocks list by size: All Large Medium Small and MicroCap |
| 12Stocks.com Small Cap Stocks Performances & Trends Daily | |||||||||
|
|  The overall Smart Investing & Trading Score is 82 (0-bearish to 100-bullish) which puts Small Cap index in short term bullish trend. The Smart Investing & Trading Score from previous trading session is 69 and hence an improvement of trend.
| ||||||||
Here are the Smart Investing & Trading Scores of the most requested small cap stocks at 12Stocks.com (click stock name for detailed review):
|


| 12Stocks.com: Investing in Smallcap Index with Stocks | |
|
The following table helps investors and traders sort through current performance and trends (as measured by Smart Investing & Trading Score) of various
stocks in the Smallcap Index. Quick View: Move mouse or cursor over stock symbol (ticker) to view short-term technical chart and over stock name to view long term chart. Click on  to add stock symbol to your watchlist and to add stock symbol to your watchlist and  to view watchlist. Click on any ticker or stock name for detailed market intelligence report for that stock. to view watchlist. Click on any ticker or stock name for detailed market intelligence report for that stock. |
12Stocks.com Performance of Stocks in Smallcap Index
| Ticker | Stock Name | Watchlist | Category | Recent Price | Smart Investing & Trading Score | Change % | Weekly Change% |
| VREX | Varex Imaging |   | Health Care | 15.82 | 10 | 1.48% | 1.48% |
| RPHM | Reneo | | Health Care | 1.75 | 100 | 1.45% | 1.45% |
| CTKB | Cytek Biosciences | | Health Care | 6.29 | 54 | 1.45% | 1.45% |
| REPL | Replimune Group | | Health Care | 7.05 | 74 | 1.44% | 1.44% |
| NHC | National HealthCare | | Health Care | 92.77 | 59 | 1.42% | 1.42% |
| INGN | Inogen | | Health Care | 7.25 | 100 | 1.40% | 1.40% |
| TMCI | Treace Medical | | Health Care | 10.99 | 60 | 1.34% | 1.34% |
| CIVI | Civitas Solutions | | Health Care | 76.50 | 29 | 1.32% | 1.32% |
| XERS | Xeris | | Health Care | 1.92 | 64 | 1.32% | 1.32% |
| AVAH | Aveanna Healthcare | | Health Care | 2.30 | 64 | 1.32% | 1.32% |
| MRSN | Mersana | | Health Care | 3.50 | 64 | 1.30% | 1.30% |
| MPLN | MultiPlan | | Health Care | 0.66 | 47 | 1.30% | 1.30% |
| INZY | Inozyme Pharma | | Health Care | 4.81 | 54 | 1.26% | 1.26% |
| TNGX | Tango | | Health Care | 7.67 | 59 | 1.25% | 1.25% |
| PETS | PetMed Express | | Health Care | 4.10 | 52 | 1.23% | 1.23% |
| NVAX | Novavax | | Health Care | 4.99 | 100 | 1.22% | 1.22% |
| NEOG | Neogen | | Health Care | 12.16 | 45 | 1.21% | 1.21% |
| CSTL | Castle Biosciences | | Health Care | 24.63 | 100 | 1.21% | 1.21% |
| SGHT | Sight Sciences | | Health Care | 5.87 | 95 | 1.21% | 1.21% |
| CLPT | ClearPoint Neuro | | Health Care | 5.94 | 74 | 1.19% | 1.19% |
| VAXX | Vaxxinity | | Health Care | 0.13 | 32 | 1.18% | 1.18% |
| USPH | U.S. Physical | | Health Care | 106.42 | 87 | 1.16% | 1.16% |
| OPK | OPKO Health | | Health Care | 1.31 | 95 | 1.15% | 1.15% |
| CDMO | Avid Bioservices | | Health Care | 8.35 | 95 | 1.15% | 1.15% |
| ANIK | Anika | | Health Care | 27.90 | 100 | 1.12% | 1.12% |
| For chart view version of above stock list: Chart View ➞ 0 - 25 , 25 - 50 , 50 - 75 , 75 - 100 , 100 - 125 , 125 - 150 , 150 - 175 , 175 - 200 , 200 - 225 , 225 - 250 , 250 - 275 , 275 - 300 , 300 - 325 , 325 - 350 | ||
 | Click To Change The Sort Order: By Market Cap or Company Size Performance: Year-to-date, Week and Day |  |
| Too many stocks? View smallcap stocks filtered by marketcap & sector |
| Marketcap: All SmallCap Stocks (default-no microcap), Large, Mid-Range, Small |
| Smallcap Sector: Tech, Finance, Energy, Staples, Retail, Industrial, Materials, & Medical |
|
Get the most comprehensive stock market coverage daily at 12Stocks.com ➞ Best Stocks Today ➞ Best Stocks Weekly ➞ Best Stocks Year-to-Date ➞ Best Stocks Trends ➞  Best Stocks Today 12Stocks.com Best Nasdaq Stocks ➞ Best S&P 500 Stocks ➞ Best Tech Stocks ➞ Best Biotech Stocks ➞ |
| Detailed Overview of SmallCap Stocks |
| SmallCap Technical Overview, Leaders & Laggards, Top SmallCap ETF Funds & Detailed SmallCap Stocks List, Charts, Trends & More |
| Smallcap: Technical Analysis, Trends & YTD Performance | |
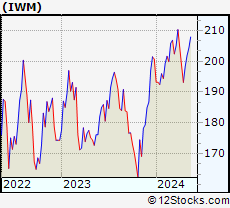
| SmallCap segment as represented by
IWM, an exchange-traded fund [ETF], holds basket of thousands of smallcap stocks from across all major sectors of the US stock market. The smallcap index (contains stocks like Riverbed & Sotheby's) is up by 1.65% and is currently underperforming the overall market by -5.9% year-to-date. Below is a quick view of technical charts and trends: | |
 IWM Weekly Chart |
|
| Long Term Trend: Very Good | |
| Medium Term Trend: Very Good | |
 IWM Daily Chart |
|
| Short Term Trend: Very Good | |
| Overall Trend Score: 82 | |
| YTD Performance: 1.65% | |
| **Trend Scores & Views Are Only For Educational Purposes And Not For Investing | |
| 12Stocks.com: Top Performing Small Cap Index Stocks | ||||||||||||||||||||||||||||||||||||||||||||||||
 The top performing Small Cap Index stocks year to date are
Now, more recently, over last week, the top performing Small Cap Index stocks on the move are


|
||||||||||||||||||||||||||||||||||||||||||||||||
| 12Stocks.com: Investing in Smallcap Index using Exchange Traded Funds | |
|
The following table shows list of key exchange traded funds (ETF) that
help investors track Smallcap index. The following list also includes leveraged ETF funds that track twice or thrice the daily returns of Smallcap indices. Short or inverse ETF funds move in the opposite direction to the index they track and are useful during market pullbacks or during bear markets. Quick View: Move mouse or cursor over ETF symbol (ticker) to view short-term technical chart and over ETF name to view long term chart. Click on ticker or stock name for detailed view. Click on to add stock symbol to your watchlist and to view watchlist. |
12Stocks.com List of ETFs that track Smallcap Index
| Ticker | ETF Name | Watchlist | Recent Price | Smart Investing & Trading Score | Change % | Week % | Year-to-date % |
| IWM | iShares Russell 2000 | | 204.03 | 82 | 1.05 | 1.05 | 1.65% |
| VTWO | Vanguard Russell 2000 ETF | | 82.61 | 82 | 1.23 | 1.23 | 1.86% |
| IJT | iShares S&P Small-Cap 600 Growth | | 128.77 | 95 | 0.79 | 0.79 | 2.9% |
| IJS | iShares S&P Small-Cap 600 Value | | 99.56 | 69 | 0.86 | 0.86 | -3.4% |
| SDD | ProShares UltraShort SmallCap600 | | 18.48 | 10 | -1.94 | -1.94 | 0.29% |
| XSLV | PowerShares S&P SmallCap Low Volatil ETF | | 43.48 | 87 | 0.60 | 0.6 | -1.52% |
| SAA | ProShares Ultra SmallCap600 | | 24.00 | 82 | 1.74 | 1.74 | -3.81% |
| SBB | ProShares Short SmallCap600 | | 16.05 | 13 | -0.68 | -0.68 | 0.75% |
| SMLV | SPDR SSGA US Small Cap Low Volatil ETF | | 109.69 | 87 | 0.00 | 0 | -2.52% |
| 12Stocks.com: Charts, Trends, Fundamental Data and Performances of SmallCap Stocks | |
|
We now take in-depth look at all SmallCap stocks including charts, multi-period performances and overall trends (as measured by Smart Investing & Trading Score). One can sort SmallCap stocks (click link to choose) by Daily, Weekly and by Year-to-Date performances. Also, one can sort by size of the company or by market capitalization. |
| Select Your Default Chart Type: | |||||
| |||||
| Click on stock symbol or name for detailed view. Click on to add stock symbol to your watchlist and to view watchlist. Quick View: Move mouse or cursor over "Daily" to quickly view daily technical stock chart and over "Weekly" to view weekly technical stock chart. | |||||

 | VREX Varex Imaging Corporation |
| Sector: Health Care | |
| SubSector: Medical Appliances & Equipment | |
| MarketCap: 718.78 Millions | |
| Recent Price: 15.82 Smart Investing & Trading Score: 10 | |
| Day Percent Change: 1.48% Day Change: 0.23 | |
| Week Change: 1.48% Year-to-date Change: -22.8% | |
| VREX Links: Profile News Message Board | |
| Charts:- Daily , Weekly | |
| Add VREX to Watchlist: View: Get Complete VREX Trend Analysis ➞ | |
 | RPHM Reneo Pharmaceuticals, Inc. |
| Sector: Health Care | |
| SubSector: Biotechnology | |
| MarketCap: 233 Millions | |
| Recent Price: 1.75 Smart Investing & Trading Score: 100 | |
| Day Percent Change: 1.45% Day Change: 0.02 | |
| Week Change: 1.45% Year-to-date Change: 8.3% | |
| RPHM Links: Profile News Message Board | |
| Charts:- Daily , Weekly | |
| Add RPHM to Watchlist: View: Get Complete RPHM Trend Analysis ➞ | |
 | CTKB Cytek Biosciences, Inc. |
| Sector: Health Care | |
| SubSector: Medical Devices | |
| MarketCap: 1140 Millions | |
| Recent Price: 6.29 Smart Investing & Trading Score: 54 | |
| Day Percent Change: 1.45% Day Change: 0.09 | |
| Week Change: 1.45% Year-to-date Change: -31.6% | |
| CTKB Links: Profile News Message Board | |
| Charts:- Daily , Weekly | |
| Add CTKB to Watchlist: View: Get Complete CTKB Trend Analysis ➞ | |
 | REPL Replimune Group, Inc. |
| Sector: Health Care | |
| SubSector: Biotechnology | |
| MarketCap: 367.885 Millions | |
| Recent Price: 7.05 Smart Investing & Trading Score: 74 | |
| Day Percent Change: 1.44% Day Change: 0.10 | |
| Week Change: 1.44% Year-to-date Change: -16.4% | |
| REPL Links: Profile News Message Board | |
| Charts:- Daily , Weekly | |
| Add REPL to Watchlist: View: Get Complete REPL Trend Analysis ➞ | |
 | NHC National HealthCare Corporation |
| Sector: Health Care | |
| SubSector: Long-Term Care Facilities | |
| MarketCap: 1164.86 Millions | |
| Recent Price: 92.77 Smart Investing & Trading Score: 59 | |
| Day Percent Change: 1.42% Day Change: 1.30 | |
| Week Change: 1.42% Year-to-date Change: 0.4% | |
| NHC Links: Profile News Message Board | |
| Charts:- Daily , Weekly | |
| Add NHC to Watchlist: View: Get Complete NHC Trend Analysis ➞ | |
 | INGN Inogen, Inc. |
| Sector: Health Care | |
| SubSector: Medical Instruments & Supplies | |
| MarketCap: 8803.6 Millions | |
| Recent Price: 7.25 Smart Investing & Trading Score: 100 | |
| Day Percent Change: 1.40% Day Change: 0.10 | |
| Week Change: 1.4% Year-to-date Change: 32.1% | |
| INGN Links: Profile News Message Board | |
| Charts:- Daily , Weekly | |
| Add INGN to Watchlist: View: Get Complete INGN Trend Analysis ➞ | |
 | TMCI Treace Medical Concepts, Inc. |
| Sector: Health Care | |
| SubSector: Medical Devices | |
| MarketCap: 1550 Millions | |
| Recent Price: 10.99 Smart Investing & Trading Score: 60 | |
| Day Percent Change: 1.34% Day Change: 0.14 | |
| Week Change: 1.34% Year-to-date Change: -13.7% | |
| TMCI Links: Profile News Message Board | |
| Charts:- Daily , Weekly | |
| Add TMCI to Watchlist: View: Get Complete TMCI Trend Analysis ➞ | |
 | CIVI Civitas Solutions, Inc. |
| Sector: Health Care | |
| SubSector: Long-Term Care Facilities | |
| MarketCap: 625.74 Millions | |
| Recent Price: 76.50 Smart Investing & Trading Score: 29 | |
| Day Percent Change: 1.32% Day Change: 1.00 | |
| Week Change: 1.32% Year-to-date Change: 11.9% | |
| CIVI Links: Profile News Message Board | |
| Charts:- Daily , Weekly | |
| Add CIVI to Watchlist: View: Get Complete CIVI Trend Analysis ➞ | |
 | XERS Xeris Pharmaceuticals, Inc. |
| Sector: Health Care | |
| SubSector: Biotechnology | |
| MarketCap: 74.5785 Millions | |
| Recent Price: 1.92 Smart Investing & Trading Score: 64 | |
| Day Percent Change: 1.32% Day Change: 0.03 | |
| Week Change: 1.32% Year-to-date Change: -18.7% | |
| XERS Links: Profile News Message Board | |
| Charts:- Daily , Weekly | |
| Add XERS to Watchlist: View: Get Complete XERS Trend Analysis ➞ | |
 | AVAH Aveanna Healthcare Holdings Inc. |
| Sector: Health Care | |
| SubSector: Medical Care Facilities | |
| MarketCap: 305 Millions | |
| Recent Price: 2.30 Smart Investing & Trading Score: 64 | |
| Day Percent Change: 1.32% Day Change: 0.03 | |
| Week Change: 1.32% Year-to-date Change: -14.7% | |
| AVAH Links: Profile News Message Board | |
| Charts:- Daily , Weekly | |
| Add AVAH to Watchlist: View: Get Complete AVAH Trend Analysis ➞ | |
 | MRSN Mersana Therapeutics, Inc. |
| Sector: Health Care | |
| SubSector: Biotechnology | |
| MarketCap: 224.385 Millions | |
| Recent Price: 3.50 Smart Investing & Trading Score: 64 | |
| Day Percent Change: 1.30% Day Change: 0.04 | |
| Week Change: 1.3% Year-to-date Change: 51.1% | |
| MRSN Links: Profile News Message Board | |
| Charts:- Daily , Weekly | |
| Add MRSN to Watchlist: View: Get Complete MRSN Trend Analysis ➞ | |
 | MPLN MultiPlan Corporation |
| Sector: Health Care | |
| SubSector: Healthcare Plans | |
| MarketCap: 56087 Millions | |
| Recent Price: 0.66 Smart Investing & Trading Score: 47 | |
| Day Percent Change: 1.30% Day Change: 0.01 | |
| Week Change: 1.3% Year-to-date Change: -54.0% | |
| MPLN Links: Profile News Message Board | |
| Charts:- Daily , Weekly | |
| Add MPLN to Watchlist: View: Get Complete MPLN Trend Analysis ➞ | |
 | INZY Inozyme Pharma, Inc. |
| Sector: Health Care | |
| SubSector: Biotechnology | |
| MarketCap: 53487 Millions | |
| Recent Price: 4.81 Smart Investing & Trading Score: 54 | |
| Day Percent Change: 1.26% Day Change: 0.06 | |
| Week Change: 1.26% Year-to-date Change: 13.0% | |
| INZY Links: Profile News Message Board | |
| Charts:- Daily , Weekly | |
| Add INZY to Watchlist: View: Get Complete INZY Trend Analysis ➞ | |
 | TNGX Tango Therapeutics, Inc. |
| Sector: Health Care | |
| SubSector: Biotechnology | |
| MarketCap: 302 Millions | |
| Recent Price: 7.67 Smart Investing & Trading Score: 59 | |
| Day Percent Change: 1.25% Day Change: 0.09 | |
| Week Change: 1.25% Year-to-date Change: -22.5% | |
| TNGX Links: Profile News Message Board | |
| Charts:- Daily , Weekly | |
| Add TNGX to Watchlist: View: Get Complete TNGX Trend Analysis ➞ | |
 | PETS PetMed Express, Inc. |
| Sector: Health Care | |
| SubSector: Drug Delivery | |
| MarketCap: 528.23 Millions | |
| Recent Price: 4.10 Smart Investing & Trading Score: 52 | |
| Day Percent Change: 1.23% Day Change: 0.05 | |
| Week Change: 1.23% Year-to-date Change: -45.8% | |
| PETS Links: Profile News Message Board | |
| Charts:- Daily , Weekly | |
| Add PETS to Watchlist: View: Get Complete PETS Trend Analysis ➞ | |
 | NVAX Novavax, Inc. |
| Sector: Health Care | |
| SubSector: Biotechnology | |
| MarketCap: 376.185 Millions | |
| Recent Price: 4.99 Smart Investing & Trading Score: 100 | |
| Day Percent Change: 1.22% Day Change: 0.06 | |
| Week Change: 1.22% Year-to-date Change: 4.0% | |
| NVAX Links: Profile News Message Board | |
| Charts:- Daily , Weekly | |
| Add NVAX to Watchlist: View: Get Complete NVAX Trend Analysis ➞ | |
 | NEOG Neogen Corporation |
| Sector: Health Care | |
| SubSector: Diagnostic Substances | |
| MarketCap: 3234.71 Millions | |
| Recent Price: 12.16 Smart Investing & Trading Score: 45 | |
| Day Percent Change: 1.21% Day Change: 0.14 | |
| Week Change: 1.21% Year-to-date Change: -39.5% | |
| NEOG Links: Profile News Message Board | |
| Charts:- Daily , Weekly | |
| Add NEOG to Watchlist: View: Get Complete NEOG Trend Analysis ➞ | |
 | CSTL Castle Biosciences, Inc. |
| Sector: Health Care | |
| SubSector: Medical Laboratories & Research | |
| MarketCap: 545 Millions | |
| Recent Price: 24.63 Smart Investing & Trading Score: 100 | |
| Day Percent Change: 1.21% Day Change: 0.30 | |
| Week Change: 1.21% Year-to-date Change: 14.1% | |
| CSTL Links: Profile News Message Board | |
| Charts:- Daily , Weekly | |
| Add CSTL to Watchlist: View: Get Complete CSTL Trend Analysis ➞ | |
 | SGHT Sight Sciences, Inc. |
| Sector: Health Care | |
| SubSector: Medical Devices | |
| MarketCap: 381 Millions | |
| Recent Price: 5.87 Smart Investing & Trading Score: 95 | |
| Day Percent Change: 1.21% Day Change: 0.07 | |
| Week Change: 1.21% Year-to-date Change: 13.7% | |
| SGHT Links: Profile News Message Board | |
| Charts:- Daily , Weekly | |
| Add SGHT to Watchlist: View: Get Complete SGHT Trend Analysis ➞ | |
 | CLPT ClearPoint Neuro, Inc. |
| Sector: Health Care | |
| SubSector: Medical Appliances & Equipment | |
| MarketCap: 55.108 Millions | |
| Recent Price: 5.94 Smart Investing & Trading Score: 74 | |
| Day Percent Change: 1.19% Day Change: 0.07 | |
| Week Change: 1.19% Year-to-date Change: -12.8% | |
| CLPT Links: Profile News Message Board | |
| Charts:- Daily , Weekly | |
| Add CLPT to Watchlist: View: Get Complete CLPT Trend Analysis ➞ | |
 | VAXX Vaxxinity, Inc. |
| Sector: Health Care | |
| SubSector: Biotechnology | |
| MarketCap: 320 Millions | |
| Recent Price: 0.13 Smart Investing & Trading Score: 32 | |
| Day Percent Change: 1.18% Day Change: 0.00 | |
| Week Change: 1.18% Year-to-date Change: -84.7% | |
| VAXX Links: Profile News Message Board | |
| Charts:- Daily , Weekly | |
| Add VAXX to Watchlist: View: Get Complete VAXX Trend Analysis ➞ | |
 | USPH U.S. Physical Therapy, Inc. |
| Sector: Health Care | |
| SubSector: Specialized Health Services | |
| MarketCap: 793.556 Millions | |
| Recent Price: 106.42 Smart Investing & Trading Score: 87 | |
| Day Percent Change: 1.16% Day Change: 1.22 | |
| Week Change: 1.16% Year-to-date Change: 14.3% | |
| USPH Links: Profile News Message Board | |
| Charts:- Daily , Weekly | |
| Add USPH to Watchlist: View: Get Complete USPH Trend Analysis ➞ | |
 | OPK OPKO Health, Inc. |
| Sector: Health Care | |
| SubSector: Biotechnology | |
| MarketCap: 1116.05 Millions | |
| Recent Price: 1.31 Smart Investing & Trading Score: 95 | |
| Day Percent Change: 1.15% Day Change: 0.01 | |
| Week Change: 1.15% Year-to-date Change: -12.9% | |
| OPK Links: Profile News Message Board | |
| Charts:- Daily , Weekly | |
| Add OPK to Watchlist: View: Get Complete OPK Trend Analysis ➞ | |
 | CDMO Avid Bioservices, Inc. |
| Sector: Health Care | |
| SubSector: Biotechnology | |
| MarketCap: 203.685 Millions | |
| Recent Price: 8.35 Smart Investing & Trading Score: 95 | |
| Day Percent Change: 1.15% Day Change: 0.10 | |
| Week Change: 1.15% Year-to-date Change: 28.4% | |
| CDMO Links: Profile News Message Board | |
| Charts:- Daily , Weekly | |
| Add CDMO to Watchlist: View: Get Complete CDMO Trend Analysis ➞ | |
 | ANIK Anika Therapeutics, Inc. |
| Sector: Health Care | |
| SubSector: Biotechnology | |
| MarketCap: 438.385 Millions | |
| Recent Price: 27.90 Smart Investing & Trading Score: 100 | |
| Day Percent Change: 1.12% Day Change: 0.31 | |
| Week Change: 1.12% Year-to-date Change: 23.1% | |
| ANIK Links: Profile News Message Board | |
| Charts:- Daily , Weekly | |
| Add ANIK to Watchlist: View: Get Complete ANIK Trend Analysis ➞ | |
| For tabular summary view of above stock list: Summary View ➞ 0 - 25 , 25 - 50 , 50 - 75 , 75 - 100 , 100 - 125 , 125 - 150 , 150 - 175 , 175 - 200 , 200 - 225 , 225 - 250 , 250 - 275 , 275 - 300 , 300 - 325 , 325 - 350 | ||
| Click To Change The Sort Order: By Market Cap or Company Size Performance: Year-to-date, Week and Day | |
| Select Chart Type: | ||
| Too many stocks? View smallcap stocks filtered by marketcap & sector |
| Marketcap: All SmallCap Stocks (default-no microcap), Large, Mid-Range, Small & MicroCap |
| Sector: Tech, Finance, Energy, Staples, Retail, Industrial, Materials, Utilities & Medical |
|
Best Stocks Today 12Stocks.com |
© 2024 12Stocks.com Terms & Conditions Privacy Contact Us
All Information Provided Only For Education And Not To Be Used For Investing or Trading. See Terms & Conditions


One More Thing ... Get Best Stocks Delivered Daily!
Never Ever Miss A Move With Our Top Ten Stocks Lists
Find Best Stocks In Any Market - Bull or Bear Market
Take A Peek At Our Top Ten Stocks Lists: Daily, Weekly, Year-to-Date & Top Trends
Find Best Stocks In Any Market - Bull or Bear Market
Take A Peek At Our Top Ten Stocks Lists: Daily, Weekly, Year-to-Date & Top Trends
Smallcap Stocks With Best Up Trends [0-bearish to 100-bullish]: Perficient [100], Outset Medical[100], Emergent BioSolutions[100], Dakota Gold[100], Twist Bioscience[100], TPI Composites[100], biote [100], Willdan Group[100], IES [100], Wolverine World[100], PMV [100]
Best Smallcap Stocks Year-to-Date:
Janux [456.49%], Longboard [243.86%], Alpine Immune[239.13%], Bakkt [200.9%], Avidity Biosciences[185.12%], Super Micro[183.18%], Vera [177.45%], Cullinan Oncology[170.38%], Y-mAbs [148.97%], Sana [146.43%], Arcutis Bio[140.71%] Best Smallcap Stocks This Week:
Perficient [52.9%], Outset Medical[36.58%], BioCryst [18.43%], P3 Health[18.33%], Pacific Biosciences[15.57%], Emergent BioSolutions[13.11%], SelectQuote [12.25%], ThredUp [12.24%], Genelux [12.13%], Virgin Galactic[11.81%], Nuvectis Pharma[11.79%] Best Smallcap Stocks Daily:
Perficient [52.90%], Outset Medical[36.58%], BioCryst [18.43%], P3 Health[18.33%], Pacific Biosciences[15.57%], Emergent BioSolutions[13.11%], SelectQuote [12.25%], ThredUp [12.24%], Genelux [12.13%], Virgin Galactic[11.81%], Nuvectis Pharma[11.79%]