
 Login Sign Up


| |||||
 |  | ||||

| 12Stocks.com Market Intelligence |
Best SmallCap Stocks
|
| In a hurry? Small Cap Stock Lists: Performance Trends Table, Stock Charts
Sort Small Cap stocks: Daily, Weekly, Year-to-Date, Market Cap & Trends. Filter Small Cap stocks list by sector: Show all, Tech, Finance, Energy, Staples, Retail, Industrial, Materials, Utilities and HealthCare Filter Small Cap stocks list by size: All Large Medium Small and MicroCap |
| 12Stocks.com Small Cap Stocks Performances & Trends Daily | |||||||||
|
|  The overall Smart Investing & Trading Score is 82 (0-bearish to 100-bullish) which puts Small Cap index in short term bullish trend. The Smart Investing & Trading Score from previous trading session is 69 and hence an improvement of trend.
| ||||||||
Here are the Smart Investing & Trading Scores of the most requested small cap stocks at 12Stocks.com (click stock name for detailed review):
|


| 12Stocks.com: Investing in Smallcap Index with Stocks | |
|
The following table helps investors and traders sort through current performance and trends (as measured by Smart Investing & Trading Score) of various
stocks in the Smallcap Index. Quick View: Move mouse or cursor over stock symbol (ticker) to view short-term technical chart and over stock name to view long term chart. Click on  to add stock symbol to your watchlist and to add stock symbol to your watchlist and  to view watchlist. Click on any ticker or stock name for detailed market intelligence report for that stock. to view watchlist. Click on any ticker or stock name for detailed market intelligence report for that stock. |
12Stocks.com Performance of Stocks in Smallcap Index
| Ticker | Stock Name | Watchlist | Category | Recent Price | Smart Investing & Trading Score | Change % | Weekly Change% |
| PAHC | Phibro Animal |   | Health Care | 16.41 | 88 | -3.87% | -3.87% |
| ORGO | Organogenesis | | Health Care | 2.39 | 20 | -4.02% | -4.02% |
| ME | 23andMe Holding | | Health Care | 0.49 | 52 | -4.17% | -4.17% |
| DSGN | Design | | Health Care | 3.64 | 69 | -4.21% | -4.21% |
| VTYX | Ventyx Biosciences | | Health Care | 4.72 | 50 | -4.26% | -4.26% |
| SGMO | Sangamo | | Health Care | 0.53 | 47 | -4.82% | -4.82% |
| ATRA | Atara Bio | | Health Care | 0.64 | 28 | -4.87% | -4.87% |
| SAGE | Sage | | Health Care | 13.25 | 45 | -4.95% | -4.95% |
| KZR | Kezar Life | | Health Care | 0.81 | 40 | -4.99% | -4.99% |
| ORIC | ORIC | | Health Care | 9.21 | 37 | -5.15% | -5.15% |
| QSI | Quantum-Si | | Health Care | 1.84 | 88 | -5.15% | -5.15% |
| GERN | Geron | | Health Care | 3.73 | 51 | -5.22% | -5.22% |
| OCUL | Ocular Therapeutix | | Health Care | 5.80 | 57 | -5.92% | -5.92% |
| DAWN | Day One | | Health Care | 16.59 | 55 | -6.46% | -6.46% |
| WVE | Wave Life | | Health Care | 5.73 | 88 | -6.68% | -6.68% |
| BFLY | Butterfly | | Health Care | 0.97 | 74 | -7.10% | -7.10% |
| CDXS | Codexis | | Health Care | 3.57 | 74 | -8.93% | -8.93% |
| LBPH | Longboard | | Health Care | 20.61 | 32 | -9.45% | -9.45% |
| EYEN | Eyenovia | | Health Care | 0.87 | 67 | -13.51% | -13.51% |
| CMAX | CareMax | | Health Care | 2.96 | 32 | -14.06% | -14.06% |
| CVRX | CVRx | | Health Care | 7.96 | 0 | -15.00% | -15.00% |
| OMGA | Omega | | Health Care | 2.27 | 7 | -16.67% | -16.67% |
| EYPT | EyePoint | | Health Care | 11.17 | 0 | -43.41% | -43.41% |
| For chart view version of above stock list: Chart View ➞ 0 - 25 , 25 - 50 , 50 - 75 , 75 - 100 , 100 - 125 , 125 - 150 , 150 - 175 , 175 - 200 , 200 - 225 , 225 - 250 , 250 - 275 , 275 - 300 , 300 - 325 , 325 - 350 | ||
 | Click To Change The Sort Order: By Market Cap or Company Size Performance: Year-to-date, Week and Day |  |
| Too many stocks? View smallcap stocks filtered by marketcap & sector |
| Marketcap: All SmallCap Stocks (default-no microcap), Large, Mid-Range, Small |
| Smallcap Sector: Tech, Finance, Energy, Staples, Retail, Industrial, Materials, & Medical |
|
Get the most comprehensive stock market coverage daily at 12Stocks.com ➞ Best Stocks Today ➞ Best Stocks Weekly ➞ Best Stocks Year-to-Date ➞ Best Stocks Trends ➞  Best Stocks Today 12Stocks.com Best Nasdaq Stocks ➞ Best S&P 500 Stocks ➞ Best Tech Stocks ➞ Best Biotech Stocks ➞ |
| Detailed Overview of SmallCap Stocks |
| SmallCap Technical Overview, Leaders & Laggards, Top SmallCap ETF Funds & Detailed SmallCap Stocks List, Charts, Trends & More |
| Smallcap: Technical Analysis, Trends & YTD Performance | |
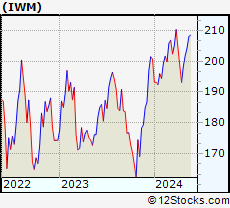
| SmallCap segment as represented by
IWM, an exchange-traded fund [ETF], holds basket of thousands of smallcap stocks from across all major sectors of the US stock market. The smallcap index (contains stocks like Riverbed & Sotheby's) is up by 1.89% and is currently underperforming the overall market by -6.13% year-to-date. Below is a quick view of technical charts and trends: | |
 IWM Weekly Chart |
|
| Long Term Trend: Very Good | |
| Medium Term Trend: Very Good | |
 IWM Daily Chart |
|
| Short Term Trend: Very Good | |
| Overall Trend Score: 82 | |
| YTD Performance: 1.89% | |
| **Trend Scores & Views Are Only For Educational Purposes And Not For Investing | |
| 12Stocks.com: Top Performing Small Cap Index Stocks | ||||||||||||||||||||||||||||||||||||||||||||||||
 The top performing Small Cap Index stocks year to date are
Now, more recently, over last week, the top performing Small Cap Index stocks on the move are


|
||||||||||||||||||||||||||||||||||||||||||||||||
| 12Stocks.com: Investing in Smallcap Index using Exchange Traded Funds | |
|
The following table shows list of key exchange traded funds (ETF) that
help investors track Smallcap index. The following list also includes leveraged ETF funds that track twice or thrice the daily returns of Smallcap indices. Short or inverse ETF funds move in the opposite direction to the index they track and are useful during market pullbacks or during bear markets. Quick View: Move mouse or cursor over ETF symbol (ticker) to view short-term technical chart and over ETF name to view long term chart. Click on ticker or stock name for detailed view. Click on to add stock symbol to your watchlist and to view watchlist. |
12Stocks.com List of ETFs that track Smallcap Index
| Ticker | ETF Name | Watchlist | Recent Price | Smart Investing & Trading Score | Change % | Week % | Year-to-date % |
| IWM | iShares Russell 2000 | | 204.51 | 82 | 1.29 | 1.29 | 1.89% |
| IJR | iShares Core S&P Small-Cap | | 108.26 | 47 | 1.05 | 1.05 | 0.01% |
| VTWO | Vanguard Russell 2000 ETF | | 82.59 | 82 | 1.20 | 1.2 | 1.84% |
| IWN | iShares Russell 2000 Value | | 155.65 | 65 | 0.93 | 0.93 | 0.21% |
| IWO | iShares Russell 2000 Growth | | 261.01 | 29 | 1.61 | 1.61 | 3.49% |
| IJS | iShares S&P Small-Cap 600 Value | | 99.75 | 69 | 1.04 | 1.04 | -3.22% |
| IJT | iShares S&P Small-Cap 600 Growth | | 129.04 | 95 | 1.00 | 1 | 3.12% |
| XSLV | PowerShares S&P SmallCap Low Volatil ETF | | 43.52 | 87 | 0.69 | 0.69 | -1.43% |
| SAA | ProShares Ultra SmallCap600 | | 24.10 | 82 | 2.16 | 2.16 | -3.41% |
| SDD | ProShares UltraShort SmallCap600 | | 18.42 | 10 | -2.26 | -2.26 | -0.04% |
| SBB | ProShares Short SmallCap600 | | 16.05 | 13 | -0.67 | -0.67 | 0.76% |
| SMLV | SPDR SSGA US Small Cap Low Volatil ETF | | 110.59 | 87 | 0.83 | 0.83 | -1.72% |
| 12Stocks.com: Charts, Trends, Fundamental Data and Performances of SmallCap Stocks | |
|
We now take in-depth look at all SmallCap stocks including charts, multi-period performances and overall trends (as measured by Smart Investing & Trading Score). One can sort SmallCap stocks (click link to choose) by Daily, Weekly and by Year-to-Date performances. Also, one can sort by size of the company or by market capitalization. |
| Select Your Default Chart Type: | |||||
| |||||
| Click on stock symbol or name for detailed view. Click on to add stock symbol to your watchlist and to view watchlist. Quick View: Move mouse or cursor over "Daily" to quickly view daily technical stock chart and over "Weekly" to view weekly technical stock chart. | |||||

 | PAHC Phibro Animal Health Corporation |
| Sector: Health Care | |
| SubSector: Specialized Health Services | |
| MarketCap: 852.956 Millions | |
| Recent Price: 16.41 Smart Investing & Trading Score: 88 | |
| Day Percent Change: -3.87% Day Change: -0.66 | |
| Week Change: -3.87% Year-to-date Change: 41.7% | |
| PAHC Links: Profile News Message Board | |
| Charts:- Daily , Weekly | |
| Add PAHC to Watchlist: View: Get Complete PAHC Trend Analysis ➞ | |
 | ORGO Organogenesis Holdings Inc. |
| Sector: Health Care | |
| SubSector: Drugs - Generic | |
| MarketCap: 239.685 Millions | |
| Recent Price: 2.39 Smart Investing & Trading Score: 20 | |
| Day Percent Change: -4.02% Day Change: -0.10 | |
| Week Change: -4.02% Year-to-date Change: -41.6% | |
| ORGO Links: Profile News Message Board | |
| Charts:- Daily , Weekly | |
| Add ORGO to Watchlist: View: Get Complete ORGO Trend Analysis ➞ | |
 | ME 23andMe Holding Co. |
| Sector: Health Care | |
| SubSector: Diagnostics & Research | |
| MarketCap: 802 Millions | |
| Recent Price: 0.49 Smart Investing & Trading Score: 52 | |
| Day Percent Change: -4.17% Day Change: -0.02 | |
| Week Change: -4.17% Year-to-date Change: -44.9% | |
| ME Links: Profile News Message Board | |
| Charts:- Daily , Weekly | |
| Add ME to Watchlist: View: Get Complete ME Trend Analysis ➞ | |
 | DSGN Design Therapeutics, Inc. |
| Sector: Health Care | |
| SubSector: Biotechnology | |
| MarketCap: 367 Millions | |
| Recent Price: 3.64 Smart Investing & Trading Score: 69 | |
| Day Percent Change: -4.21% Day Change: -0.16 | |
| Week Change: -4.21% Year-to-date Change: 37.1% | |
| DSGN Links: Profile News Message Board | |
| Charts:- Daily , Weekly | |
| Add DSGN to Watchlist: View: Get Complete DSGN Trend Analysis ➞ | |
 | VTYX Ventyx Biosciences, Inc. |
| Sector: Health Care | |
| SubSector: Biotechnology | |
| MarketCap: 1950 Millions | |
| Recent Price: 4.72 Smart Investing & Trading Score: 50 | |
| Day Percent Change: -4.26% Day Change: -0.21 | |
| Week Change: -4.26% Year-to-date Change: 90.7% | |
| VTYX Links: Profile News Message Board | |
| Charts:- Daily , Weekly | |
| Add VTYX to Watchlist: View: Get Complete VTYX Trend Analysis ➞ | |
 | SGMO Sangamo Therapeutics, Inc. |
| Sector: Health Care | |
| SubSector: Biotechnology | |
| MarketCap: 779.285 Millions | |
| Recent Price: 0.53 Smart Investing & Trading Score: 47 | |
| Day Percent Change: -4.82% Day Change: -0.03 | |
| Week Change: -4.82% Year-to-date Change: -2.6% | |
| SGMO Links: Profile News Message Board | |
| Charts:- Daily , Weekly | |
| Add SGMO to Watchlist: View: Get Complete SGMO Trend Analysis ➞ | |
 | ATRA Atara Biotherapeutics, Inc. |
| Sector: Health Care | |
| SubSector: Biotechnology | |
| MarketCap: 579.185 Millions | |
| Recent Price: 0.64 Smart Investing & Trading Score: 28 | |
| Day Percent Change: -4.87% Day Change: -0.03 | |
| Week Change: -4.87% Year-to-date Change: 24.3% | |
| ATRA Links: Profile News Message Board | |
| Charts:- Daily , Weekly | |
| Add ATRA to Watchlist: View: Get Complete ATRA Trend Analysis ➞ | |
 | SAGE Sage Therapeutics, Inc. |
| Sector: Health Care | |
| SubSector: Biotechnology | |
| MarketCap: 1683.75 Millions | |
| Recent Price: 13.25 Smart Investing & Trading Score: 45 | |
| Day Percent Change: -4.95% Day Change: -0.69 | |
| Week Change: -4.95% Year-to-date Change: -38.9% | |
| SAGE Links: Profile News Message Board | |
| Charts:- Daily , Weekly | |
| Add SAGE to Watchlist: View: Get Complete SAGE Trend Analysis ➞ | |
 | KZR Kezar Life Sciences, Inc. |
| Sector: Health Care | |
| SubSector: Biotechnology | |
| MarketCap: 174.885 Millions | |
| Recent Price: 0.81 Smart Investing & Trading Score: 40 | |
| Day Percent Change: -4.99% Day Change: -0.04 | |
| Week Change: -4.99% Year-to-date Change: -14.0% | |
| KZR Links: Profile News Message Board | |
| Charts:- Daily , Weekly | |
| Add KZR to Watchlist: View: Get Complete KZR Trend Analysis ➞ | |
 | ORIC ORIC Pharmaceuticals, Inc. |
| Sector: Health Care | |
| SubSector: Biotechnology | |
| MarketCap: 12787 Millions | |
| Recent Price: 9.21 Smart Investing & Trading Score: 37 | |
| Day Percent Change: -5.15% Day Change: -0.50 | |
| Week Change: -5.15% Year-to-date Change: -0.1% | |
| ORIC Links: Profile News Message Board | |
| Charts:- Daily , Weekly | |
| Add ORIC to Watchlist: View: Get Complete ORIC Trend Analysis ➞ | |
 | QSI Quantum-Si incorporated |
| Sector: Health Care | |
| SubSector: Biotechnology | |
| MarketCap: 256 Millions | |
| Recent Price: 1.84 Smart Investing & Trading Score: 88 | |
| Day Percent Change: -5.15% Day Change: -0.10 | |
| Week Change: -5.15% Year-to-date Change: -8.5% | |
| QSI Links: Profile News Message Board | |
| Charts:- Daily , Weekly | |
| Add QSI to Watchlist: View: Get Complete QSI Trend Analysis ➞ | |
 | GERN Geron Corporation |
| Sector: Health Care | |
| SubSector: Biotechnology | |
| MarketCap: 228.685 Millions | |
| Recent Price: 3.73 Smart Investing & Trading Score: 51 | |
| Day Percent Change: -5.22% Day Change: -0.21 | |
| Week Change: -5.22% Year-to-date Change: 76.5% | |
| GERN Links: Profile News Message Board | |
| Charts:- Daily , Weekly | |
| Add GERN to Watchlist: View: Get Complete GERN Trend Analysis ➞ | |
 | OCUL Ocular Therapeutix, Inc. |
| Sector: Health Care | |
| SubSector: Biotechnology | |
| MarketCap: 249.985 Millions | |
| Recent Price: 5.80 Smart Investing & Trading Score: 57 | |
| Day Percent Change: -5.92% Day Change: -0.37 | |
| Week Change: -5.92% Year-to-date Change: 30.2% | |
| OCUL Links: Profile News Message Board | |
| Charts:- Daily , Weekly | |
| Add OCUL to Watchlist: View: Get Complete OCUL Trend Analysis ➞ | |
 | DAWN Day One Biopharmaceuticals, Inc. |
| Sector: Health Care | |
| SubSector: Biotechnology | |
| MarketCap: 1040 Millions | |
| Recent Price: 16.59 Smart Investing & Trading Score: 55 | |
| Day Percent Change: -6.46% Day Change: -1.14 | |
| Week Change: -6.46% Year-to-date Change: 12.9% | |
| DAWN Links: Profile News Message Board | |
| Charts:- Daily , Weekly | |
| Add DAWN to Watchlist: View: Get Complete DAWN Trend Analysis ➞ | |
 | WVE Wave Life Sciences Ltd. |
| Sector: Health Care | |
| SubSector: Biotechnology | |
| MarketCap: 452.785 Millions | |
| Recent Price: 5.73 Smart Investing & Trading Score: 88 | |
| Day Percent Change: -6.68% Day Change: -0.41 | |
| Week Change: -6.68% Year-to-date Change: 13.5% | |
| WVE Links: Profile News Message Board | |
| Charts:- Daily , Weekly | |
| Add WVE to Watchlist: View: Get Complete WVE Trend Analysis ➞ | |
 | BFLY Butterfly Network, Inc. |
| Sector: Health Care | |
| SubSector: Medical Devices | |
| MarketCap: 461 Millions | |
| Recent Price: 0.97 Smart Investing & Trading Score: 74 | |
| Day Percent Change: -7.10% Day Change: -0.07 | |
| Week Change: -7.1% Year-to-date Change: -14.1% | |
| BFLY Links: Profile News Message Board | |
| Charts:- Daily , Weekly | |
| Add BFLY to Watchlist: View: Get Complete BFLY Trend Analysis ➞ | |
 | CDXS Codexis, Inc. |
| Sector: Health Care | |
| SubSector: Biotechnology | |
| MarketCap: 592.185 Millions | |
| Recent Price: 3.57 Smart Investing & Trading Score: 74 | |
| Day Percent Change: -8.93% Day Change: -0.35 | |
| Week Change: -8.93% Year-to-date Change: 17.1% | |
| CDXS Links: Profile News Message Board | |
| Charts:- Daily , Weekly | |
| Add CDXS to Watchlist: View: Get Complete CDXS Trend Analysis ➞ | |
 | LBPH Longboard Pharmaceuticals, Inc. |
| Sector: Health Care | |
| SubSector: Biotechnology | |
| MarketCap: 169 Millions | |
| Recent Price: 20.61 Smart Investing & Trading Score: 32 | |
| Day Percent Change: -9.45% Day Change: -2.15 | |
| Week Change: -9.45% Year-to-date Change: 237.3% | |
| LBPH Links: Profile News Message Board | |
| Charts:- Daily , Weekly | |
| Add LBPH to Watchlist: View: Get Complete LBPH Trend Analysis ➞ | |
 | EYEN Eyenovia, Inc. |
| Sector: Health Care | |
| SubSector: Biotechnology | |
| MarketCap: 52.2785 Millions | |
| Recent Price: 0.87 Smart Investing & Trading Score: 67 | |
| Day Percent Change: -13.51% Day Change: -0.14 | |
| Week Change: -13.51% Year-to-date Change: -58.2% | |
| EYEN Links: Profile News Message Board | |
| Charts:- Daily , Weekly | |
| Add EYEN to Watchlist: View: Get Complete EYEN Trend Analysis ➞ | |
 | CMAX CareMax, Inc. |
| Sector: Health Care | |
| SubSector: Health Information Services | |
| MarketCap: 371 Millions | |
| Recent Price: 2.96 Smart Investing & Trading Score: 32 | |
| Day Percent Change: -14.06% Day Change: -0.49 | |
| Week Change: -14.06% Year-to-date Change: 511.3% | |
| CMAX Links: Profile News Message Board | |
| Charts:- Daily , Weekly | |
| Add CMAX to Watchlist: View: Get Complete CMAX Trend Analysis ➞ | |
 | CVRX CVRx, Inc. |
| Sector: Health Care | |
| SubSector: Medical Devices | |
| MarketCap: 327 Millions | |
| Recent Price: 7.96 Smart Investing & Trading Score: 0 | |
| Day Percent Change: -15.00% Day Change: -1.41 | |
| Week Change: -15% Year-to-date Change: -74.7% | |
| CVRX Links: Profile News Message Board | |
| Charts:- Daily , Weekly | |
| Add CVRX to Watchlist: View: Get Complete CVRX Trend Analysis ➞ | |
 | OMGA Omega Therapeutics, Inc. |
| Sector: Health Care | |
| SubSector: Biotechnology | |
| MarketCap: 304 Millions | |
| Recent Price: 2.27 Smart Investing & Trading Score: 7 | |
| Day Percent Change: -16.67% Day Change: -0.46 | |
| Week Change: -16.67% Year-to-date Change: -24.4% | |
| OMGA Links: Profile News Message Board | |
| Charts:- Daily , Weekly | |
| Add OMGA to Watchlist: View: Get Complete OMGA Trend Analysis ➞ | |
 | EYPT EyePoint Pharmaceuticals, Inc. |
| Sector: Health Care | |
| SubSector: Biotechnology | |
| MarketCap: 125.085 Millions | |
| Recent Price: 11.17 Smart Investing & Trading Score: 0 | |
| Day Percent Change: -43.41% Day Change: -8.57 | |
| Week Change: -43.41% Year-to-date Change: -51.7% | |
| EYPT Links: Profile News Message Board | |
| Charts:- Daily , Weekly | |
| Add EYPT to Watchlist: View: Get Complete EYPT Trend Analysis ➞ | |
| For tabular summary view of above stock list: Summary View ➞ 0 - 25 , 25 - 50 , 50 - 75 , 75 - 100 , 100 - 125 , 125 - 150 , 150 - 175 , 175 - 200 , 200 - 225 , 225 - 250 , 250 - 275 , 275 - 300 , 300 - 325 , 325 - 350 | ||
| Click To Change The Sort Order: By Market Cap or Company Size Performance: Year-to-date, Week and Day | |
| Select Chart Type: | ||
| Too many stocks? View smallcap stocks filtered by marketcap & sector |
| Marketcap: All SmallCap Stocks (default-no microcap), Large, Mid-Range, Small & MicroCap |
| Sector: Tech, Finance, Energy, Staples, Retail, Industrial, Materials, Utilities & Medical |
|
Best Stocks Today 12Stocks.com |
© 2024 12Stocks.com Terms & Conditions Privacy Contact Us
All Information Provided Only For Education And Not To Be Used For Investing or Trading. See Terms & Conditions


One More Thing ... Get Best Stocks Delivered Daily!
Never Ever Miss A Move With Our Top Ten Stocks Lists
Find Best Stocks In Any Market - Bull or Bear Market
Take A Peek At Our Top Ten Stocks Lists: Daily, Weekly, Year-to-Date & Top Trends
Find Best Stocks In Any Market - Bull or Bear Market
Take A Peek At Our Top Ten Stocks Lists: Daily, Weekly, Year-to-Date & Top Trends
Smallcap Stocks With Best Up Trends [0-bearish to 100-bullish]: Perficient [100], Outset Medical[100], Dakota Gold[100], PMV [100], Twist Bioscience[100], SilverBow Resources[100], Regional Management[100], TPI Composites[100], AeroVironment [100], Solid Power[100], Wolverine World[100]
Best Smallcap Stocks Year-to-Date:
CareMax [511.34%], Janux [479.25%], Viking [320.15%], Alpine Immune[239.29%], Longboard [237.32%], Bakkt [197.53%], Vera [194.15%], Super Micro[192.28%], Avidity Biosciences[189.6%], Cullinan Oncology[178.76%], Y-mAbs [153.23%] Best Smallcap Stocks This Week:
Perficient [52.24%], P3 Health[25.16%], Outset Medical[23%], Lineage Cell[22.64%], SoundHound AI[19.54%], DASAN Zhone[19.25%], Workhorse Group[19.13%], BioCryst [18.65%], Marathon Patent[18.09%], Aceto [17.24%], Assertio [16.99%] Best Smallcap Stocks Daily:
Perficient [52.24%], P3 Health[25.16%], Outset Medical[23.00%], Lineage Cell[22.64%], SoundHound AI[19.54%], DASAN Zhone[19.25%], Workhorse Group[19.13%], BioCryst [18.65%], Marathon Patent[18.09%], Aceto [17.24%], Assertio [16.99%]