
 Login Sign Up


| |||||
 |  | ||||

| 12Stocks.com Market Intelligence |
Best SmallCap Stocks
|
| In a hurry? Small Cap Stock Lists: Performance Trends Table, Stock Charts
Sort Small Cap stocks: Daily, Weekly, Year-to-Date, Market Cap & Trends. Filter Small Cap stocks list by sector: Show all, Tech, Finance, Energy, Staples, Retail, Industrial, Materials, Utilities and HealthCare Filter Small Cap stocks list by size: All Large Medium Small and MicroCap |
| 12Stocks.com Small Cap Stocks Performances & Trends Daily | |||||||||
|
|  The overall Smart Investing & Trading Score is 69 (0-bearish to 100-bullish) which puts Small Cap index in short term neutral to bullish trend. The Smart Investing & Trading Score from previous trading session is 49 and hence an improvement of trend.
| ||||||||
Here are the Smart Investing & Trading Scores of the most requested small cap stocks at 12Stocks.com (click stock name for detailed review):
|


| 12Stocks.com: Investing in Smallcap Index with Stocks | |
|
The following table helps investors and traders sort through current performance and trends (as measured by Smart Investing & Trading Score) of various
stocks in the Smallcap Index. Quick View: Move mouse or cursor over stock symbol (ticker) to view short-term technical chart and over stock name to view long term chart. Click on  to add stock symbol to your watchlist and to add stock symbol to your watchlist and  to view watchlist. Click on any ticker or stock name for detailed market intelligence report for that stock. to view watchlist. Click on any ticker or stock name for detailed market intelligence report for that stock. |
12Stocks.com Performance of Stocks in Smallcap Index
| Ticker | Stock Name | Watchlist | Category | Recent Price | Smart Investing & Trading Score | Change % | Weekly Change% |
| NVRO | Nevro |   | Health Care | 11.17 | 52 | -1.06% | -1.06% |
| SCPH | sc | | Health Care | 4.61 | 59 | -1.07% | -1.07% |
| EMBC | Embecta | | Health Care | 10.15 | 60 | -1.07% | -1.07% |
| IKNA | Ikena Oncology | | Health Care | 1.32 | 50 | -1.12% | -1.12% |
| ALLO | Allogene | | Health Care | 3.04 | 37 | -1.14% | -1.14% |
| LXRX | Lexicon | | Health Care | 1.72 | 32 | -1.15% | -1.15% |
| MLYS | Mineralys | | Health Care | 13.00 | 74 | -1.18% | -1.18% |
| RXRX | Recursion | | Health Care | 8.99 | 64 | -1.21% | -1.21% |
| YMAB | Y-mAbs | | Health Care | 16.94 | 95 | -1.22% | -1.22% |
| PSTX | Poseida | | Health Care | 2.85 | 64 | -1.22% | -1.22% |
| RYTM | Rhythm | | Health Care | 43.22 | 90 | -1.23% | -1.23% |
| AMWL | American Well | | Health Care | 0.56 | 55 | -1.25% | -1.25% |
| DYN | Dyne | | Health Care | 25.74 | 34 | -1.30% | -1.30% |
| VERV | Verve | | Health Care | 6.44 | 42 | -1.38% | -1.38% |
| CUE | Cue Biopharma | | Health Care | 2.10 | 95 | -1.41% | -1.41% |
| RVMD | Revolution Medicines | | Health Care | 39.63 | 100 | -1.42% | -1.42% |
| ALEC | Alector | | Health Care | 5.31 | 54 | -1.48% | -1.48% |
| XNCR | Xencor | | Health Care | 23.75 | 100 | -1.49% | -1.49% |
| GERN | Geron | | Health Care | 3.87 | 63 | -1.53% | -1.53% |
| SCLX | Scilex Holding | | Health Care | 0.86 | 42 | -1.53% | -1.53% |
| ENTA | Enanta | | Health Care | 14.94 | 80 | -1.55% | -1.55% |
| ORGO | Organogenesis | | Health Care | 2.45 | 42 | -1.61% | -1.61% |
| EWTX | Edgewise | | Health Care | 19.55 | 95 | -1.64% | -1.64% |
| ME | 23andMe Holding | | Health Care | 0.50 | 59 | -1.66% | -1.66% |
| RNA | Avidity Biosciences | | Health Care | 26.00 | 90 | -1.68% | -1.68% |
| For chart view version of above stock list: Chart View ➞ 0 - 25 , 25 - 50 , 50 - 75 , 75 - 100 , 100 - 125 , 125 - 150 , 150 - 175 , 175 - 200 , 200 - 225 , 225 - 250 , 250 - 275 , 275 - 300 , 300 - 325 | ||
 | Click To Change The Sort Order: By Market Cap or Company Size Performance: Year-to-date, Week and Day |  |
| Too many stocks? View smallcap stocks filtered by marketcap & sector |
| Marketcap: All SmallCap Stocks (default-no microcap), Large, Mid-Range, Small |
| Smallcap Sector: Tech, Finance, Energy, Staples, Retail, Industrial, Materials, & Medical |
|
Get the most comprehensive stock market coverage daily at 12Stocks.com ➞ Best Stocks Today ➞ Best Stocks Weekly ➞ Best Stocks Year-to-Date ➞ Best Stocks Trends ➞  Best Stocks Today 12Stocks.com Best Nasdaq Stocks ➞ Best S&P 500 Stocks ➞ Best Tech Stocks ➞ Best Biotech Stocks ➞ |
| Detailed Overview of SmallCap Stocks |
| SmallCap Technical Overview, Leaders & Laggards, Top SmallCap ETF Funds & Detailed SmallCap Stocks List, Charts, Trends & More |
| Smallcap: Technical Analysis, Trends & YTD Performance | |
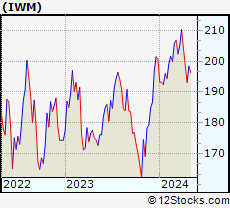
| SmallCap segment as represented by
IWM, an exchange-traded fund [ETF], holds basket of thousands of smallcap stocks from across all major sectors of the US stock market. The smallcap index (contains stocks like Riverbed & Sotheby's) is up by 1.89% and is currently underperforming the overall market by -5.64% year-to-date. Below is a quick view of technical charts and trends: | |
 IWM Weekly Chart |
|
| Long Term Trend: Not Good | |
| Medium Term Trend: Very Good | |
 IWM Daily Chart |
|
| Short Term Trend: Very Good | |
| Overall Trend Score: 69 | |
| YTD Performance: 1.89% | |
| **Trend Scores & Views Are Only For Educational Purposes And Not For Investing | |
| 12Stocks.com: Top Performing Small Cap Index Stocks | ||||||||||||||||||||||||||||||||||||||||||||||||
 The top performing Small Cap Index stocks year to date are
Now, more recently, over last week, the top performing Small Cap Index stocks on the move are


|
||||||||||||||||||||||||||||||||||||||||||||||||
| 12Stocks.com: Investing in Smallcap Index using Exchange Traded Funds | |
|
The following table shows list of key exchange traded funds (ETF) that
help investors track Smallcap index. The following list also includes leveraged ETF funds that track twice or thrice the daily returns of Smallcap indices. Short or inverse ETF funds move in the opposite direction to the index they track and are useful during market pullbacks or during bear markets. Quick View: Move mouse or cursor over ETF symbol (ticker) to view short-term technical chart and over ETF name to view long term chart. Click on ticker or stock name for detailed view. Click on to add stock symbol to your watchlist and to view watchlist. |
12Stocks.com List of ETFs that track Smallcap Index
| Ticker | ETF Name | Watchlist | Recent Price | Smart Investing & Trading Score | Change % | Week % | Year-to-date % |
| IWM | iShares Russell 2000 | | 204.51 | 69 | 1.29 | 1.29 | 1.89% |
| VTWO | Vanguard Russell 2000 ETF | | 82.61 | 69 | 1.23 | 1.23 | 1.86% |
| IJT | iShares S&P Small-Cap 600 Growth | | 128.77 | 95 | 0.79 | 0.79 | 2.9% |
| IJS | iShares S&P Small-Cap 600 Value | | 99.56 | 64 | 0.86 | 0.86 | -3.4% |
| SDD | ProShares UltraShort SmallCap600 | | 18.48 | 23 | -1.94 | -1.94 | 0.29% |
| XSLV | PowerShares S&P SmallCap Low Volatil ETF | | 43.48 | 87 | 0.60 | 0.6 | -1.52% |
| SAA | ProShares Ultra SmallCap600 | | 24.00 | 69 | 1.74 | 1.74 | -3.81% |
| SBB | ProShares Short SmallCap600 | | 16.05 | 13 | -0.68 | -0.68 | 0.75% |
| SMLV | SPDR SSGA US Small Cap Low Volatil ETF | | 109.69 | 87 | 0.00 | 0 | -2.52% |
| 12Stocks.com: Charts, Trends, Fundamental Data and Performances of SmallCap Stocks | |
|
We now take in-depth look at all SmallCap stocks including charts, multi-period performances and overall trends (as measured by Smart Investing & Trading Score). One can sort SmallCap stocks (click link to choose) by Daily, Weekly and by Year-to-Date performances. Also, one can sort by size of the company or by market capitalization. |
| Select Your Default Chart Type: | |||||
| |||||
| Click on stock symbol or name for detailed view. Click on to add stock symbol to your watchlist and to view watchlist. Quick View: Move mouse or cursor over "Daily" to quickly view daily technical stock chart and over "Weekly" to view weekly technical stock chart. | |||||

 | NVRO Nevro Corp. |
| Sector: Health Care | |
| SubSector: Medical Appliances & Equipment | |
| MarketCap: 2489.3 Millions | |
| Recent Price: 11.17 Smart Investing & Trading Score: 52 | |
| Day Percent Change: -1.06% Day Change: -0.12 | |
| Week Change: -1.06% Year-to-date Change: -48.1% | |
| NVRO Links: Profile News Message Board | |
| Charts:- Daily , Weekly | |
| Add NVRO to Watchlist: View: Get Complete NVRO Trend Analysis ➞ | |
 | SCPH scPharmaceuticals Inc. |
| Sector: Health Care | |
| SubSector: Biotechnology | |
| MarketCap: 136.185 Millions | |
| Recent Price: 4.61 Smart Investing & Trading Score: 59 | |
| Day Percent Change: -1.07% Day Change: -0.05 | |
| Week Change: -1.07% Year-to-date Change: -26.5% | |
| SCPH Links: Profile News Message Board | |
| Charts:- Daily , Weekly | |
| Add SCPH to Watchlist: View: Get Complete SCPH Trend Analysis ➞ | |
 | EMBC Embecta Corp. |
| Sector: Health Care | |
| SubSector: Medical Instruments & Supplies | |
| MarketCap: 1260 Millions | |
| Recent Price: 10.15 Smart Investing & Trading Score: 60 | |
| Day Percent Change: -1.07% Day Change: -0.11 | |
| Week Change: -1.07% Year-to-date Change: -46.9% | |
| EMBC Links: Profile News Message Board | |
| Charts:- Daily , Weekly | |
| Add EMBC to Watchlist: View: Get Complete EMBC Trend Analysis ➞ | |
 | IKNA Ikena Oncology, Inc. |
| Sector: Health Care | |
| SubSector: Biotechnology | |
| MarketCap: 277 Millions | |
| Recent Price: 1.32 Smart Investing & Trading Score: 50 | |
| Day Percent Change: -1.12% Day Change: -0.01 | |
| Week Change: -1.12% Year-to-date Change: -34.0% | |
| IKNA Links: Profile News Message Board | |
| Charts:- Daily , Weekly | |
| Add IKNA to Watchlist: View: Get Complete IKNA Trend Analysis ➞ | |
 | ALLO Allogene Therapeutics, Inc. |
| Sector: Health Care | |
| SubSector: Biotechnology | |
| MarketCap: 2858.65 Millions | |
| Recent Price: 3.04 Smart Investing & Trading Score: 37 | |
| Day Percent Change: -1.14% Day Change: -0.03 | |
| Week Change: -1.14% Year-to-date Change: -5.5% | |
| ALLO Links: Profile News Message Board | |
| Charts:- Daily , Weekly | |
| Add ALLO to Watchlist: View: Get Complete ALLO Trend Analysis ➞ | |
 | LXRX Lexicon Pharmaceuticals, Inc. |
| Sector: Health Care | |
| SubSector: Biotechnology | |
| MarketCap: 251.185 Millions | |
| Recent Price: 1.72 Smart Investing & Trading Score: 32 | |
| Day Percent Change: -1.15% Day Change: -0.02 | |
| Week Change: -1.15% Year-to-date Change: 12.4% | |
| LXRX Links: Profile News Message Board | |
| Charts:- Daily , Weekly | |
| Add LXRX to Watchlist: View: Get Complete LXRX Trend Analysis ➞ | |
 | MLYS Mineralys Therapeutics, Inc. |
| Sector: Health Care | |
| SubSector: Biotechnology | |
| MarketCap: 719 Millions | |
| Recent Price: 13.00 Smart Investing & Trading Score: 74 | |
| Day Percent Change: -1.18% Day Change: -0.15 | |
| Week Change: -1.18% Year-to-date Change: 49.1% | |
| MLYS Links: Profile News Message Board | |
| Charts:- Daily , Weekly | |
| Add MLYS to Watchlist: View: Get Complete MLYS Trend Analysis ➞ | |
 | RXRX Recursion Pharmaceuticals, Inc. |
| Sector: Health Care | |
| SubSector: Biotechnology | |
| MarketCap: 1470 Millions | |
| Recent Price: 8.99 Smart Investing & Trading Score: 64 | |
| Day Percent Change: -1.21% Day Change: -0.11 | |
| Week Change: -1.21% Year-to-date Change: -8.2% | |
| RXRX Links: Profile News Message Board | |
| Charts:- Daily , Weekly | |
| Add RXRX to Watchlist: View: Get Complete RXRX Trend Analysis ➞ | |
 | YMAB Y-mAbs Therapeutics, Inc. |
| Sector: Health Care | |
| SubSector: Biotechnology | |
| MarketCap: 899.585 Millions | |
| Recent Price: 16.94 Smart Investing & Trading Score: 95 | |
| Day Percent Change: -1.22% Day Change: -0.21 | |
| Week Change: -1.22% Year-to-date Change: 148.4% | |
| YMAB Links: Profile News Message Board | |
| Charts:- Daily , Weekly | |
| Add YMAB to Watchlist: View: Get Complete YMAB Trend Analysis ➞ | |
 | PSTX Poseida Therapeutics, Inc. |
| Sector: Health Care | |
| SubSector: Biotechnology | |
| MarketCap: 64487 Millions | |
| Recent Price: 2.85 Smart Investing & Trading Score: 64 | |
| Day Percent Change: -1.22% Day Change: -0.03 | |
| Week Change: -1.22% Year-to-date Change: -15.5% | |
| PSTX Links: Profile News Message Board | |
| Charts:- Daily , Weekly | |
| Add PSTX to Watchlist: View: Get Complete PSTX Trend Analysis ➞ | |
 | RYTM Rhythm Pharmaceuticals, Inc. |
| Sector: Health Care | |
| SubSector: Biotechnology | |
| MarketCap: 643.685 Millions | |
| Recent Price: 43.22 Smart Investing & Trading Score: 90 | |
| Day Percent Change: -1.23% Day Change: -0.54 | |
| Week Change: -1.23% Year-to-date Change: -6.0% | |
| RYTM Links: Profile News Message Board | |
| Charts:- Daily , Weekly | |
| Add RYTM to Watchlist: View: Get Complete RYTM Trend Analysis ➞ | |
 | AMWL American Well Corporation |
| Sector: Health Care | |
| SubSector: Health Information Services | |
| MarketCap: 71987 Millions | |
| Recent Price: 0.56 Smart Investing & Trading Score: 55 | |
| Day Percent Change: -1.25% Day Change: -0.01 | |
| Week Change: -1.25% Year-to-date Change: -62.2% | |
| AMWL Links: Profile News Message Board | |
| Charts:- Daily , Weekly | |
| Add AMWL to Watchlist: View: Get Complete AMWL Trend Analysis ➞ | |
 | DYN Dyne Therapeutics, Inc. |
| Sector: Health Care | |
| SubSector: Biotechnology | |
| MarketCap: 88487 Millions | |
| Recent Price: 25.74 Smart Investing & Trading Score: 34 | |
| Day Percent Change: -1.30% Day Change: -0.34 | |
| Week Change: -1.3% Year-to-date Change: 93.5% | |
| DYN Links: Profile News Message Board | |
| Charts:- Daily , Weekly | |
| Add DYN to Watchlist: View: Get Complete DYN Trend Analysis ➞ | |
 | VERV Verve Therapeutics, Inc. |
| Sector: Health Care | |
| SubSector: Biotechnology | |
| MarketCap: 1200 Millions | |
| Recent Price: 6.44 Smart Investing & Trading Score: 42 | |
| Day Percent Change: -1.38% Day Change: -0.09 | |
| Week Change: -1.38% Year-to-date Change: -53.9% | |
| VERV Links: Profile News Message Board | |
| Charts:- Daily , Weekly | |
| Add VERV to Watchlist: View: Get Complete VERV Trend Analysis ➞ | |
 | CUE Cue Biopharma, Inc. |
| Sector: Health Care | |
| SubSector: Biotechnology | |
| MarketCap: 352.785 Millions | |
| Recent Price: 2.10 Smart Investing & Trading Score: 95 | |
| Day Percent Change: -1.41% Day Change: -0.03 | |
| Week Change: -1.41% Year-to-date Change: -20.5% | |
| CUE Links: Profile News Message Board | |
| Charts:- Daily , Weekly | |
| Add CUE to Watchlist: View: Get Complete CUE Trend Analysis ➞ | |
 | RVMD Revolution Medicines, Inc. |
| Sector: Health Care | |
| SubSector: Biotechnology | |
| MarketCap: 28087 Millions | |
| Recent Price: 39.63 Smart Investing & Trading Score: 100 | |
| Day Percent Change: -1.42% Day Change: -0.57 | |
| Week Change: -1.42% Year-to-date Change: 38.2% | |
| RVMD Links: Profile News Message Board | |
| Charts:- Daily , Weekly | |
| Add RVMD to Watchlist: View: Get Complete RVMD Trend Analysis ➞ | |
 | ALEC Alector, Inc. |
| Sector: Health Care | |
| SubSector: Biotechnology | |
| MarketCap: 2719.35 Millions | |
| Recent Price: 5.31 Smart Investing & Trading Score: 54 | |
| Day Percent Change: -1.48% Day Change: -0.08 | |
| Week Change: -1.48% Year-to-date Change: -33.5% | |
| ALEC Links: Profile News Message Board | |
| Charts:- Daily , Weekly | |
| Add ALEC to Watchlist: View: Get Complete ALEC Trend Analysis ➞ | |
 | XNCR Xencor, Inc. |
| Sector: Health Care | |
| SubSector: Biotechnology | |
| MarketCap: 1744.35 Millions | |
| Recent Price: 23.75 Smart Investing & Trading Score: 100 | |
| Day Percent Change: -1.49% Day Change: -0.36 | |
| Week Change: -1.49% Year-to-date Change: 11.9% | |
| XNCR Links: Profile News Message Board | |
| Charts:- Daily , Weekly | |
| Add XNCR to Watchlist: View: Get Complete XNCR Trend Analysis ➞ | |
 | GERN Geron Corporation |
| Sector: Health Care | |
| SubSector: Biotechnology | |
| MarketCap: 228.685 Millions | |
| Recent Price: 3.87 Smart Investing & Trading Score: 63 | |
| Day Percent Change: -1.53% Day Change: -0.06 | |
| Week Change: -1.53% Year-to-date Change: 83.4% | |
| GERN Links: Profile News Message Board | |
| Charts:- Daily , Weekly | |
| Add GERN to Watchlist: View: Get Complete GERN Trend Analysis ➞ | |
 | SCLX Scilex Holding Company |
| Sector: Health Care | |
| SubSector: Drug Manufacturers - General | |
| MarketCap: 927 Millions | |
| Recent Price: 0.86 Smart Investing & Trading Score: 42 | |
| Day Percent Change: -1.53% Day Change: -0.01 | |
| Week Change: -1.53% Year-to-date Change: -56.1% | |
| SCLX Links: Profile News Message Board | |
| Charts:- Daily , Weekly | |
| Add SCLX to Watchlist: View: Get Complete SCLX Trend Analysis ➞ | |
 | ENTA Enanta Pharmaceuticals, Inc. |
| Sector: Health Care | |
| SubSector: Biotechnology | |
| MarketCap: 998.385 Millions | |
| Recent Price: 14.94 Smart Investing & Trading Score: 80 | |
| Day Percent Change: -1.55% Day Change: -0.23 | |
| Week Change: -1.55% Year-to-date Change: 58.7% | |
| ENTA Links: Profile News Message Board | |
| Charts:- Daily , Weekly | |
| Add ENTA to Watchlist: View: Get Complete ENTA Trend Analysis ➞ | |
 | ORGO Organogenesis Holdings Inc. |
| Sector: Health Care | |
| SubSector: Drugs - Generic | |
| MarketCap: 239.685 Millions | |
| Recent Price: 2.45 Smart Investing & Trading Score: 42 | |
| Day Percent Change: -1.61% Day Change: -0.04 | |
| Week Change: -1.61% Year-to-date Change: -40.1% | |
| ORGO Links: Profile News Message Board | |
| Charts:- Daily , Weekly | |
| Add ORGO to Watchlist: View: Get Complete ORGO Trend Analysis ➞ | |
 | EWTX Edgewise Therapeutics, Inc. |
| Sector: Health Care | |
| SubSector: Biotechnology | |
| MarketCap: 492 Millions | |
| Recent Price: 19.55 Smart Investing & Trading Score: 95 | |
| Day Percent Change: -1.64% Day Change: -0.32 | |
| Week Change: -1.64% Year-to-date Change: 72.2% | |
| EWTX Links: Profile News Message Board | |
| Charts:- Daily , Weekly | |
| Add EWTX to Watchlist: View: Get Complete EWTX Trend Analysis ➞ | |
 | ME 23andMe Holding Co. |
| Sector: Health Care | |
| SubSector: Diagnostics & Research | |
| MarketCap: 802 Millions | |
| Recent Price: 0.50 Smart Investing & Trading Score: 59 | |
| Day Percent Change: -1.66% Day Change: -0.01 | |
| Week Change: -1.66% Year-to-date Change: -43.4% | |
| ME Links: Profile News Message Board | |
| Charts:- Daily , Weekly | |
| Add ME to Watchlist: View: Get Complete ME Trend Analysis ➞ | |
 | RNA Avidity Biosciences, Inc. |
| Sector: Health Care | |
| SubSector: Biotechnology | |
| MarketCap: 12287 Millions | |
| Recent Price: 26.00 Smart Investing & Trading Score: 90 | |
| Day Percent Change: -1.68% Day Change: -0.45 | |
| Week Change: -1.68% Year-to-date Change: 187.6% | |
| RNA Links: Profile News Message Board | |
| Charts:- Daily , Weekly | |
| Add RNA to Watchlist: View: Get Complete RNA Trend Analysis ➞ | |
| For tabular summary view of above stock list: Summary View ➞ 0 - 25 , 25 - 50 , 50 - 75 , 75 - 100 , 100 - 125 , 125 - 150 , 150 - 175 , 175 - 200 , 200 - 225 , 225 - 250 , 250 - 275 , 275 - 300 , 300 - 325 | ||
| Click To Change The Sort Order: By Market Cap or Company Size Performance: Year-to-date, Week and Day | |
| Select Chart Type: | ||
| Too many stocks? View smallcap stocks filtered by marketcap & sector |
| Marketcap: All SmallCap Stocks (default-no microcap), Large, Mid-Range, Small & MicroCap |
| Sector: Tech, Finance, Energy, Staples, Retail, Industrial, Materials, Utilities & Medical |
|
Best Stocks Today 12Stocks.com |
© 2024 12Stocks.com Terms & Conditions Privacy Contact Us
All Information Provided Only For Education And Not To Be Used For Investing or Trading. See Terms & Conditions


One More Thing ... Get Best Stocks Delivered Daily!
Never Ever Miss A Move With Our Top Ten Stocks Lists
Find Best Stocks In Any Market - Bull or Bear Market
Take A Peek At Our Top Ten Stocks Lists: Daily, Weekly, Year-to-Date & Top Trends
Find Best Stocks In Any Market - Bull or Bear Market
Take A Peek At Our Top Ten Stocks Lists: Daily, Weekly, Year-to-Date & Top Trends
Smallcap Stocks With Best Up Trends [0-bearish to 100-bullish]: Emergent BioSolutions[100], Twist Bioscience[100], TPI Composites[100], SIGA [100], Riot Blockchain[100], RxSight [100], Carvana Co[100], Regional Management[100], PMV [100], El Pollo[100], Glaukos [100]
Best Smallcap Stocks Year-to-Date:
CareMax [582.47%], Janux [454.21%], Longboard [245.01%], Alpine Immune[239.26%], Bakkt [191.03%], Avidity Biosciences[187.56%], Super Micro[185.73%], Vera [177.16%], Cullinan Oncology[172.09%], Sana [150.91%], Y-mAbs [148.39%] Best Smallcap Stocks This Week:
Perficient [52.71%], Outset Medical[32.27%], Nuvectis Pharma[20.19%], P3 Health[19.19%], BioCryst [18.88%], ThredUp [15.74%], OptiNose [14.85%], SoundHound AI[12.87%], Benson Hill[11.89%], Virgin Galactic[11.81%], Vigil Neuroscience[11.76%] Best Smallcap Stocks Daily:
Perficient [52.71%], Outset Medical[32.27%], Nuvectis Pharma[20.19%], P3 Health[19.19%], BioCryst [18.88%], ThredUp [15.74%], OptiNose [14.85%], SoundHound AI[12.87%], Benson Hill[11.89%], Virgin Galactic[11.81%], Vigil Neuroscience[11.76%]