
 Login Sign Up


| |||||
 |  | ||||

| 12Stocks.com Market Intelligence |
Best SmallCap Stocks
|
| In a hurry? Small Cap Stock Lists: Performance Trends Table, Stock Charts
Sort Small Cap stocks: Daily, Weekly, Year-to-Date, Market Cap & Trends. Filter Small Cap stocks list by sector: Show all, Tech, Finance, Energy, Staples, Retail, Industrial, Materials, Utilities and HealthCare Filter Small Cap stocks list by size: All Large Medium Small and MicroCap |
| 12Stocks.com Small Cap Stocks Performances & Trends Daily | |||||||||
|
|  The overall Smart Investing & Trading Score is 82 (0-bearish to 100-bullish) which puts Small Cap index in short term bullish trend. The Smart Investing & Trading Score from previous trading session is 49 and hence an improvement of trend.
| ||||||||
Here are the Smart Investing & Trading Scores of the most requested small cap stocks at 12Stocks.com (click stock name for detailed review):
|


| 12Stocks.com: Investing in Smallcap Index with Stocks | |
|
The following table helps investors and traders sort through current performance and trends (as measured by Smart Investing & Trading Score) of various
stocks in the Smallcap Index. Quick View: Move mouse or cursor over stock symbol (ticker) to view short-term technical chart and over stock name to view long term chart. Click on  to add stock symbol to your watchlist and to add stock symbol to your watchlist and  to view watchlist. Click on any ticker or stock name for detailed market intelligence report for that stock. to view watchlist. Click on any ticker or stock name for detailed market intelligence report for that stock. |
12Stocks.com Performance of Stocks in Smallcap Index
| Ticker | Stock Name | Watchlist | Category | Recent Price | Smart Investing & Trading Score | Change % | YTD Change% |
| GKOS | Glaukos |   | Health Care | 102.27 | 100 | -2.63 | 28.66% |
| ATMU | Atmus Filtration | | Industrials | 29.57 | 46 | -3.13 | 26.51% |
| FSLY | Fastly | | Technology | 8.51 | 7 | -3.19 | -52.19% |
| VIAV | Viavi Solutions | | Technology | 7.72 | 18 | -3.74 | -23.34% |
| TDS | Telephone and | | Technology | 15.49 | 43 | -4.44 | -15.59% |
| ADNT | Adient | | Consumer Staples | 28.79 | 42 | -4.73 | -20.82% |
| OUT | Outfront Media | | Services & Goods | 15.26 | 76 | -4.89 | 9.28% |
| FDP | Fresh Del | | Consumer Staples | 24.65 | 26 | -5.32 | -6.11% |
| CORT | Corcept | | Health Care | 23.66 | 93 | -5.59 | -27.16% |
| SHEN | Shenandoah Tele | | Technology | 12.26 | 20 | -7.47 | -43.29% |
| TNC | Tennant | | Industrials | 106.94 | 44 | -7.57 | 15.37% |
| AAON | AAON | | Industrials | 83.58 | 51 | -8.04 | 13.14% |
| PTVE | Pactiv Evergreen | | Services & Goods | 13.13 | 0 | -15.24 | -4.30% |
| UNIT | Uniti Group | | Financials | 5.05 | 86 | -16.17 | -12.54% |
| SPT | Sprout Social | | Technology | 30.67 | 0 | -36.30 | -50.08% |
| For chart view version of above stock list: Chart View ➞ 0 - 25 , 25 - 50 , 50 - 75 , 75 - 100 , 100 - 125 , 125 - 150 , 150 - 175 , 175 - 200 , 200 - 225 , 225 - 250 , 250 - 275 , 275 - 300 , 300 - 325 , 325 - 350 , 350 - 375 , 375 - 400 , 400 - 425 , 425 - 450 , 450 - 475 , 475 - 500 , 500 - 525 , 525 - 550 , 550 - 575 , 575 - 600 , 600 - 625 , 625 - 650 , 650 - 675 , 675 - 700 | ||
 | Click To Change The Sort Order: By Market Cap or Company Size Performance: Year-to-date, Week and Day |  |
| Too many stocks? View smallcap stocks filtered by marketcap & sector |
| Marketcap: All SmallCap Stocks (default-no microcap), Large, Mid-Range, Small |
| Smallcap Sector: Tech, Finance, Energy, Staples, Retail, Industrial, Materials, & Medical |
|
Get the most comprehensive stock market coverage daily at 12Stocks.com ➞ Best Stocks Today ➞ Best Stocks Weekly ➞ Best Stocks Year-to-Date ➞ Best Stocks Trends ➞  Best Stocks Today 12Stocks.com Best Nasdaq Stocks ➞ Best S&P 500 Stocks ➞ Best Tech Stocks ➞ Best Biotech Stocks ➞ |
| Detailed Overview of SmallCap Stocks |
| SmallCap Technical Overview, Leaders & Laggards, Top SmallCap ETF Funds & Detailed SmallCap Stocks List, Charts, Trends & More |
| Smallcap: Technical Analysis, Trends & YTD Performance | |
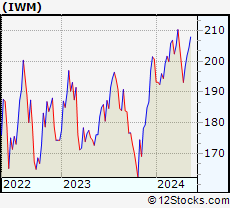
| SmallCap segment as represented by
IWM, an exchange-traded fund [ETF], holds basket of thousands of smallcap stocks from across all major sectors of the US stock market. The smallcap index (contains stocks like Riverbed & Sotheby's) is up by 1.11% and is currently underperforming the overall market by -5.68% year-to-date. Below is a quick view of technical charts and trends: | |
 IWM Weekly Chart |
|
| Long Term Trend: Deteriorating | |
| Medium Term Trend: Very Good | |
 IWM Daily Chart |
|
| Short Term Trend: Very Good | |
| Overall Trend Score: 82 | |
| YTD Performance: 1.11% | |
| **Trend Scores & Views Are Only For Educational Purposes And Not For Investing | |
| 12Stocks.com: Top Performing Small Cap Index Stocks | ||||||||||||||||||||||||||||||||||||||||||||||||
 The top performing Small Cap Index stocks year to date are
Now, more recently, over last week, the top performing Small Cap Index stocks on the move are


|
||||||||||||||||||||||||||||||||||||||||||||||||
| 12Stocks.com: Investing in Smallcap Index using Exchange Traded Funds | |
|
The following table shows list of key exchange traded funds (ETF) that
help investors track Smallcap index. The following list also includes leveraged ETF funds that track twice or thrice the daily returns of Smallcap indices. Short or inverse ETF funds move in the opposite direction to the index they track and are useful during market pullbacks or during bear markets. Quick View: Move mouse or cursor over ETF symbol (ticker) to view short-term technical chart and over ETF name to view long term chart. Click on ticker or stock name for detailed view. Click on to add stock symbol to your watchlist and to view watchlist. |
12Stocks.com List of ETFs that track Smallcap Index
| Ticker | ETF Name | Watchlist | Recent Price | Smart Investing & Trading Score | Change % | Week % | Year-to-date % |
| IWM | iShares Russell 2000 | | 202.94 | 82 | 1.51 | 2.29 | 1.11% |
| SDD | ProShares UltraShort SmallCap600 | | 18.35 | 56 | -4.97 | -5.17 | -0.42% |
| SBB | ProShares Short SmallCap600 | | 16.33 | 49 | -0.25 | -0.34 | 2.51% |
| SAA | ProShares Ultra SmallCap600 | | 23.93 | 49 | 4.36 | 3.88 | -4.07% |
| 12Stocks.com: Charts, Trends, Fundamental Data and Performances of SmallCap Stocks | |
|
We now take in-depth look at all SmallCap stocks including charts, multi-period performances and overall trends (as measured by Smart Investing & Trading Score). One can sort SmallCap stocks (click link to choose) by Daily, Weekly and by Year-to-Date performances. Also, one can sort by size of the company or by market capitalization. |
| Select Your Default Chart Type: | |||||
| |||||
| Click on stock symbol or name for detailed view. Click on to add stock symbol to your watchlist and to view watchlist. Quick View: Move mouse or cursor over "Daily" to quickly view daily technical stock chart and over "Weekly" to view weekly technical stock chart. | |||||

 | GKOS Glaukos Corporation |
| Sector: Health Care | |
| SubSector: Medical Instruments & Supplies | |
| MarketCap: 1103.6 Millions | |
| Recent Price: 102.27 Smart Investing & Trading Score: 100 | |
| Day Percent Change: -2.63% Day Change: -2.76 | |
| Week Change: 2.8% Year-to-date Change: 28.7% | |
| GKOS Links: Profile News Message Board | |
| Charts:- Daily , Weekly | |
| Add GKOS to Watchlist: View: Get Complete GKOS Trend Analysis ➞ | |
 | ATMU Atmus Filtration Technologies Inc. |
| Sector: Industrials | |
| SubSector: Pollution & Treatment Controls | |
| MarketCap: 1830 Millions | |
| Recent Price: 29.57 Smart Investing & Trading Score: 46 | |
| Day Percent Change: -3.13% Day Change: -0.95 | |
| Week Change: -5.54% Year-to-date Change: 26.5% | |
| ATMU Links: Profile News Message Board | |
| Charts:- Daily , Weekly | |
| Add ATMU to Watchlist: View: Get Complete ATMU Trend Analysis ➞ | |
 | FSLY Fastly, Inc. |
| Sector: Technology | |
| SubSector: Application Software | |
| MarketCap: 1973.72 Millions | |
| Recent Price: 8.51 Smart Investing & Trading Score: 7 | |
| Day Percent Change: -3.19% Day Change: -0.28 | |
| Week Change: -34.29% Year-to-date Change: -52.2% | |
| FSLY Links: Profile News Message Board | |
| Charts:- Daily , Weekly | |
| Add FSLY to Watchlist: View: Get Complete FSLY Trend Analysis ➞ | |
 | VIAV Viavi Solutions Inc. |
| Sector: Technology | |
| SubSector: Communication Equipment | |
| MarketCap: 2653.29 Millions | |
| Recent Price: 7.72 Smart Investing & Trading Score: 18 | |
| Day Percent Change: -3.74% Day Change: -0.30 | |
| Week Change: -3.62% Year-to-date Change: -23.3% | |
| VIAV Links: Profile News Message Board | |
| Charts:- Daily , Weekly | |
| Add VIAV to Watchlist: View: Get Complete VIAV Trend Analysis ➞ | |
 | TDS Telephone and Data Systems, Inc. |
| Sector: Technology | |
| SubSector: Wireless Communications | |
| MarketCap: 1851.87 Millions | |
| Recent Price: 15.49 Smart Investing & Trading Score: 43 | |
| Day Percent Change: -4.44% Day Change: -0.72 | |
| Week Change: -1.84% Year-to-date Change: -15.6% | |
| TDS Links: Profile News Message Board | |
| Charts:- Daily , Weekly | |
| Add TDS to Watchlist: View: Get Complete TDS Trend Analysis ➞ | |
 | ADNT Adient plc |
| Sector: Consumer Staples | |
| SubSector: Auto Parts | |
| MarketCap: 1003.39 Millions | |
| Recent Price: 28.79 Smart Investing & Trading Score: 42 | |
| Day Percent Change: -4.73% Day Change: -1.43 | |
| Week Change: -5.36% Year-to-date Change: -20.8% | |
| ADNT Links: Profile News Message Board | |
| Charts:- Daily , Weekly | |
| Add ADNT to Watchlist: View: Get Complete ADNT Trend Analysis ➞ | |
 | OUT Outfront Media Inc. |
| Sector: Services & Goods | |
| SubSector: Marketing Services | |
| MarketCap: 1388.15 Millions | |
| Recent Price: 15.26 Smart Investing & Trading Score: 76 | |
| Day Percent Change: -4.89% Day Change: -0.78 | |
| Week Change: -3.02% Year-to-date Change: 9.3% | |
| OUT Links: Profile News Message Board | |
| Charts:- Daily , Weekly | |
| Add OUT to Watchlist: View: Get Complete OUT Trend Analysis ➞ | |
 | FDP Fresh Del Monte Produce Inc. |
| Sector: Consumer Staples | |
| SubSector: Farm Products | |
| MarketCap: 1862.37 Millions | |
| Recent Price: 24.65 Smart Investing & Trading Score: 26 | |
| Day Percent Change: -5.32% Day Change: -1.39 | |
| Week Change: -3.81% Year-to-date Change: -6.1% | |
| FDP Links: Profile News Message Board | |
| Charts:- Daily , Weekly | |
| Add FDP to Watchlist: View: Get Complete FDP Trend Analysis ➞ | |
 | CORT Corcept Therapeutics Incorporated |
| Sector: Health Care | |
| SubSector: Biotechnology | |
| MarketCap: 1228.45 Millions | |
| Recent Price: 23.66 Smart Investing & Trading Score: 93 | |
| Day Percent Change: -5.59% Day Change: -1.40 | |
| Week Change: 3.77% Year-to-date Change: -27.2% | |
| CORT Links: Profile News Message Board | |
| Charts:- Daily , Weekly | |
| Add CORT to Watchlist: View: Get Complete CORT Trend Analysis ➞ | |
 | SHEN Shenandoah Telecommunications Company |
| Sector: Technology | |
| SubSector: Telecom Services - Domestic | |
| MarketCap: 2329.67 Millions | |
| Recent Price: 12.26 Smart Investing & Trading Score: 20 | |
| Day Percent Change: -7.47% Day Change: -0.99 | |
| Week Change: -8.44% Year-to-date Change: -43.3% | |
| SHEN Links: Profile News Message Board | |
| Charts:- Daily , Weekly | |
| Add SHEN to Watchlist: View: Get Complete SHEN Trend Analysis ➞ | |
 | TNC Tennant Company |
| Sector: Industrials | |
| SubSector: Diversified Machinery | |
| MarketCap: 1097.96 Millions | |
| Recent Price: 106.94 Smart Investing & Trading Score: 44 | |
| Day Percent Change: -7.57% Day Change: -8.76 | |
| Week Change: -7.52% Year-to-date Change: 15.4% | |
| TNC Links: Profile News Message Board | |
| Charts:- Daily , Weekly | |
| Add TNC to Watchlist: View: Get Complete TNC Trend Analysis ➞ | |
 | AAON AAON, Inc. |
| Sector: Industrials | |
| SubSector: General Building Materials | |
| MarketCap: 2533.63 Millions | |
| Recent Price: 83.58 Smart Investing & Trading Score: 51 | |
| Day Percent Change: -8.04% Day Change: -7.31 | |
| Week Change: -8.3% Year-to-date Change: 13.1% | |
| AAON Links: Profile News Message Board | |
| Charts:- Daily , Weekly | |
| Add AAON to Watchlist: View: Get Complete AAON Trend Analysis ➞ | |
 | PTVE Pactiv Evergreen Inc. |
| Sector: Services & Goods | |
| SubSector: Packaging & Containers | |
| MarketCap: 33427 Millions | |
| Recent Price: 13.13 Smart Investing & Trading Score: 0 | |
| Day Percent Change: -15.24% Day Change: -2.36 | |
| Week Change: -15.45% Year-to-date Change: -4.3% | |
| PTVE Links: Profile News Message Board | |
| Charts:- Daily , Weekly | |
| Add PTVE to Watchlist: View: Get Complete PTVE Trend Analysis ➞ | |
 | UNIT Uniti Group Inc. |
| Sector: Financials | |
| SubSector: REIT - Industrial | |
| MarketCap: 1363.09 Millions | |
| Recent Price: 5.05 Smart Investing & Trading Score: 86 | |
| Day Percent Change: -16.17% Day Change: -0.98 | |
| Week Change: -12.54% Year-to-date Change: -12.5% | |
| UNIT Links: Profile News Message Board | |
| Charts:- Daily , Weekly | |
| Add UNIT to Watchlist: View: Get Complete UNIT Trend Analysis ➞ | |
 | SPT Sprout Social, Inc. |
| Sector: Technology | |
| SubSector: Software Application | |
| MarketCap: 25087 Millions | |
| Recent Price: 30.67 Smart Investing & Trading Score: 0 | |
| Day Percent Change: -36.30% Day Change: -17.48 | |
| Week Change: -40.32% Year-to-date Change: -50.1% | |
| SPT Links: Profile News Message Board | |
| Charts:- Daily , Weekly | |
| Add SPT to Watchlist: View: Get Complete SPT Trend Analysis ➞ | |
| For tabular summary view of above stock list: Summary View ➞ 0 - 25 , 25 - 50 , 50 - 75 , 75 - 100 , 100 - 125 , 125 - 150 , 150 - 175 , 175 - 200 , 200 - 225 , 225 - 250 , 250 - 275 , 275 - 300 , 300 - 325 , 325 - 350 , 350 - 375 , 375 - 400 , 400 - 425 , 425 - 450 , 450 - 475 , 475 - 500 , 500 - 525 , 525 - 550 , 550 - 575 , 575 - 600 , 600 - 625 , 625 - 650 , 650 - 675 , 675 - 700 | ||
| Click To Change The Sort Order: By Market Cap or Company Size Performance: Year-to-date, Week and Day | |
| Select Chart Type: | ||
| Too many stocks? View smallcap stocks filtered by marketcap & sector |
| Marketcap: All SmallCap Stocks (default-no microcap), Large, Mid-Range, Small & MicroCap |
| Sector: Tech, Finance, Energy, Staples, Retail, Industrial, Materials, Utilities & Medical |
|
Best Stocks Today 12Stocks.com |
© 2024 12Stocks.com Terms & Conditions Privacy Contact Us
All Information Provided Only For Education And Not To Be Used For Investing or Trading. See Terms & Conditions


One More Thing ... Get Best Stocks Delivered Daily!
Never Ever Miss A Move With Our Top Ten Stocks Lists
Find Best Stocks In Any Market - Bull or Bear Market
Take A Peek At Our Top Ten Stocks Lists: Daily, Weekly, Year-to-Date & Top Trends
Find Best Stocks In Any Market - Bull or Bear Market
Take A Peek At Our Top Ten Stocks Lists: Daily, Weekly, Year-to-Date & Top Trends
Smallcap Stocks With Best Up Trends [0-bearish to 100-bullish]: Alignment Healthcare[100], Enovix [100], Origin Materials[100], Clearfield [100], Fluence Energy[100], Emergent BioSolutions[100], TPI Composites[100], Riot Blockchain[100], ALLETE [100], E.W. Scripps[100], Conduent [100]
Best Smallcap Stocks Year-to-Date:
Janux [458.63%], Longboard [289.77%], Alpine Immune[239.36%], Avidity Biosciences[198.01%], Bakkt [194.84%], Vera [187.73%], Cullinan Oncology[177.78%], Super Micro[177.56%], Arcutis Bio[169.66%], Y-mAbs [154.69%], Sana [148.85%] Best Smallcap Stocks This Week:
Emergent BioSolutions[88.54%], Deciphera [73.28%], Origin Materials[59.41%], Eyenovia [59.18%], Enovix [54.87%], Codexis [46.8%], Cue Biopharma[41.39%], WideOpenWest [41.07%], TPI Composites[40.65%], Seres [39.39%], Carvana Co[39.19%] Best Smallcap Stocks Daily:
WideOpenWest [29.16%], Alignment Healthcare[24.23%], Ardelyx [23.42%], Twist Bioscience[23.18%], El Pollo[21.45%], IES [20.21%], Vaxxinity [17.64%], Enovix [17.26%], Origin Materials[17.01%], Codexis [16.92%], Adtalem Global[16.86%]