
 Login Sign Up


| |||||
 |  | ||||

| 12Stocks.com Market Intelligence |
Best SmallCap Stocks
|
| In a hurry? Small Cap Stock Lists: Performance Trends Table, Stock Charts
Sort Small Cap stocks: Daily, Weekly, Year-to-Date, Market Cap & Trends. Filter Small Cap stocks list by sector: Show all, Tech, Finance, Energy, Staples, Retail, Industrial, Materials, Utilities and HealthCare Filter Small Cap stocks list by size: All Large Medium Small and MicroCap |
| 12Stocks.com Small Cap Stocks Performances & Trends Daily | |||||||||
|
|  The overall Smart Investing & Trading Score is 82 (0-bearish to 100-bullish) which puts Small Cap index in short term bullish trend. The Smart Investing & Trading Score from previous trading session is 49 and hence an improvement of trend.
| ||||||||
Here are the Smart Investing & Trading Scores of the most requested small cap stocks at 12Stocks.com (click stock name for detailed review):
|


| 12Stocks.com: Investing in Smallcap Index with Stocks | |
|
The following table helps investors and traders sort through current performance and trends (as measured by Smart Investing & Trading Score) of various
stocks in the Smallcap Index. Quick View: Move mouse or cursor over stock symbol (ticker) to view short-term technical chart and over stock name to view long term chart. Click on  to add stock symbol to your watchlist and to add stock symbol to your watchlist and  to view watchlist. Click on any ticker or stock name for detailed market intelligence report for that stock. to view watchlist. Click on any ticker or stock name for detailed market intelligence report for that stock. |
12Stocks.com Performance of Stocks in Smallcap Index
| Ticker | Stock Name | Watchlist | Category | Recent Price | Smart Investing & Trading Score | Change % | YTD Change% |
| ASB | Associated Banc-Corp |   | Financials | 22.06 | 100 | 0.85 | 3.11% |
| PRMW | Primo Water | | Consumer Staples | 19.82 | 100 | 0.84 | 31.66% |
| PGRE | Paramount Group | | Financials | 4.84 | 100 | 0.83 | -6.38% |
| SKYW | SkyWest | | Transports | 75.59 | 75 | 0.82 | 44.82% |
| LILAK | Liberty Latin | | Technology | 8.01 | 100 | 0.82 | 9.06% |
| ODP | Office Depot | | Services & Goods | 51.32 | 39 | 0.81 | -8.85% |
| SYNA | Synaptics | | Technology | 90.34 | 42 | 0.80 | -20.81% |
| CMPR | Cimpress | | Services & Goods | 83.25 | 7 | 0.80 | 4.00% |
| FNA | Paragon 28 | | Health Care | 10.04 | 59 | 0.80 | -19.49% |
| SUM | Summit Materials | | Industrials | 39.41 | 17 | 0.79 | 2.47% |
| INGN | Inogen | | Health Care | 7.09 | 60 | 0.78 | 29.05% |
| ORA | Ormat | | Utilities | 67.23 | 100 | 0.78 | -11.29% |
| UMBF | UMB Financial | | Financials | 82.50 | 65 | 0.78 | -1.25% |
| NWBI | Northwest Bancshares | | Financials | 11.02 | 57 | 0.78 | -11.74% |
| CNMD | CONMED | | Health Care | 70.66 | 42 | 0.77 | -35.48% |
| NBTB | NBT Bancorp | | Financials | 36.80 | 100 | 0.77 | -12.19% |
| KGS | Kodiak Gas | | Energy | 27.31 | 61 | 0.77 | 36.69% |
| ACAD | ACADIA | | Health Care | 17.21 | 42 | 0.76 | -45.03% |
| XRX | Xerox | | Technology | 13.49 | 32 | 0.75 | -26.40% |
| BXMT | Blackstone Mortgage | | Financials | 18.14 | 35 | 0.75 | -14.74% |
| LILA | Liberty Latin | | Technology | 8.03 | 100 | 0.75 | 9.85% |
| EPAC | Enerpac Tool | | Industrials | 36.76 | 83 | 0.75 | 18.22% |
| PGNY | Progyny | | Technology | 32.31 | 10 | 0.75 | -13.10% |
| BCPC | Balchem | | Materials | 147.36 | 49 | 0.74 | -0.93% |
| GHC | Graham | | Services & Goods | 731.19 | 95 | 0.74 | 4.98% |
| For chart view version of above stock list: Chart View ➞ 0 - 25 , 25 - 50 , 50 - 75 , 75 - 100 , 100 - 125 , 125 - 150 , 150 - 175 , 175 - 200 , 200 - 225 , 225 - 250 , 250 - 275 , 275 - 300 , 300 - 325 , 325 - 350 , 350 - 375 , 375 - 400 , 400 - 425 , 425 - 450 , 450 - 475 , 475 - 500 , 500 - 525 , 525 - 550 , 550 - 575 , 575 - 600 , 600 - 625 , 625 - 650 , 650 - 675 , 675 - 700 | ||
 | Click To Change The Sort Order: By Market Cap or Company Size Performance: Year-to-date, Week and Day |  |
| Too many stocks? View smallcap stocks filtered by marketcap & sector |
| Marketcap: All SmallCap Stocks (default-no microcap), Large, Mid-Range, Small |
| Smallcap Sector: Tech, Finance, Energy, Staples, Retail, Industrial, Materials, & Medical |
|
Get the most comprehensive stock market coverage daily at 12Stocks.com ➞ Best Stocks Today ➞ Best Stocks Weekly ➞ Best Stocks Year-to-Date ➞ Best Stocks Trends ➞  Best Stocks Today 12Stocks.com Best Nasdaq Stocks ➞ Best S&P 500 Stocks ➞ Best Tech Stocks ➞ Best Biotech Stocks ➞ |
| Detailed Overview of SmallCap Stocks |
| SmallCap Technical Overview, Leaders & Laggards, Top SmallCap ETF Funds & Detailed SmallCap Stocks List, Charts, Trends & More |
| Smallcap: Technical Analysis, Trends & YTD Performance | |
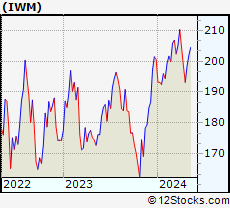
| SmallCap segment as represented by
IWM, an exchange-traded fund [ETF], holds basket of thousands of smallcap stocks from across all major sectors of the US stock market. The smallcap index (contains stocks like Riverbed & Sotheby's) is up by 0.22% and is currently underperforming the overall market by -6.27% year-to-date. Below is a quick view of technical charts and trends: | |
 IWM Weekly Chart |
|
| Long Term Trend: Deteriorating | |
| Medium Term Trend: Very Good | |
 IWM Daily Chart |
|
| Short Term Trend: Very Good | |
| Overall Trend Score: 82 | |
| YTD Performance: 0.22% | |
| **Trend Scores & Views Are Only For Educational Purposes And Not For Investing | |
| 12Stocks.com: Top Performing Small Cap Index Stocks | ||||||||||||||||||||||||||||||||||||||||||||||||
 The top performing Small Cap Index stocks year to date are
Now, more recently, over last week, the top performing Small Cap Index stocks on the move are


|
||||||||||||||||||||||||||||||||||||||||||||||||
| 12Stocks.com: Investing in Smallcap Index using Exchange Traded Funds | |
|
The following table shows list of key exchange traded funds (ETF) that
help investors track Smallcap index. The following list also includes leveraged ETF funds that track twice or thrice the daily returns of Smallcap indices. Short or inverse ETF funds move in the opposite direction to the index they track and are useful during market pullbacks or during bear markets. Quick View: Move mouse or cursor over ETF symbol (ticker) to view short-term technical chart and over ETF name to view long term chart. Click on ticker or stock name for detailed view. Click on to add stock symbol to your watchlist and to view watchlist. |
12Stocks.com List of ETFs that track Smallcap Index
| Ticker | ETF Name | Watchlist | Recent Price | Smart Investing & Trading Score | Change % | Week % | Year-to-date % |
| IWM | iShares Russell 2000 | | 201.15 | 82 | 0.61 | 1.39 | 0.22% |
| IJR | iShares Core S&P Small-Cap | | 106.83 | 50 | 0.47 | 1.12 | -1.31% |
| SDD | ProShares UltraShort SmallCap600 | | 18.35 | 56 | -4.97 | -5.17 | -0.42% |
| SBB | ProShares Short SmallCap600 | | 16.33 | 49 | -0.25 | -0.34 | 2.51% |
| SAA | ProShares Ultra SmallCap600 | | 23.93 | 49 | 4.36 | 3.88 | -4.07% |
| 12Stocks.com: Charts, Trends, Fundamental Data and Performances of SmallCap Stocks | |
|
We now take in-depth look at all SmallCap stocks including charts, multi-period performances and overall trends (as measured by Smart Investing & Trading Score). One can sort SmallCap stocks (click link to choose) by Daily, Weekly and by Year-to-Date performances. Also, one can sort by size of the company or by market capitalization. |
| Select Your Default Chart Type: | |||||
| |||||
| Click on stock symbol or name for detailed view. Click on to add stock symbol to your watchlist and to view watchlist. Quick View: Move mouse or cursor over "Daily" to quickly view daily technical stock chart and over "Weekly" to view weekly technical stock chart. | |||||

 | ASB Associated Banc-Corp |
| Sector: Financials | |
| SubSector: Regional - Midwest Banks | |
| MarketCap: 1904.8 Millions | |
| Recent Price: 22.06 Smart Investing & Trading Score: 100 | |
| Day Percent Change: 0.85% Day Change: 0.18 | |
| Week Change: 2.25% Year-to-date Change: 3.1% | |
| ASB Links: Profile News Message Board | |
| Charts:- Daily , Weekly | |
| Add ASB to Watchlist: View: Get Complete ASB Trend Analysis ➞ | |
 | PRMW Primo Water Corporation |
| Sector: Consumer Staples | |
| SubSector: Beverages - Soft Drinks | |
| MarketCap: 1479.7 Millions | |
| Recent Price: 19.82 Smart Investing & Trading Score: 100 | |
| Day Percent Change: 0.84% Day Change: 0.17 | |
| Week Change: 4.56% Year-to-date Change: 31.7% | |
| PRMW Links: Profile News Message Board | |
| Charts:- Daily , Weekly | |
| Add PRMW to Watchlist: View: Get Complete PRMW Trend Analysis ➞ | |
 | PGRE Paramount Group, Inc. |
| Sector: Financials | |
| SubSector: Property Management | |
| MarketCap: 1722.72 Millions | |
| Recent Price: 4.84 Smart Investing & Trading Score: 100 | |
| Day Percent Change: 0.83% Day Change: 0.04 | |
| Week Change: 3.64% Year-to-date Change: -6.4% | |
| PGRE Links: Profile News Message Board | |
| Charts:- Daily , Weekly | |
| Add PGRE to Watchlist: View: Get Complete PGRE Trend Analysis ➞ | |
 | SKYW SkyWest, Inc. |
| Sector: Transports | |
| SubSector: Regional Airlines | |
| MarketCap: 1394.7 Millions | |
| Recent Price: 75.59 Smart Investing & Trading Score: 75 | |
| Day Percent Change: 0.82% Day Change: 0.61 | |
| Week Change: 2.63% Year-to-date Change: 44.8% | |
| SKYW Links: Profile News Message Board | |
| Charts:- Daily , Weekly | |
| Add SKYW to Watchlist: View: Get Complete SKYW Trend Analysis ➞ | |
 | LILAK Liberty Latin America Ltd. |
| Sector: Technology | |
| SubSector: CATV Systems | |
| MarketCap: 1210.32 Millions | |
| Recent Price: 8.01 Smart Investing & Trading Score: 100 | |
| Day Percent Change: 0.82% Day Change: 0.07 | |
| Week Change: 5.19% Year-to-date Change: 9.1% | |
| LILAK Links: Profile News Message Board | |
| Charts:- Daily , Weekly | |
| Add LILAK to Watchlist: View: Get Complete LILAK Trend Analysis ➞ | |
 | ODP Office Depot, Inc. |
| Sector: Services & Goods | |
| SubSector: Specialty Retail, Other | |
| MarketCap: 1024.44 Millions | |
| Recent Price: 51.32 Smart Investing & Trading Score: 39 | |
| Day Percent Change: 0.81% Day Change: 0.41 | |
| Week Change: -0.14% Year-to-date Change: -8.9% | |
| ODP Links: Profile News Message Board | |
| Charts:- Daily , Weekly | |
| Add ODP to Watchlist: View: Get Complete ODP Trend Analysis ➞ | |
 | SYNA Synaptics Incorporated |
| Sector: Technology | |
| SubSector: Application Software | |
| MarketCap: 1822.82 Millions | |
| Recent Price: 90.34 Smart Investing & Trading Score: 42 | |
| Day Percent Change: 0.80% Day Change: 0.72 | |
| Week Change: 1.22% Year-to-date Change: -20.8% | |
| SYNA Links: Profile News Message Board | |
| Charts:- Daily , Weekly | |
| Add SYNA to Watchlist: View: Get Complete SYNA Trend Analysis ➞ | |
 | CMPR Cimpress plc |
| Sector: Services & Goods | |
| SubSector: Business Services | |
| MarketCap: 1675.02 Millions | |
| Recent Price: 83.25 Smart Investing & Trading Score: 7 | |
| Day Percent Change: 0.80% Day Change: 0.66 | |
| Week Change: -6.54% Year-to-date Change: 4.0% | |
| CMPR Links: Profile News Message Board | |
| Charts:- Daily , Weekly | |
| Add CMPR to Watchlist: View: Get Complete CMPR Trend Analysis ➞ | |
 | FNA Paragon 28, Inc. |
| Sector: Health Care | |
| SubSector: Medical Devices | |
| MarketCap: 1420 Millions | |
| Recent Price: 10.04 Smart Investing & Trading Score: 59 | |
| Day Percent Change: 0.80% Day Change: 0.08 | |
| Week Change: 14.09% Year-to-date Change: -19.5% | |
| FNA Links: Profile News Message Board | |
| Charts:- Daily , Weekly | |
| Add FNA to Watchlist: View: Get Complete FNA Trend Analysis ➞ | |
 | SUM Summit Materials, Inc. |
| Sector: Industrials | |
| SubSector: General Building Materials | |
| MarketCap: 1138.23 Millions | |
| Recent Price: 39.41 Smart Investing & Trading Score: 17 | |
| Day Percent Change: 0.79% Day Change: 0.31 | |
| Week Change: -1.48% Year-to-date Change: 2.5% | |
| SUM Links: Profile News Message Board | |
| Charts:- Daily , Weekly | |
| Add SUM to Watchlist: View: Get Complete SUM Trend Analysis ➞ | |
 | INGN Inogen, Inc. |
| Sector: Health Care | |
| SubSector: Medical Instruments & Supplies | |
| MarketCap: 8803.6 Millions | |
| Recent Price: 7.09 Smart Investing & Trading Score: 60 | |
| Day Percent Change: 0.78% Day Change: 0.05 | |
| Week Change: 4.5% Year-to-date Change: 29.1% | |
| INGN Links: Profile News Message Board | |
| Charts:- Daily , Weekly | |
| Add INGN to Watchlist: View: Get Complete INGN Trend Analysis ➞ | |
 | ORA Ormat Technologies, Inc. |
| Sector: Utilities | |
| SubSector: Electric Utilities | |
| MarketCap: 3610.74 Millions | |
| Recent Price: 67.23 Smart Investing & Trading Score: 100 | |
| Day Percent Change: 0.78% Day Change: 0.52 | |
| Week Change: 6.53% Year-to-date Change: -11.3% | |
| ORA Links: Profile News Message Board | |
| Charts:- Daily , Weekly | |
| Add ORA to Watchlist: View: Get Complete ORA Trend Analysis ➞ | |
 | UMBF UMB Financial Corporation |
| Sector: Financials | |
| SubSector: Regional - Southwest Banks | |
| MarketCap: 2207.35 Millions | |
| Recent Price: 82.50 Smart Investing & Trading Score: 65 | |
| Day Percent Change: 0.78% Day Change: 0.63 | |
| Week Change: -0.8% Year-to-date Change: -1.3% | |
| UMBF Links: Profile News Message Board | |
| Charts:- Daily , Weekly | |
| Add UMBF to Watchlist: View: Get Complete UMBF Trend Analysis ➞ | |
 | NWBI Northwest Bancshares, Inc. |
| Sector: Financials | |
| SubSector: Savings & Loans | |
| MarketCap: 1266.3 Millions | |
| Recent Price: 11.02 Smart Investing & Trading Score: 57 | |
| Day Percent Change: 0.78% Day Change: 0.09 | |
| Week Change: 1.8% Year-to-date Change: -11.7% | |
| NWBI Links: Profile News Message Board | |
| Charts:- Daily , Weekly | |
| Add NWBI to Watchlist: View: Get Complete NWBI Trend Analysis ➞ | |
 | CNMD CONMED Corporation |
| Sector: Health Care | |
| SubSector: Medical Appliances & Equipment | |
| MarketCap: 1589.2 Millions | |
| Recent Price: 70.66 Smart Investing & Trading Score: 42 | |
| Day Percent Change: 0.77% Day Change: 0.54 | |
| Week Change: 7.42% Year-to-date Change: -35.5% | |
| CNMD Links: Profile News Message Board | |
| Charts:- Daily , Weekly | |
| Add CNMD to Watchlist: View: Get Complete CNMD Trend Analysis ➞ | |
 | NBTB NBT Bancorp Inc. |
| Sector: Financials | |
| SubSector: Regional - Northeast Banks | |
| MarketCap: 1451.89 Millions | |
| Recent Price: 36.80 Smart Investing & Trading Score: 100 | |
| Day Percent Change: 0.77% Day Change: 0.28 | |
| Week Change: 2.31% Year-to-date Change: -12.2% | |
| NBTB Links: Profile News Message Board | |
| Charts:- Daily , Weekly | |
| Add NBTB to Watchlist: View: Get Complete NBTB Trend Analysis ➞ | |
 | KGS Kodiak Gas Services, LLC |
| Sector: Energy | |
| SubSector: Oil & Gas Equipment & Services | |
| MarketCap: 1220 Millions | |
| Recent Price: 27.31 Smart Investing & Trading Score: 61 | |
| Day Percent Change: 0.77% Day Change: 0.21 | |
| Week Change: -2.08% Year-to-date Change: 36.7% | |
| KGS Links: Profile News Message Board | |
| Charts:- Daily , Weekly | |
| Add KGS to Watchlist: View: Get Complete KGS Trend Analysis ➞ | |
 | ACAD ACADIA Pharmaceuticals Inc. |
| Sector: Health Care | |
| SubSector: Biotechnology | |
| MarketCap: 5400.35 Millions | |
| Recent Price: 17.21 Smart Investing & Trading Score: 42 | |
| Day Percent Change: 0.76% Day Change: 0.13 | |
| Week Change: 2.99% Year-to-date Change: -45.0% | |
| ACAD Links: Profile News Message Board | |
| Charts:- Daily , Weekly | |
| Add ACAD to Watchlist: View: Get Complete ACAD Trend Analysis ➞ | |
 | XRX Xerox Holdings Corporation |
| Sector: Technology | |
| SubSector: Information Technology Services | |
| MarketCap: 4077.48 Millions | |
| Recent Price: 13.49 Smart Investing & Trading Score: 32 | |
| Day Percent Change: 0.75% Day Change: 0.10 | |
| Week Change: -3.64% Year-to-date Change: -26.4% | |
| XRX Links: Profile News Message Board | |
| Charts:- Daily , Weekly | |
| Add XRX to Watchlist: View: Get Complete XRX Trend Analysis ➞ | |
 | BXMT Blackstone Mortgage Trust, Inc. |
| Sector: Financials | |
| SubSector: Mortgage Investment | |
| MarketCap: 2820.69 Millions | |
| Recent Price: 18.14 Smart Investing & Trading Score: 35 | |
| Day Percent Change: 0.75% Day Change: 0.14 | |
| Week Change: 1.26% Year-to-date Change: -14.7% | |
| BXMT Links: Profile News Message Board | |
| Charts:- Daily , Weekly | |
| Add BXMT to Watchlist: View: Get Complete BXMT Trend Analysis ➞ | |
 | LILA Liberty Latin America Ltd. |
| Sector: Technology | |
| SubSector: CATV Systems | |
| MarketCap: 2092.62 Millions | |
| Recent Price: 8.03 Smart Investing & Trading Score: 100 | |
| Day Percent Change: 0.75% Day Change: 0.06 | |
| Week Change: 5.52% Year-to-date Change: 9.9% | |
| LILA Links: Profile News Message Board | |
| Charts:- Daily , Weekly | |
| Add LILA to Watchlist: View: Get Complete LILA Trend Analysis ➞ | |
 | EPAC Enerpac Tool Group Corp. |
| Sector: Industrials | |
| SubSector: Diversified Machinery | |
| MarketCap: 1044.16 Millions | |
| Recent Price: 36.76 Smart Investing & Trading Score: 83 | |
| Day Percent Change: 0.75% Day Change: 0.28 | |
| Week Change: 1.7% Year-to-date Change: 18.2% | |
| EPAC Links: Profile News Message Board | |
| Charts:- Daily , Weekly | |
| Add EPAC to Watchlist: View: Get Complete EPAC Trend Analysis ➞ | |
 | PGNY Progyny, Inc. |
| Sector: Technology | |
| SubSector: Healthcare Information Services | |
| MarketCap: 1839.05 Millions | |
| Recent Price: 32.31 Smart Investing & Trading Score: 10 | |
| Day Percent Change: 0.75% Day Change: 0.24 | |
| Week Change: 0.84% Year-to-date Change: -13.1% | |
| PGNY Links: Profile News Message Board | |
| Charts:- Daily , Weekly | |
| Add PGNY to Watchlist: View: Get Complete PGNY Trend Analysis ➞ | |
 | BCPC Balchem Corporation |
| Sector: Materials | |
| SubSector: Specialty Chemicals | |
| MarketCap: 3330.17 Millions | |
| Recent Price: 147.36 Smart Investing & Trading Score: 49 | |
| Day Percent Change: 0.74% Day Change: 1.08 | |
| Week Change: 5.82% Year-to-date Change: -0.9% | |
| BCPC Links: Profile News Message Board | |
| Charts:- Daily , Weekly | |
| Add BCPC to Watchlist: View: Get Complete BCPC Trend Analysis ➞ | |
 | GHC Graham Holdings Company |
| Sector: Services & Goods | |
| SubSector: Education & Training Services | |
| MarketCap: 1871.06 Millions | |
| Recent Price: 731.19 Smart Investing & Trading Score: 95 | |
| Day Percent Change: 0.74% Day Change: 5.38 | |
| Week Change: 1.86% Year-to-date Change: 5.0% | |
| GHC Links: Profile News Message Board | |
| Charts:- Daily , Weekly | |
| Add GHC to Watchlist: View: Get Complete GHC Trend Analysis ➞ | |
| For tabular summary view of above stock list: Summary View ➞ 0 - 25 , 25 - 50 , 50 - 75 , 75 - 100 , 100 - 125 , 125 - 150 , 150 - 175 , 175 - 200 , 200 - 225 , 225 - 250 , 250 - 275 , 275 - 300 , 300 - 325 , 325 - 350 , 350 - 375 , 375 - 400 , 400 - 425 , 425 - 450 , 450 - 475 , 475 - 500 , 500 - 525 , 525 - 550 , 550 - 575 , 575 - 600 , 600 - 625 , 625 - 650 , 650 - 675 , 675 - 700 | ||
| Click To Change The Sort Order: By Market Cap or Company Size Performance: Year-to-date, Week and Day | |
| Select Chart Type: | ||
| Too many stocks? View smallcap stocks filtered by marketcap & sector |
| Marketcap: All SmallCap Stocks (default-no microcap), Large, Mid-Range, Small & MicroCap |
| Sector: Tech, Finance, Energy, Staples, Retail, Industrial, Materials, Utilities & Medical |
|
Best Stocks Today 12Stocks.com |
© 2024 12Stocks.com Terms & Conditions Privacy Contact Us
All Information Provided Only For Education And Not To Be Used For Investing or Trading. See Terms & Conditions


One More Thing ... Get Best Stocks Delivered Daily!
Never Ever Miss A Move With Our Top Ten Stocks Lists
Find Best Stocks In Any Market - Bull or Bear Market
Take A Peek At Our Top Ten Stocks Lists: Daily, Weekly, Year-to-Date & Top Trends
Find Best Stocks In Any Market - Bull or Bear Market
Take A Peek At Our Top Ten Stocks Lists: Daily, Weekly, Year-to-Date & Top Trends
Smallcap Stocks With Best Up Trends [0-bearish to 100-bullish]: Origin Materials[100], Alignment Healthcare[100], Emergent BioSolutions[100], Enovix [100], Clearfield [100], Fluence Energy[100], TPI Composites[100], Janux [100], Conduent [100], Bloom Energy[100], E.W. Scripps[100]
Best Smallcap Stocks Year-to-Date:
Janux [482.74%], Viking [306.72%], Longboard [272.5%], Alpine Immune[239.34%], Bakkt [199.55%], Avidity Biosciences[195.24%], Vera [189.47%], Cullinan Oncology[176.9%], Super Micro[173.85%], Arcutis Bio[169.66%], Y-mAbs [154.69%] Best Smallcap Stocks This Week:
Emergent BioSolutions[102.34%], Deciphera [73.28%], Eyenovia [68.74%], Origin Materials[66.52%], Aspen Aerogels[54.66%], Enovix [51.85%], TPI Composites[41.91%], Codexis [41.73%], Cue Biopharma[41.39%], WideOpenWest [41.07%], Carvana Co[39.19%] Best Smallcap Stocks Daily:
WideOpenWest [29.16%], Ardelyx [28.65%], FTC Solar[25.09%], IES [23.96%], Twist Bioscience[23.18%], Origin Materials[22.23%], Alignment Healthcare[21.97%], Joint [18.43%], Emergent BioSolutions[17.73%], Butterfly [17.42%], Vaxxinity [17.27%]